Comparative Study
. 2015 May;18(5):773-8.
doi: 10.1038/nn.3983. Epub 2015 Mar 30.

Family income, parental education and brain structure in children and adolescents

Affiliations
Comparative Study

Family income, parental education and brain structure in children and adolescents

Kimberly G Noble et al. Nat Neurosci. 2015 May.

Abstract

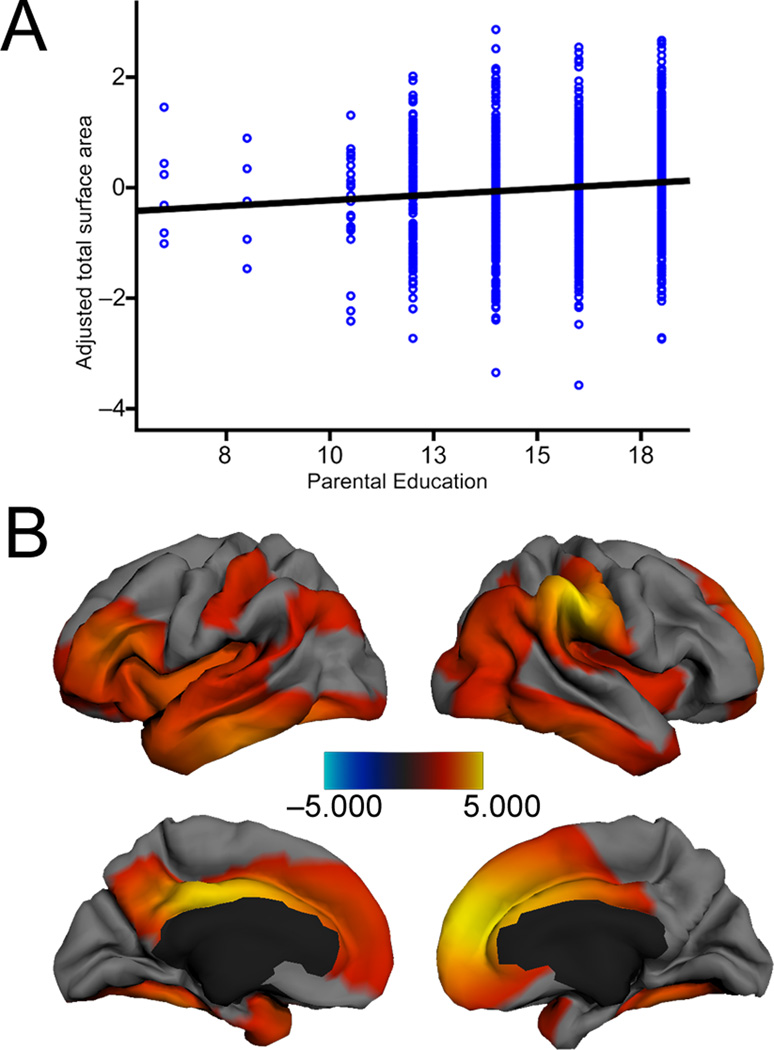
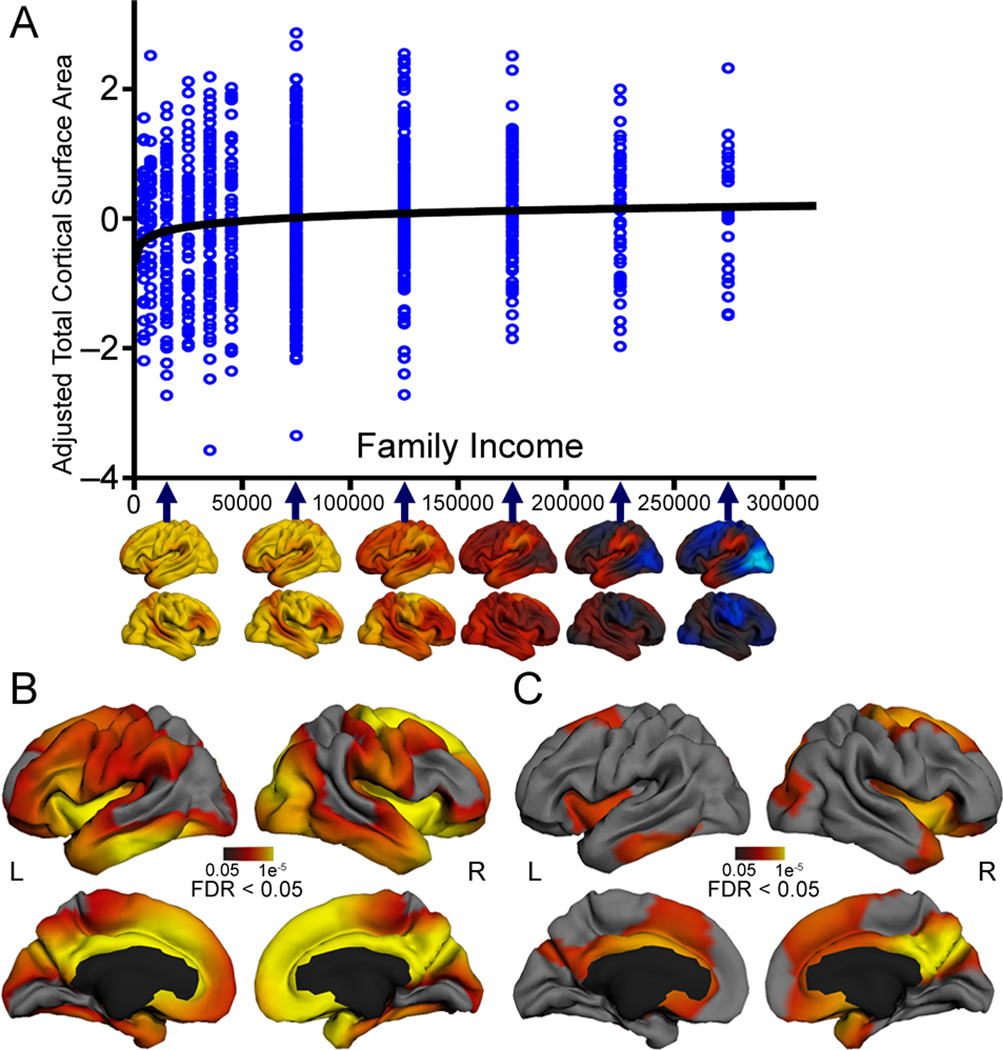
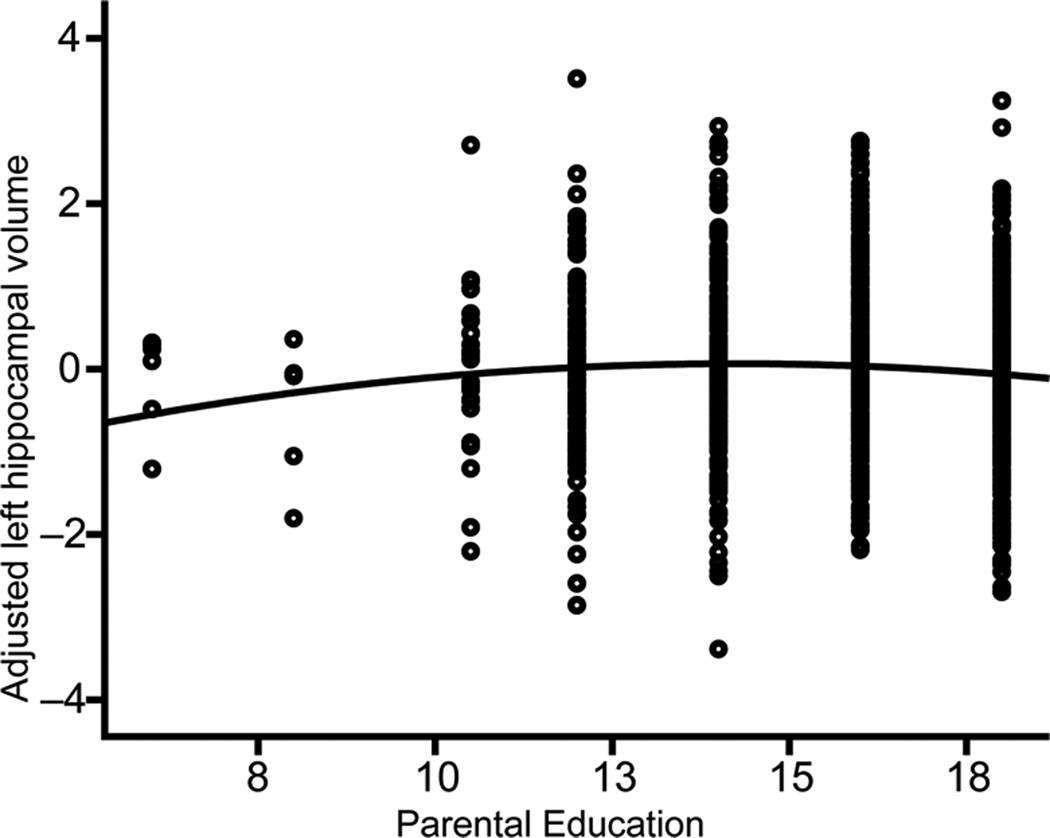
Socioeconomic disparities are associated with differences in cognitive development. The extent to which this translates to disparities in brain structure is unclear. We investigated relationships between socioeconomic factors and brain morphometry, independently of genetic ancestry, among a cohort of 1,099 typically developing individuals between 3 and 20 years of age. Income was logarithmically associated with brain surface area. Among children from lower income families, small differences in income were associated with relatively large differences in surface area, whereas, among children from higher income families, similar income increments were associated with smaller differences in surface area. These relationships were most prominent in regions supporting language, reading, executive functions and spatial skills; surface area mediated socioeconomic differences in certain neurocognitive abilities. These data imply that income relates most strongly to brain structure among the most disadvantaged children.


Conflict of interest statement

We declare no conflicts of interest for any authors.

Figures

Figure 1
Figure 1. Parent Education is Linearly Associated with Cortical Surface Area (N=1099)
A. Multiple regression showed that, when adjusting for age, age2, scanner, sex, and genetic ancestry, parental education was significantly associated with children’s cortical surface area in a number of regions. B. Left hemisphere regions included the left superior, middle, and inferior temporal gyri, inferior frontal gyrus, orbito-frontal gyrus and the precuneus. Right hemisphere regions included the middle temporal gyrus, inferior temporal gyrus, supramarginal gryus, middle frontal gyrus and superior frontal gyrus. Bilateral regions included the fusiform gyrus, temporal pole, insula, superior frontal gyrus, medial frontal gyrus, the cingulate cortex, inferior parietal cortex, lateral occipital cortex, and postcentral gyrus. Maps are thresholded at p <. 05 (FDR correction).
Figure 2
Figure 2. Family Income is Logarithmically Related to Cortical Surface Area (N=1099)
A. Multiple regression showed that, when adjusting for age, age2, scanner, sex, and genetic ancestry, family income was significantly logarithmically associated with children’s total cortical surface area, such that the steepest gradient was present at the lower end of the income spectrum (β = −0.19; p = 0.004). Income data are presented here on the untransformed scale, fitted with a logarithmic curve, to enable visualization of this asymptotic relationship. This differential rate of change is visualized with the brain maps, where the steepest change in cortical surface area per unit income is visualized with warm colors and the shallowest change in cortical surface area per unit income is visualized with cool colors. B. When adjusting for age, age2, scanner, sex, and genetic ancestry, ln(family income) was significantly associated with surface area in widespread regions of children’s bilateral frontal, temporal and parietal lobes. Relationships were strongest in bilateral inferior temporal, insula and inferior frontal gyrus, and in the right occipital and medial prefrontal cortex. C. When adjusting for age, age2, scanner, sex, genetic ancestry, and parent education, ln(family income) was significantly associated with surface area in a smaller number of regions including bilateral inferior frontal, cingulate, insula, and inferior temporal regions and in the right superior frontal and precuneus cortex. Maps are thresholded at p < .05 (FDR correction). More stringent FDR correction thresholds of .01 and .001 are shown in Supplementary Fig. 1a–c.
Figure 3
Figure 3. Parental Education is Quadratically Associated with Left Hippocampal Volume (N=1099)
Multiple regression showed that, when adjusting for age, age2, scanner, sex, genetic ancestry, and whole brain volume, parental education was significantly quadratically associated with children’s left hippocampal volume, such that the steepest gradient was present at the lower end of the education spectrum (β = −0.494; p = 0.016).

Comment in

  • The cost of brain structure.
    Zarate JM. Zarate JM. Nat Neurosci. 2015 May;18(5):619. doi: 10.1038/nn0515-619. Nat Neurosci. 2015. PMID: 25919961 No abstract available.

References

    1. Rosenzweig MR. Effects of differential experience on the brain and behavior. Developmental Neuropsychology. 2003;24:523–540. - PubMed
    1. Sowell ER, et al. Mapping cortical change across the human life span. Nature Neuroscience. 2003;6:309–315. - PubMed
    1. McLoyd VC. Socioeconomic disadvantage and child development. American Psychologist. 1998;53:185–204. - PubMed
    1. Brooks-Gunn J, Duncan GJ. The effects of poverty on children. [Review] [63 refs] Future of Children. 1997;7:55–71. - PubMed
    1. Hackman D, Farah MJ. Socioeconomic status and the developing brain. Trends in Cognitive Sciences. 2009;13:65–73. - PMC - PubMed

Publication types

MeSH terms