. 2015 Mar 30:4:e06253.
doi: 10.7554/eLife.06253.

Oxyntomodulin regulates resetting of the liver circadian clock by food

Affiliations

Oxyntomodulin regulates resetting of the liver circadian clock by food

Dominic Landgraf et al. Elife. .

Abstract

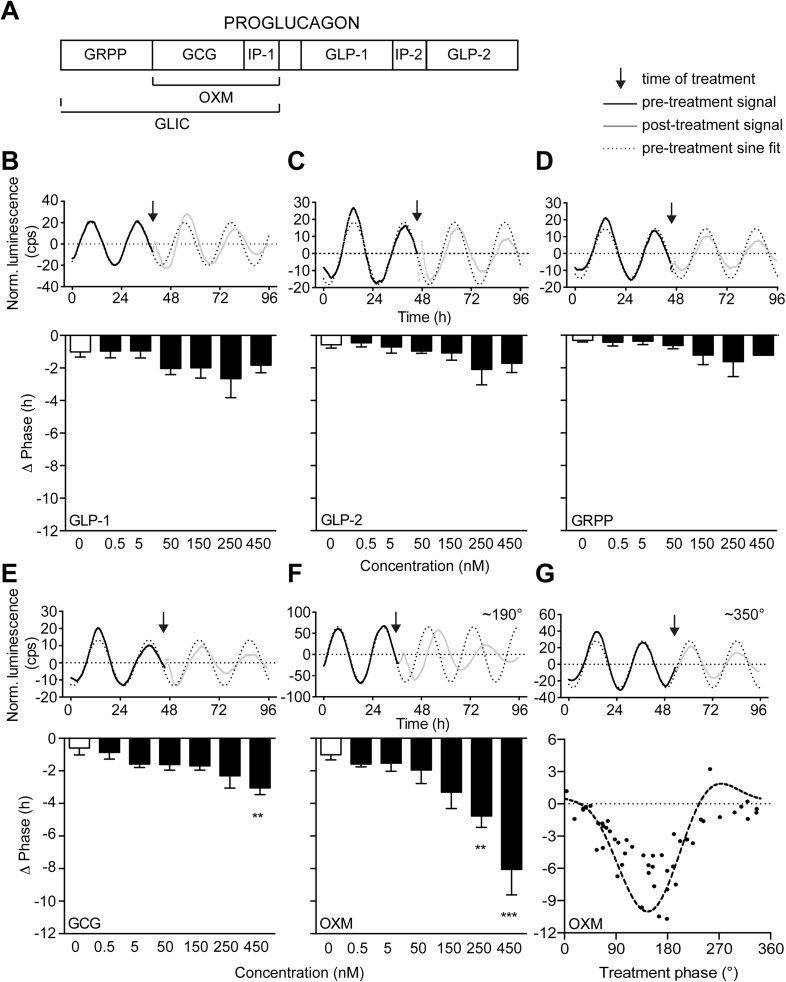
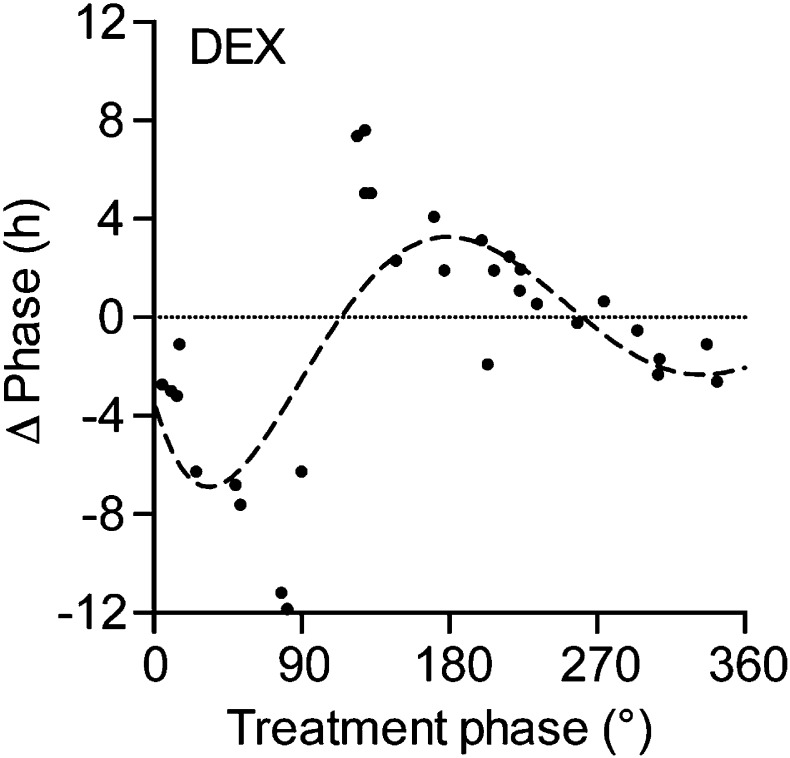
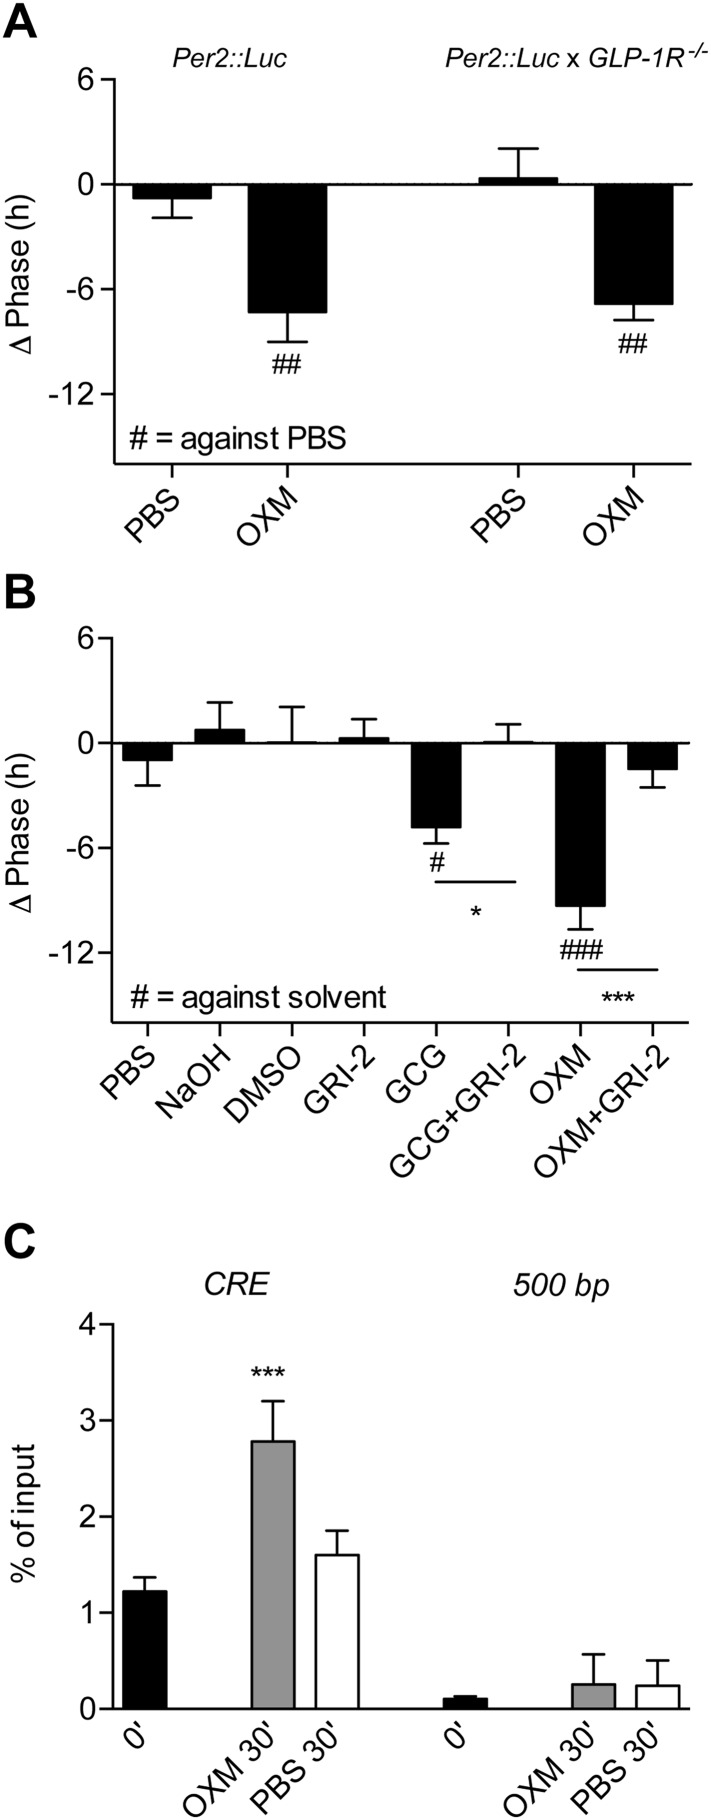
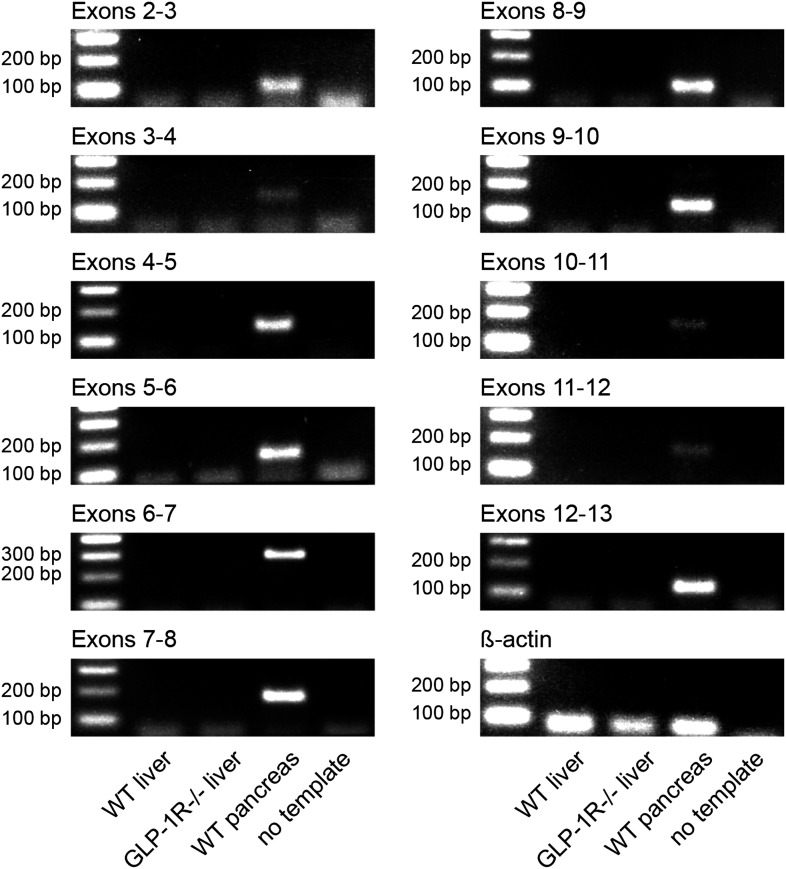
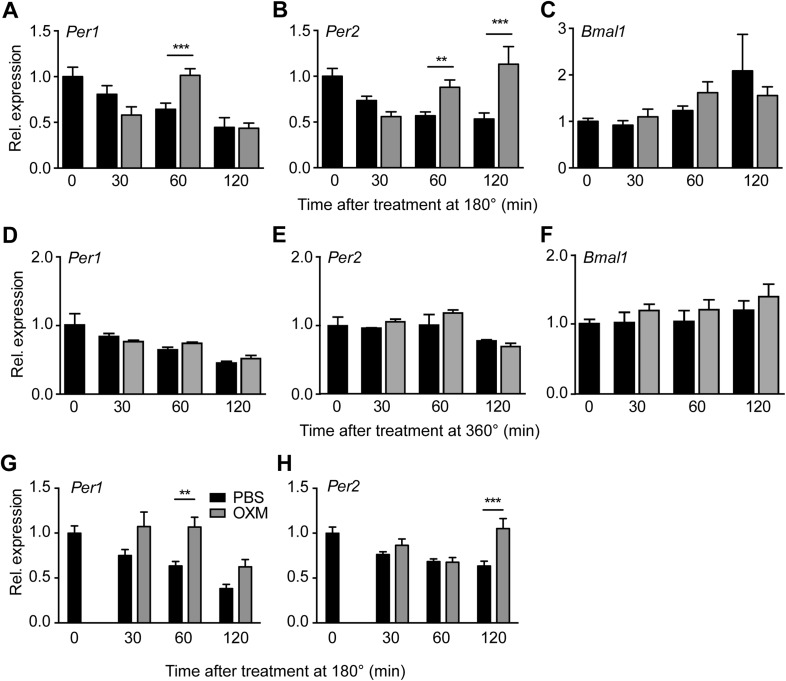
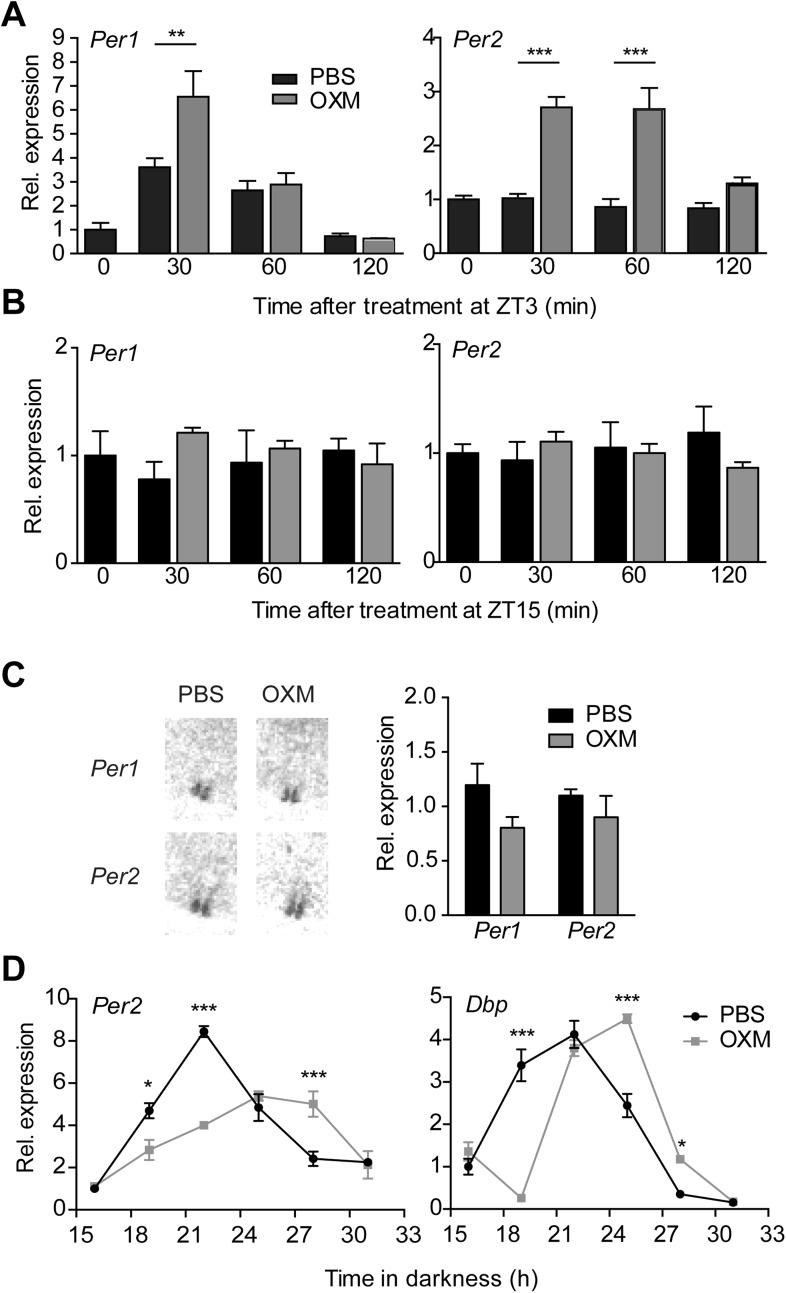
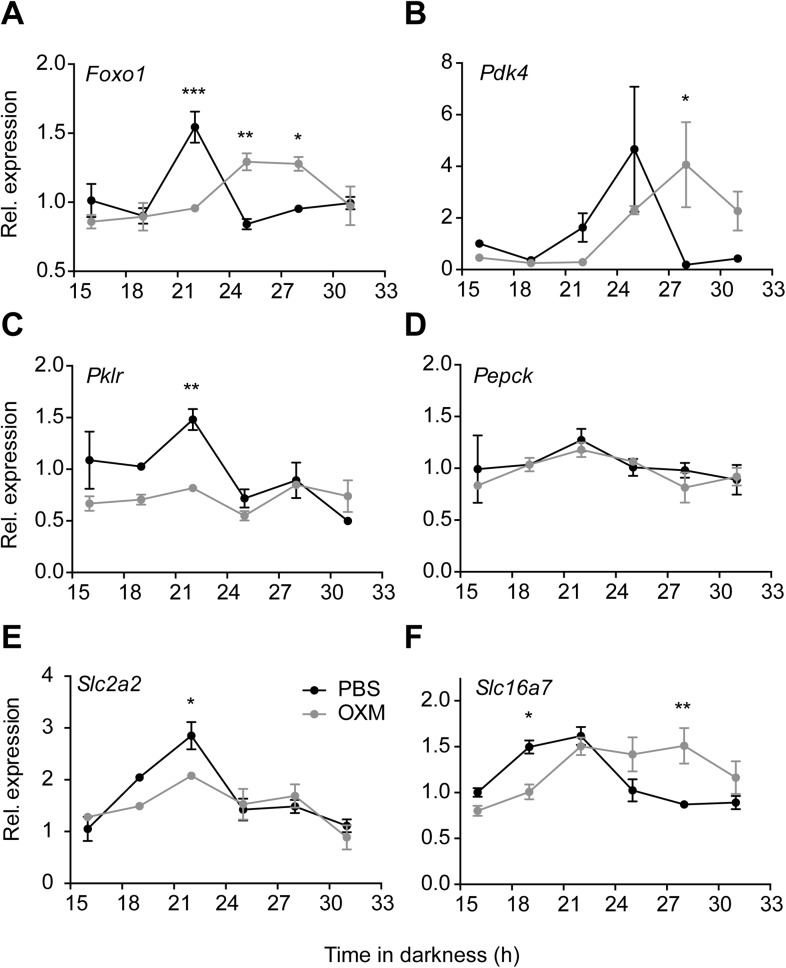
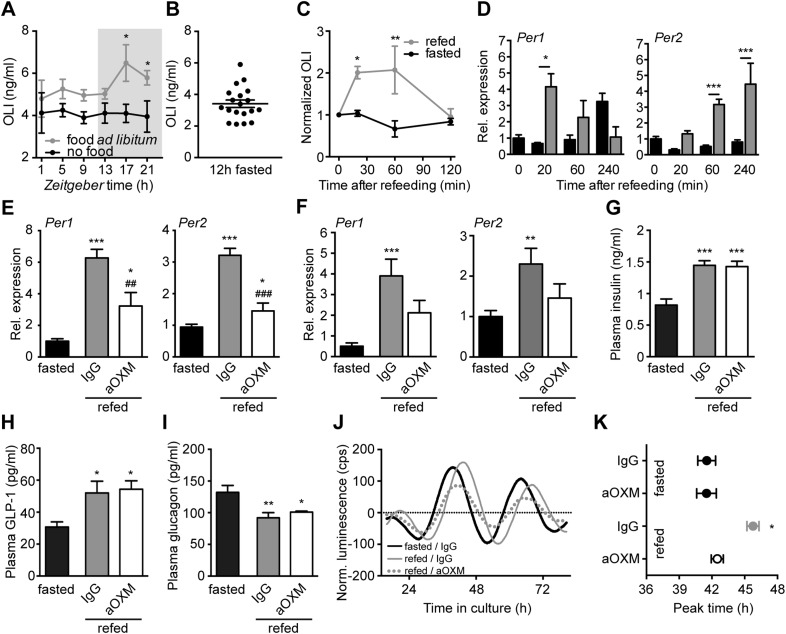
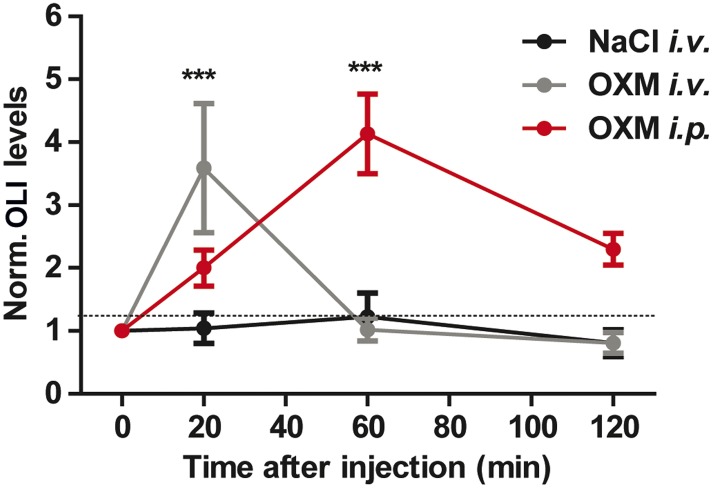
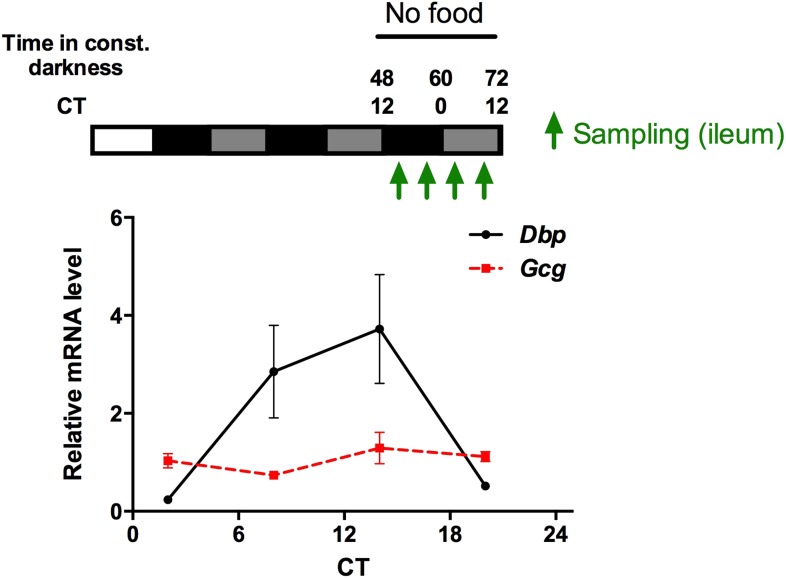
Circadian clocks coordinate 24-hr rhythms of behavior and physiology. In mammals, a master clock residing in the suprachiasmatic nucleus (SCN) is reset by the light-dark cycle, while timed food intake is a potent synchronizer of peripheral clocks such as the liver. Alterations in food intake rhythms can uncouple peripheral clocks from the SCN, resulting in internal desynchrony, which promotes obesity and metabolic disorders. Pancreas-derived hormones such as insulin and glucagon have been implicated in signaling mealtime to peripheral clocks. In this study, we identify a novel, more direct pathway of food-driven liver clock resetting involving oxyntomodulin (OXM). In mice, food intake stimulates OXM secretion from the gut, which resets liver transcription rhythms via induction of the core clock genes Per1 and 2. Inhibition of OXM signaling blocks food-mediated resetting of hepatocyte clocks. These data reveal a direct link between gastric filling with food and circadian rhythm phasing in metabolic tissues.

Keywords: Per; biochemistry; cell biology; circadian clock; clock genes; food resetting; liver; mouse.


Conflict of interest statement

The authors declare that no competing interests exist.

Figures

Figure 1.
Figure 1.. Oxyntomodulin (OXM) phase- and dose-dependently resets circadian clocks in liver slices.
(A) Schematic sequence of the proglucagon-derived peptides (GRPP—glicentin-related pancreatic peptide; GLIC—glicentin; OXM—oxyntomodulin; GCG—glucagon; IP-1—intervening peptide-1; GLP-1—glucagon-like peptide-1; IP-2—intervening peptide-2; GLP-2—glucagon-like peptide-2). (BF) Example luminescence traces and dose-dependent responses for GLP-1 (B; F(6, 28) = 1.509), GLP-2 (C; F(6, 28) = 1.530), GRPP (D; F(6, 28) = 1.151), GCG (E; F(6, 28) = 3.569), and OXM (F; F(6, 28) = 8.790)-induced phase resetting of PER2::LUC rhythms in liver slices treated at 180–200°. Data are presented as mean ± S.E.M. (n = 5). One-way ANOVA (F-values with degrees of freedom provided in brackets): *p < 0.05; **p < 0.01; ***p < 0.001. Asterisks indicate significant differences relative to PBS treatment (white bars). (G) Phase response curve for OXM-induced phase resetting of PER2::LUC rhythms in liver slices. Circles: raw data of individual slices; dashed line: sine wave regression with harmonics. DOI: http://dx.doi.org/10.7554/eLife.06253.003
Figure 1—figure supplement 1.
Figure 1—figure supplement 1.. Phase response curve for dexamethasone (DEX) treatment in Per2::LUC liver slice cultures.
Black dots: phase shifts of individual DEX treatments (100 µM); dashed line: sine wave regression with first and second order harmonics (CircWave). DOI: http://dx.doi.org/10.7554/eLife.06253.005
Figure 2.
Figure 2.. Glucagon (GCG) receptor regulates phase resetting effects of OXM and GCG in Per2::LUC liver slices.
(A) OXM-induced phase shifts in Per2::LUC and Per2::LUC x Glp1r−/− liver slices. Mann–Whitney test: ##p < 0.01 against solvent. (B) GCG and OXM-induced phase shifts in Per2::LUC slices are abolished by co-treatment with GRI-2. One-way ANOVA with Bonferroni post-test: p < 0.05; ###p < 0.001 against solvent; *p < 0.05; ***p < 0.001. Data are presented as mean ± S.E.M. (n = 8); F(7, 56) = 7.314. (C) OXM treatment promotes binding of CREB to CRE elements at the Per1 gene promoter. One-way ANOVA with Bonferroni post-test: ***p < 0.001 against 0′. Data are presented as mean ± S.E.M. (n = 5; F(5, 24) = 22.2). DOI: http://dx.doi.org/10.7554/eLife.06253.006
Figure 2—figure supplement 1.
Figure 2—figure supplement 1.. Absence of Glp1r transcripts in mouse liver.
RT-PCR with different primer sets targeting all annotated coding exons of the murine Glp1r gene. Exon 1 was not tested, as it mainly contains non-coding poly-C- and poly-G-rich sequences, which precludes specific primer design. cDNA preparations from wild-type livers were tested (lane 2). Wild-type pancreas cDNA was chosen as positive (lane 4) and liver cDNA from Glp1r-deficient mice and water as negative controls (lanes 3 and 5). Lane 1: 100-bp DNA ladder. DOI: http://dx.doi.org/10.7554/eLife.06253.007
Figure 3.
Figure 3.. OXM treatment induces Per1/2 expression in organotypic liver slices.
(AC) WT liver slices were treated with OXM (grey) or vehicle (PBS; black) at 180° and analyzed for clock gene expression of Per1 (A; factor treatment F(1, 40) = 0.785; time F(3, 40) = 34.95; interaction F(3, 40) = 16.33), Per2 (B; factor treatment F(1, 40) = 24.02; time F(3, 40) = 29.4; interaction F(3, 40) = 38.38), and Bmal1 (C; factor treatment F(1, 40) = 0.108; time F(3, 40) = 17.39; interaction F(3, 40) = 3.607) by qPCR. (DF) WT liver slices were treated with OXM (grey) or PBS (black) at 360° and analyzed for expression of Per1 (D; factor treatment F(1, 40) = 1.179; time F(3, 40) = 36.33; interaction F(3, 40) = 1.349), Per2 (E; factor treatment F(1, 40) = 5.757; time F(3, 40) = 13.57; interaction F(3, 40) = 1.135), and Bmal1 (F; factor treatment F(1, 40) = 4.112; time F(3, 40) = 8.788; interaction F(3, 40) = 0.491) by qPCR. (G and H) OXM-induced Per1/2 expression is retained in Glp1r−/− liver slices. Per1: factor treatment F(1, 42) = 8.48; time F(2, 42) = 10.95; interaction F(2, 42) = 0.525. Per2: factor treatment F(1, 42) = 10.5; time F(2, 42) = 3.662; interaction F(2, 42) = 5.845. Glp1r−/− liver slices were treated as described for WT above. Data are presented as mean ± S.E.M. (n = 6 for WT and 8 for Glp1r−/−). Two-way ANOVA with Bonferroni post-test: **p < 0.01; ***p < 0.001. DOI: http://dx.doi.org/10.7554/eLife.06253.008
Figure 4.
Figure 4.. OXM treatment induces Per1/2 expression and resets the liver circadian clock in vivo.
(A and B) Hepatic Per gene expression after OXM (grey) or vehicle (PBS; black) i.v. injection at ZT3 (A) and ZT15 (B). ZT3: Per1: factor treatment F(1, 24) = 5.695; time F(2, 24) = 34.74; interaction F(2, 24) = 4.965; Per2: factor treatment F(1, 24) = 64.84; time F(2, 24) = 9.381; interaction F(2, 24) = 6.915. ZT15: Per1: factor treatment F(1, 12) = 1.096; time F(2, 12) = 0.005; interaction F(2, 12) = 1.367; Per2: factor treatment F(1, 24) = 0.255; time F(2, 24) = 0.001; interaction F(2, 24) = 1.172. (C) Suprachiasmatic nucleus (SCN) signal after in situ hybridization (ISH) of brain sections with 35S-labelled antisense probes for Per1/2 30 min after OXM/PBS treatment at ZT3 in the same animals used in (A). Left panel: representative autoradiograph scans containing the SCN; right panel: quantification of the ISH. (D) Resetting of Per2 and Dbp rhythms in livers of wild-type mice after an i.p. injection of either OXM (grey) or vehicle (PBS; black) after 12-hr darkness; Per2: factor treatment F(1, 24) = 5.531; time F(5, 24) = 46.37; interaction F(5, 24) = 18.71. Dbp: factor treatment F(1, 24) = 0.094; time F(5, 24) = 119.2; interaction F(5, 24) = 38.58. All data are presented as mean ± S.E.M. (n = 3–5). A, B, and D: two-way ANOVA with Bonferroni post-test: *p < 0.05, **p < 0.01; ***p < 0.001; C: Mann–Whitney test. DOI: http://dx.doi.org/10.7554/eLife.06253.009
Figure 5.
Figure 5.. OXM treatment modulates diurnal expression profile of hepatic genes involved in liver carbohydrate metabolism.
(AF) Relative gene expression of Foxo1 (A; factor treatment F(1, 24) = 0.001, time F(5, 24) = 5.547, interaction F(5, 24) = 11.13), Pdk4 (B; factor treatment F(1, 24) = 0.197, time F(5, 24) = 3.35, interaction F(5, 24) = 3.247), Pklr (C; factor treatment F(1, 24) = 11.63, time F(5, 24) = 5.61, interaction F(5, 24) = 3.61), Pepck (D; factor treatment F(1, 24) = 0.574, time F(5, 24) = 2.043, interaction F(5, 24) = 0.299), the glucose transporter Slc2a2 (E; factor treatment F(1, 24) = 2.582, time F(5, 24) = 15.98, interaction F(5, 24) = 2.642) and the pyruvate transporter Slc16a7 (F; factor treatment F(1, 24) = 1.539, time F(5, 24) = 7.472, interaction F(5, 24) = 6.586) after i.p. administration of either OXM (grey) or vehicle (PBS; black) after 12 hr in darkness. Data are presented as mean ± S.E.M. (n = 4). Two-way ANOVA with Bonferroni post-test: *p < 0.05, **p < 0.01; ***p < 0.001. DOI: http://dx.doi.org/10.7554/eLife.06253.010
Figure 6.
Figure 6.. Endogenous OXM signaling regulates food intake-mediated resetting of the liver circadian clock.
(A) Plasma oxyntomodulin-like immunoreactivity (OLI) diurnal profiles under ad libitum food and fasting conditions. Data are presented as mean ± S.E.M (n = 6); factor time F(5, 60) = 0.628, feeding condition F(1, 60) = 15.37, interaction F(5, 60) = 0.638. Grey shading indicates the dark phase. (B) OLI levels show high individual variations in mice after 12 hr of food deprivation (ZT13-1). (C) Plasma OLI (normalized to individual fasting levels) after refeeding (grey line) or under continuous starving (black line); factor time F(3, 21) = 3.544, feeding condition F(1, 21) = 15.82, interaction F(3, 21) = 4.717. (D) Liver Per1/2 induction following fasting-refeeding determined by qPCR; Per1: factor time F(3, 25) = 0.454, feeding condition F(1, 25) = 1.376, interaction F(3, 25) = 4.453; Per2: factor time F(3, 25) = 6.938, feeding condition F(1, 25) = 38.48, interaction F(3, 25) = 3.767. (E) WT and (F) Glp1r−/− liver Per1/2 expression after fasting-refeeding with control IgG injection (grey) or OXM immuno-neutralization by anti-OXM IgG (aOXM) injection at ZT0; WT: Per1: F(2, 12) = 71.76, Per2: F(2, 12) = 47.41; Glp1r−/−: Per1 F(2, 12) = 11.51, Per2: F(2, 12) = 5.585. (GI) Treatment with anti-OXM IgG does not affect postprandial regulation of insulin, GLP-1, and GCG. Plasma levels of insulin (G; F(2, 12) = 17.44), GLP-1 (H; F(2, 12) = 5.563), and GCG (I; F(2, 12) = 7.128) after fasting-refeeding with control IgG injection (grey) or OXM immuno-neutralization by anti-OXM IgG (aOXM) treatment at ZT0. One- (EI) or two-way ANOVA (A, C, D) with Bonferroni post-test: *p < 0.05; **p < 0.01; ***p < 0.001 against fasted; ##p < 0.01; ###p < 0.001 against IgG. Data are presented as mean ± S.E.M (n = 5). (J and K) Liver PER2::LUC rhythms after fasting-refeeding with control IgG or αOXM administration. (J) Representative luminescence traces. (K) Comparison of phases (second peak in culture) after refeeding and/or anti-OXM treatment (Data are presented as mean ± S.E.M (n = 4 mice per condition, an average of 3 slice preparations of each mouse were used); two-way ANOVA with Bonferroni post-test: *p < 0.05 against fasted; factor treatment F(1, 12) = 5.127, feeding condition F(1, 12) = 13.02, interaction F(1, 12) = 5.044). DOI: http://dx.doi.org/10.7554/eLife.06253.011
Figure 6—figure supplement 1.
Figure 6—figure supplement 1.. Time course of OLI plasma levels after OXM injection.
Time course of OLI appearance in plasma following i.v. (4 μg) or i.p. (25 μg) injections of OXM. OLI plasma level changes are expressed relative to starving levels (0 min) for each individual. Data are presented as mean ± SEM (n = 5). 2-way ANOVA with Bonferroni post-test: ***p < 0.001; factor treatment F(2, 48) = 9.014, feeding condition F(3, 48) = 4.95, interaction F(6, 48) = 5.698. DOI: http://dx.doi.org/10.7554/eLife.06253.013
Author response image 1.
Circadian mRNA expression of Gcg and Dbp in the gut of fasted mice. Animals were released into constant darkness and samples were collected at 4 time points under fasting conditions on day 3. While Dbp shows a robust circadian rhythm, Gcg mRNA is expressed at comparable levels throughout the circadian cycle. Data are mean ± SEM (n = 4). DOI: http://dx.doi.org/10.7554/eLife.06253.016

Comment in

  • Feeding time.
    Piggins HD, Bechtold DA. Piggins HD, et al. Elife. 2015 May 27;4:e08166. doi: 10.7554/eLife.08166. Elife. 2015. PMID: 26012377 Free PMC article.

References

    1. Akhtar RA, Reddy AB, Maywood ES, Clayton JD, King VM, Smith AG, Gant TW, Hastings MH, Kyriacou CP. Circadian cycling of the mouse liver transcriptome, as revealed by cDNA microarray, is driven by the suprachiasmatic nucleus. Current Biology. 2002;12:540–550. doi: 10.1016/S0960-9822(02)00759-5. - DOI - PubMed
    1. Albrecht U. Timing to perfection: the biology of central and peripheral circadian clocks. Neuron. 2012;74:246–260. doi: 10.1016/j.neuron.2012.04.006. - DOI - PubMed
    1. Albrecht U, Sun ZS, Eichele G, Lee CC. A differential response of two putative mammalian circadian regulators, mper1 and mper2, to light. Cell. 1997;91:1055–1064. doi: 10.1016/S0092-8674(00)80495-X. - DOI - PubMed
    1. Antunes LC, Levandovski R, Dantas G, Caumo W, Hidalgo MP. Obesity and shift work: chronobiological aspects. Nutrition Research Reviews. 2010;23:155–168. doi: 10.1017/S0954422410000016. - DOI - PubMed
    1. Arble DM, Bass J, Laposky AD, Vitaterna MH, Turek FW. Circadian timing of food intake contributes to weight gain. Obesity. 2009;17:2100–2102. doi: 10.1038/oby.2009.264. - DOI - PMC - PubMed

Publication types

MeSH terms