Comparative Study
. 2015 May;125(5):1827-38.
doi: 10.1172/JCI77990. Epub 2015 Mar 30.

Biomarkers on patient T cells diagnose active tuberculosis and monitor treatment response

Comparative Study

Biomarkers on patient T cells diagnose active tuberculosis and monitor treatment response

Toidi Adekambi et al. J Clin Invest. 2015 May.

Erratum in

Abstract

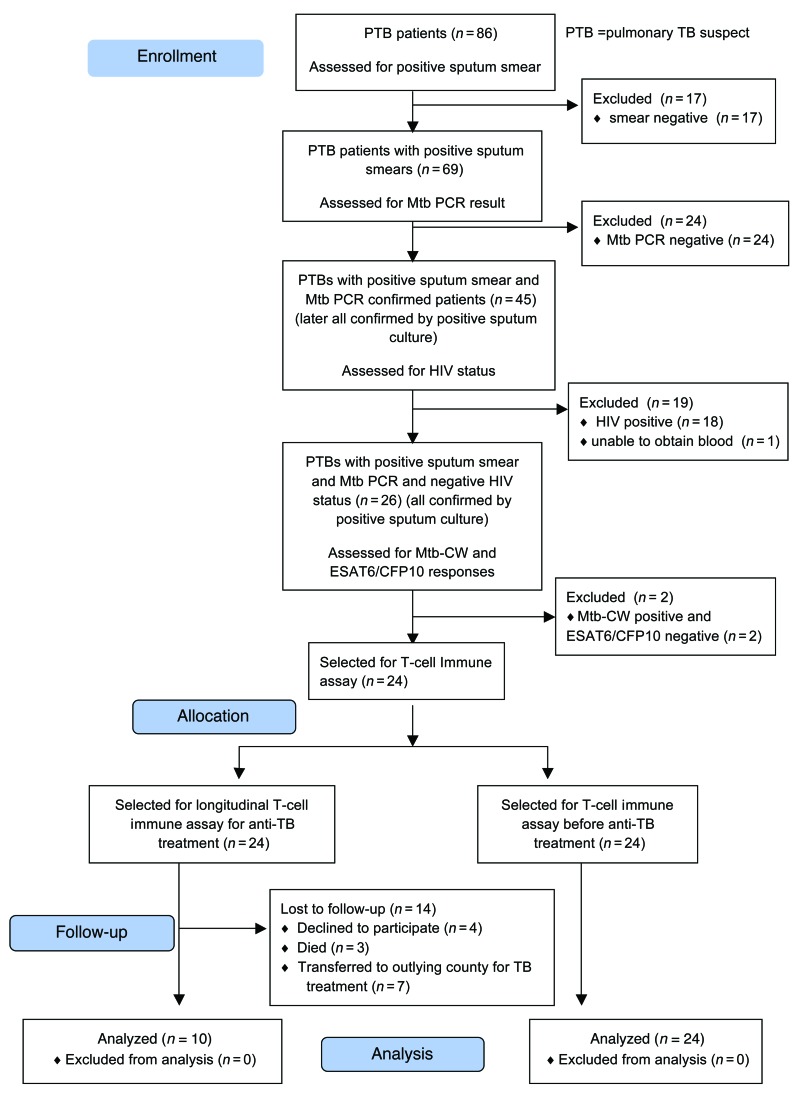
Background: The identification and treatment of individuals with tuberculosis (TB) is a global public health priority. Accurate diagnosis of pulmonary active TB (ATB) disease remains challenging and relies on extensive medical evaluation and detection of Mycobacterium tuberculosis (Mtb) in the patient's sputum. Further, the response to treatment is monitored by sputum culture conversion, which takes several weeks for results. Here, we sought to identify blood-based host biomarkers associated with ATB and hypothesized that immune activation markers on Mtb-specific CD4+ T cells would be associated with Mtb load in vivo and could thus provide a gauge of Mtb infection.

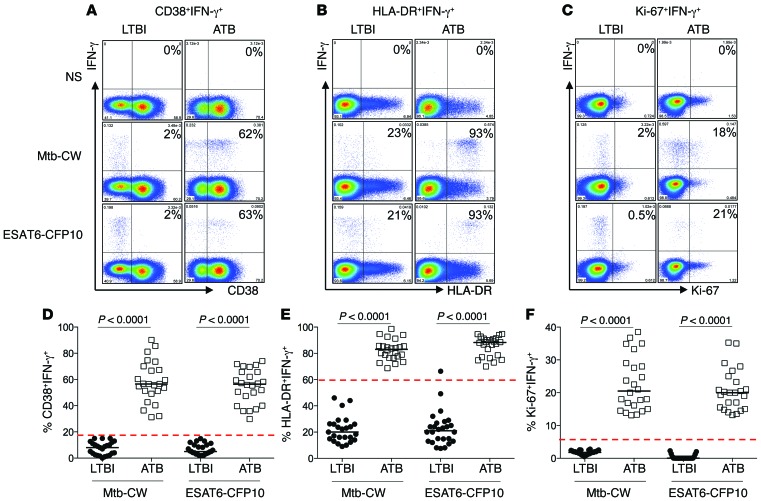
Methods: Using polychromatic flow cytometry, we evaluated the expression of immune activation markers on Mtb-specific CD4+ T cells from individuals with asymptomatic latent Mtb infection (LTBI) and ATB as well as from ATB patients undergoing anti-TB treatment.

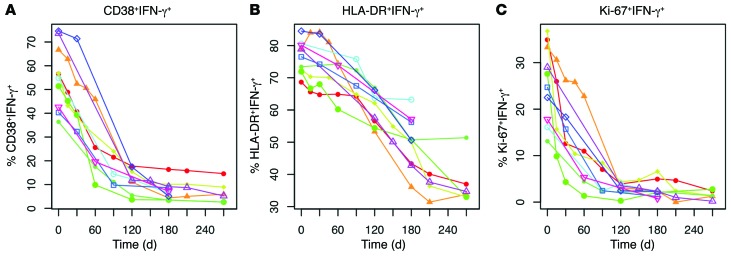
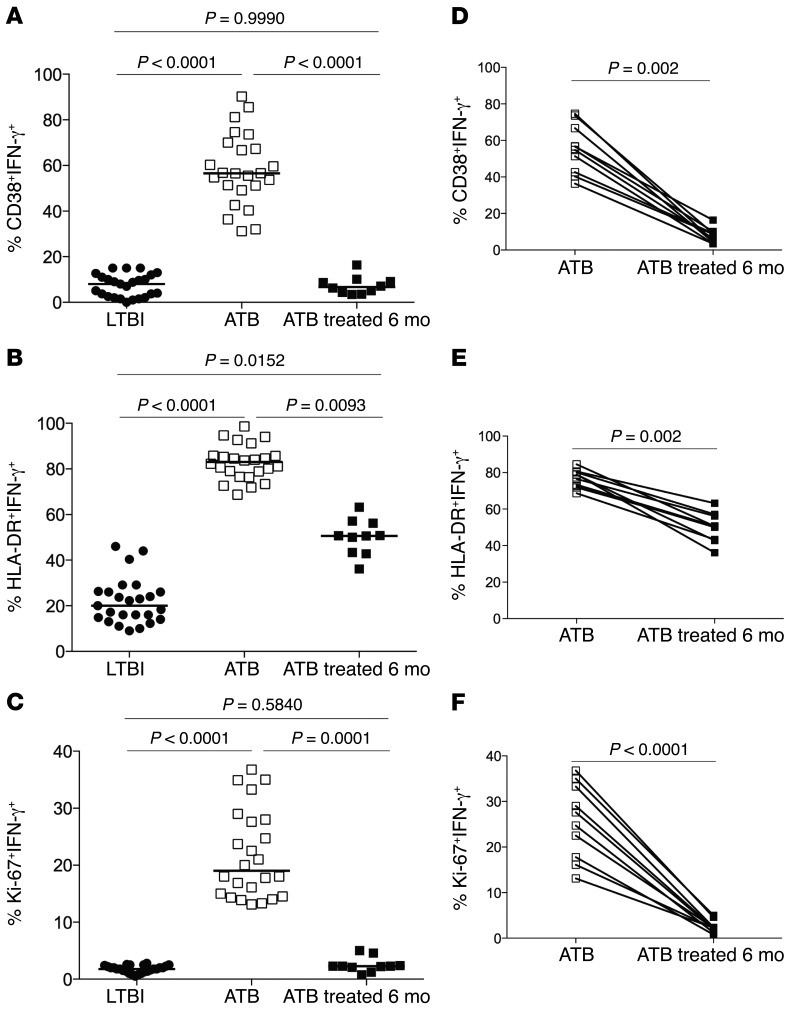
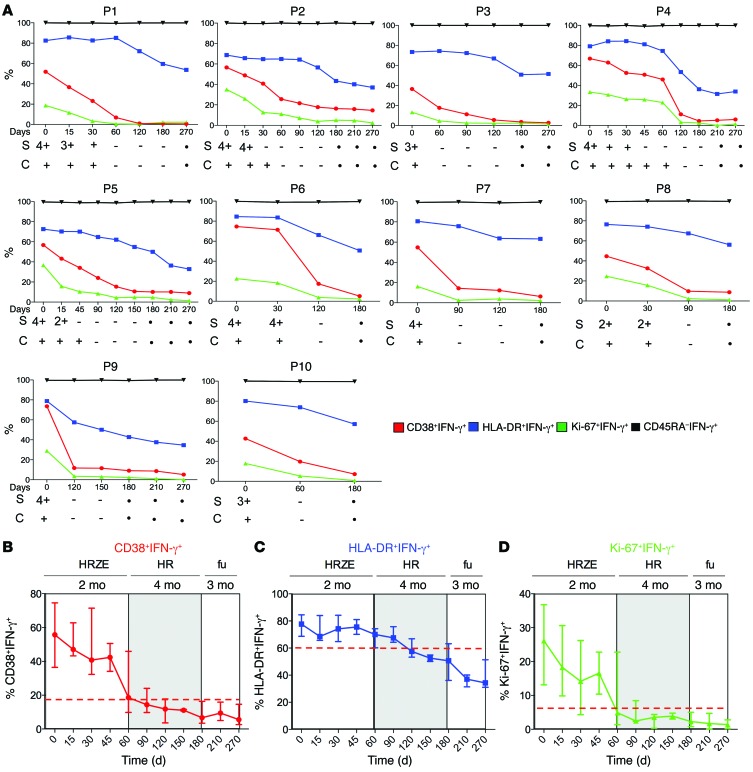
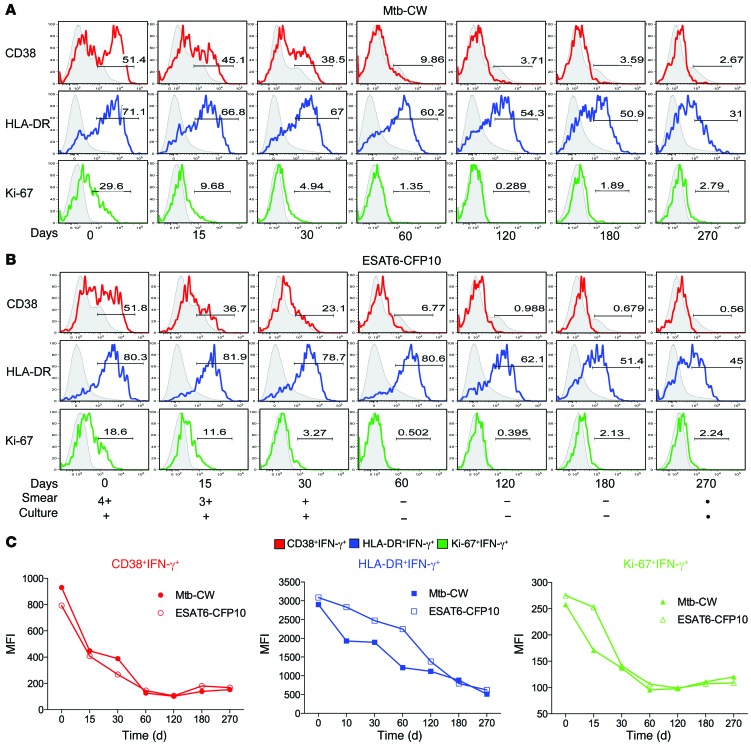
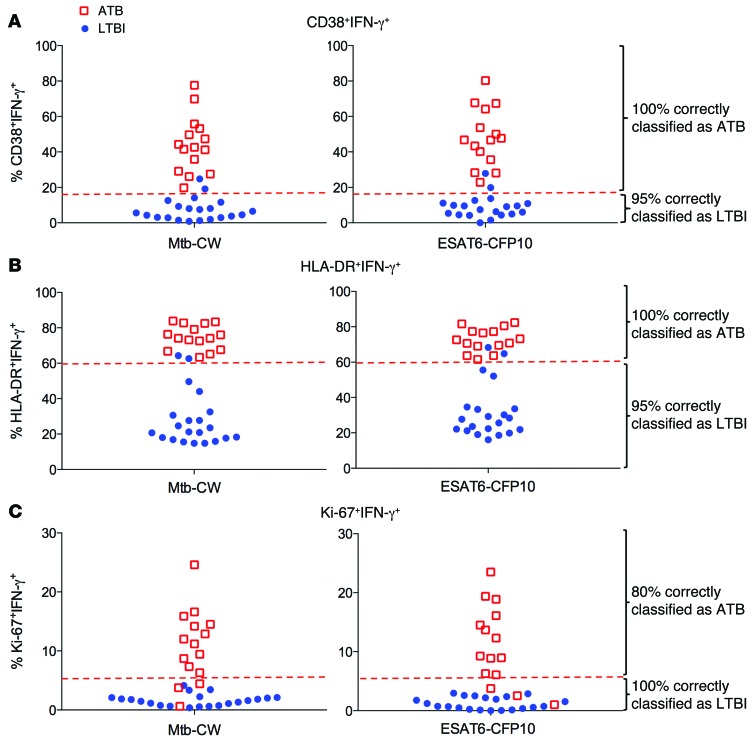
Results: Frequencies of Mtb-specific IFN-γ+CD4+ T cells that expressed immune activation markers CD38 and HLA-DR as well as intracellular proliferation marker Ki-67 were substantially higher in subjects with ATB compared with those with LTBI. These markers accurately classified ATB and LTBI status, with cutoff values of 18%, 60%, and 5% for CD38+IFN-γ+, HLA-DR+IFN-γ+, and Ki-67+IFN-γ+, respectively, with 100% specificity and greater than 96% sensitivity. These markers also distinguished individuals with untreated ATB from those who had successfully completed anti-TB treatment and correlated with decreasing mycobacterial loads during treatment.

Conclusion: We have identified host blood-based biomarkers on Mtb-specific CD4+ T cells that discriminate between ATB and LTBI and provide a set of tools for monitoring treatment response and cure.

Trial registration: Registration is not required for observational studies.

Funding: This study was funded by Emory University, the NIH, and the Yerkes National Primate Center.


Figures

Figure 9
Figure 9. Graphical representation of linear mixed-effects modeling of anti-TB treatment response.
The linear mixed-effects model was used to show that frequencies of CD38+IFN-γ+ (A), HLA-DR+IFN-γ+ (B), and Ki-67+IFN-γ+ (C) T cells decreased significantly in response to anti-TB treatment in each patient with drug-susceptible TB.
Figure 8
Figure 8. Frequencies of activated Mtb-specific CD4+ T cells reflect bacterial load.
Analysis of the frequencies of (A) CD38+IFN-γ+ T cells (B), HLA-DR+IFN-γ+ T cells, and (C) Ki-67+IFN-γ+ T cells in PBMCs from individuals with LTBI (n = 25) and treatment-naive ATB (n = 24) as well as those who received 6 months of anti-TB treatment (ATB treated 6 mo; n = 10). Mann-Whitney U test was used to compare the differences between groups. Bars represent medians. P < 0.05 was considered statistically significant. Analysis of the frequencies of (D) CD38+IFN-γ+ T cells, (E) HLA-DR+IFN-γ+ T cells, and (F) Ki-67+IFN-γ+ T cells of treatment-naive ATB (n = 10) and ATB treated individuals (6 months) (n = 10). Wilcoxon matched-paired rank test was used for comparison between paired samples. P < 0.05 was considered statistically significant.
Figure 7
Figure 7. Longitudinal monitoring of the frequencies of activated Mtb-specific CD4+ T cells during anti-TB treatment in ATB patients.
(A) Frequencies of CD38+IFN-γ+, HLA-DR+IFN-γ+, Ki-67+IFN-γ+, and CD45RA IFN-γ+CD4+ T cells in 10 different ATB patients (P1 to P10) over the course of anti-TB treatment after stimulation with Mtb-CW. Treatment response and culture conversion were monitored in sputum by smear microscopy and culture. These results are shown for the time of diagnosis (day 0) and at time points following treatment initiation. Detection of AFB in sputum specimens by smear and culture is indicated by a positive (+) result. The smear grade recorded for each positive result is indicated numerically (4+, 3+, 2+, or +). A negative (–) result by either smear or culture indicates that Mtb was not detected in sputum specimens at those time points and indicates that that sample was not tested. Cumulative data for patients P1 to P10 are presented for (B) CD38+IFN-γ+, (C) HLA-DR+IFN-γ+, and (D) Ki-67+IFN-γ+ T cells over the course of anti-TB treatment. Values are expressed as median on the y axis and as follow-up days on the x axis. The 2-month intensive phase (HRZE), 4-month continuation phase (HR), and follow-up (fu) posttreatment completion are indicated.
Figure 6
Figure 6. CD38+IFN-γ+, HLA-DR+IFN-γ+, and Ki-67+IFN-γ+ T cells in ATB patients correlate with response to anti-TB treatment.
Representative histograms of longitudinal 9-month monitoring of the frequencies of Mtb-specific activated CD4+ T cells in P1 at baseline (day 0) and at the indicated time points following treatment initiation. Frequencies of CD38+IFN-γ+ (red), HLA-DR+IFN-γ+ (blue), and Ki-67+IFN-γ+ T cells (green) after stimulation with Mtb-CW (A) and ESAT6-CFP10 (B) are shown. Detection of AFB in sputum specimens by smear and culture is indicated by a positive (+) result. The smear grade recorded for each positive result is indicated numerically (4+, 3+, 2+, or +). A negative (–) result by either smear or culture indicates that Mtb was not detected in sputum specimens at those time points and indicates that that sample was not tested. (C) Representation of MFI data of CD38+IFN-γ+, HLA-DR+IFN-γ+, and Ki-67+IFN-γ+CD4+ T cells during the course of anti-TB treatment in patient P1 after stimulation with Mtb-CW (red circles) or ESAT6-CFP10 (open blue squares).
Figure 5
Figure 5. Frequencies of CD38+IFN-γ+, HLA-DR+IFN-γ+, and Ki-67+IFN-γ+ in the validation cohort.
PBMCs from individuals (n = 36) recruited in the Western Cape, South Africa, were stimulated with Mtb-CW antigens and ESAT6-CFP10 peptide pools or nonstimulated. The frequencies of activated Mtb-specific CD4+ T cells were analyzed by flow cytometry. Summary of the data are shown for frequencies of CD38+IFN-γ+ T cells (A), HLA-DR+IFN-γ+ T cells (B), and Ki-67+IFN-γ+ T cells (C). The red, dashed lines represent the cutoffs established from the Georgian cohort: (A) 18% for CD38+IFN-γ+, (B) 60% for HLA-DR+IFN-γ+, and (C) 5% for Ki-67+IFN-γ+. Red open squares and blue circles correspond to individuals with ATB and LTBI, respectively, after unblinding.
Figure 4
Figure 4. CD38, HLA-DR, and Ki-67 expression on bulk CD4+ T cells in the test cohort.
Nonstimulated PBMCs from LTBI (n = 25) and treatment-naive ATB (n = 24) were analyzed for immune activation markers by flow cytometry. Mann-Whitney U test was used to compare the 2 groups. Bars represent medians. P < 0.05 was considered statistically significant.
Figure 3
Figure 3. CD38, HLA-DR, and Ki-67 expression on IFN-γ+CD4+ T cells discriminates between ATB and LTBI in the test cohort.
PBMCs from individuals with LTBI (black circles, n = 25) and ATB (white squares, n = 24) were stimulated with Mtb-CW antigens and ESAT6-CFP10 peptide pools or nonstimulated (NS). The frequencies of activated Mtb-specific CD4+ T cells were analyzed by flow cytometry. Representative flow plots and summary of the data are shown for frequencies of CD38+IFN-γ+ T cells (A and D), HLA-DR+IFN-γ+ T cells (B and E), and Ki-67+IFN-γ+ T cells (C and F) in LTBI and ATB groups. The percentages represent the frequencies of Mtb-specific IFN-γ+CD4+ T cells that express CD38, HLA-DR, or Ki-67. ROC analysis to determine the predictive value of each marker for classifying ATB and LTBI (Supplemental Figure 2) resulted in AUC values of 1.0. The red, dashed lines represent the discrimination threshold for each marker and show cutoff values of 18%, 60%, and 5% for CD38+IFN-γ+, HLA-DR+IFN-γ+, and Ki-67+IFN-γ+, respectively. Mann-Whitney U test was used to compare the 2 groups. Bars represent medians. P < 0.05 was considered statistically significant.
Figure 2
Figure 2. Analysis of IFN-γ+CD4+ T cells in the test cohort.
PBMCs from individuals with LTBI (n = 25) and treatment-naive ATB (n = 24) were stimulated with Mtb-CW antigens (A) and ESAT6-CFP10 peptides (B). The Mann-Whitney U test was used to compare the 2 groups. Bars represent medians. P < 0.05 was considered statistically significant.
Figure 1
Figure 1. CONSORT flow diagram.
Enrollment, follow-up, and analysis in the Georgia test cohort.

Similar articles

Cited by

References

    1. Parrish NM, Carroll KC. Role of the clinical mycobacteriology laboratory in diagnosis and management of tuberculosis in low-prevalence settings. J Clin Microbiol. 2011;49(3):772–776. doi: 10.1128/JCM.02451-10. - DOI - PMC - PubMed
    1. Davies PD, Pai M. The diagnosis and misdiagnosis of tuberculosis. Int J Tuberc Lung Dis. 2008;12(11):1226–1234. - PubMed
    1. Nyendak MR, Lewinsohn DA, Lewinsohn DM. New diagnostic methods for tuberculosis. Curr Opin Infect Dis. 2009;22(2):174–182. doi: 10.1097/QCO.0b013e3283262fe9. - DOI - PMC - PubMed
    1. Thillai M, Pollock K, Pareek M, Lalvani A. Interferon-gamma release assays for tuberculosis: current and future applications. Expert Rev Respir Med. 2014;8(1):67–78. doi: 10.1586/17476348.2014.852471. - DOI - PubMed
    1. Meier T, Eulenbruch HP, Wrighton-Smith P, Enders G, Regnath T. Sensitivity of a new commercial enzyme-linked immunospot assay (T SPOT-TB) for diagnosis of tuberculosis in clinical practice. Eur J Clin Microbiol Infect Dis. 2005;24(8):529–536. doi: 10.1007/s10096-005-1377-8. - DOI - PubMed

Publication types

MeSH terms