. 2015 May;125(5):1873-85.
doi: 10.1172/JCI79300. Epub 2015 Mar 30.

Parkin cooperates with GDNF/RET signaling to prevent dopaminergic neuron degeneration

Parkin cooperates with GDNF/RET signaling to prevent dopaminergic neuron degeneration

Durga Praveen Meka et al. J Clin Invest. 2015 May.

Abstract

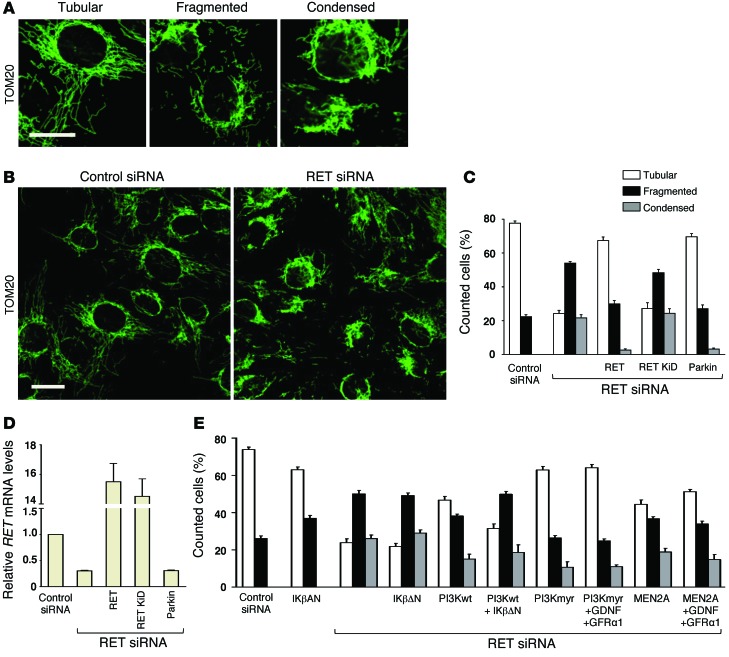
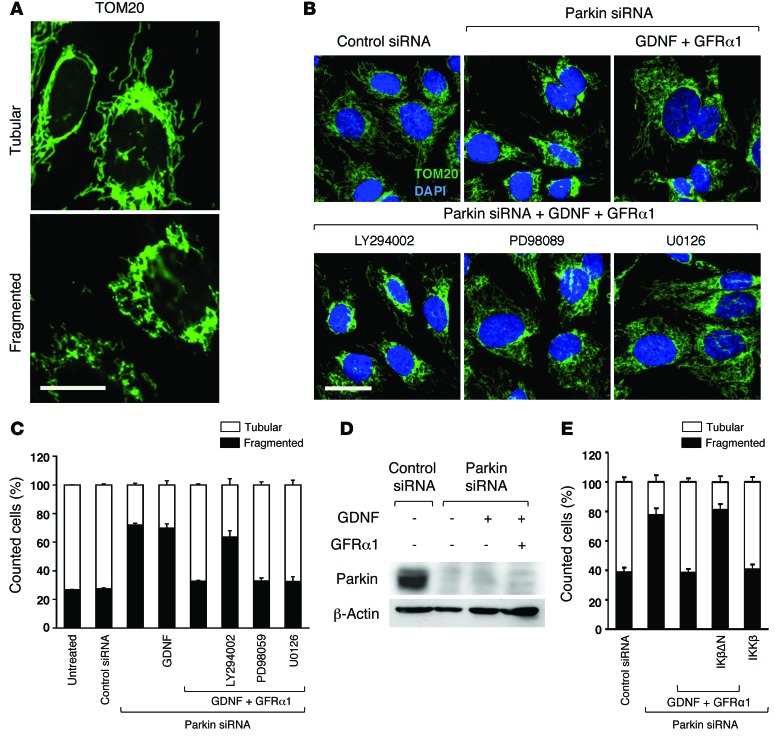
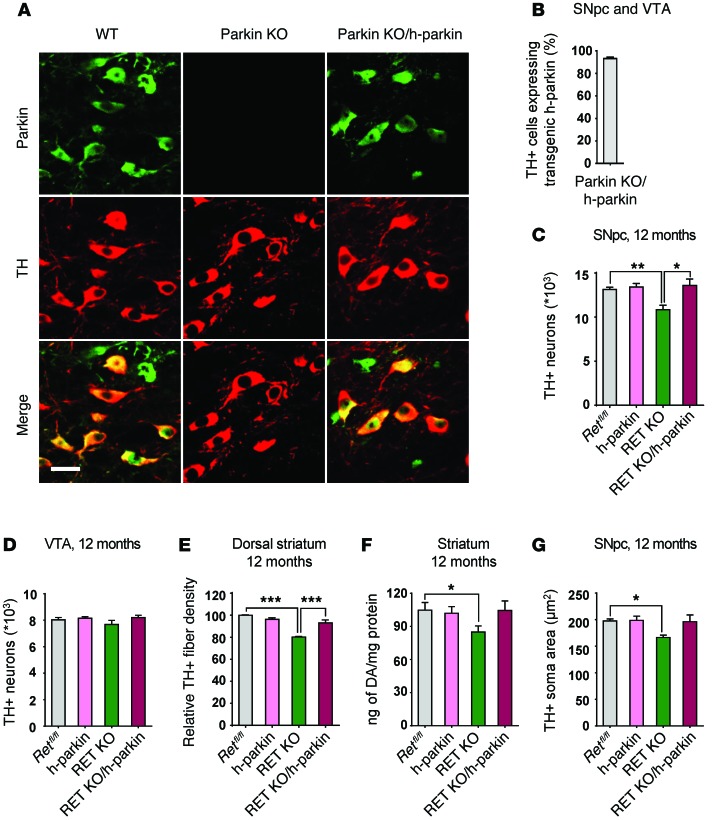
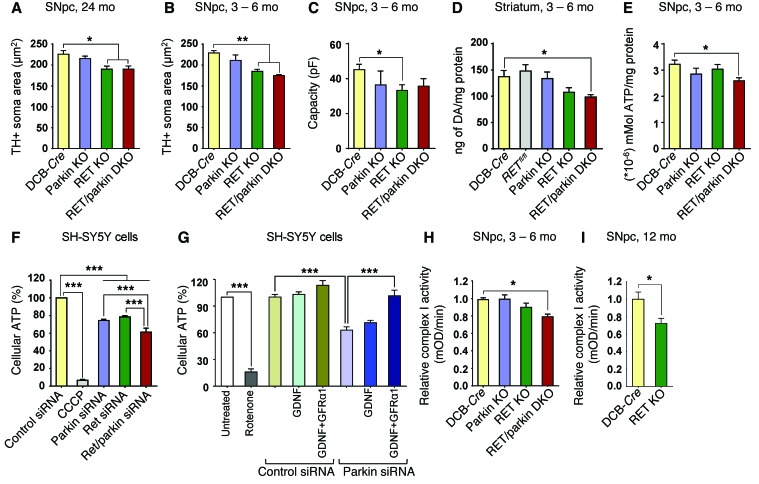
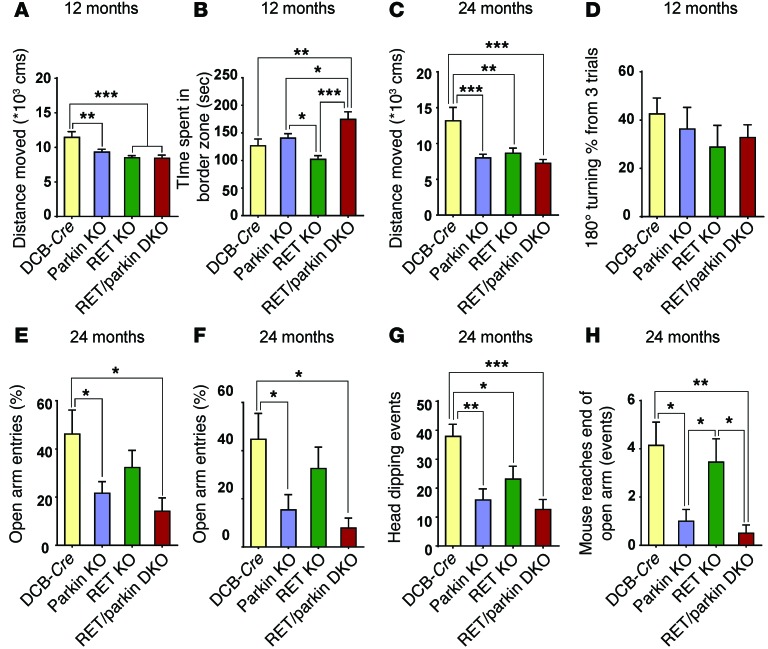
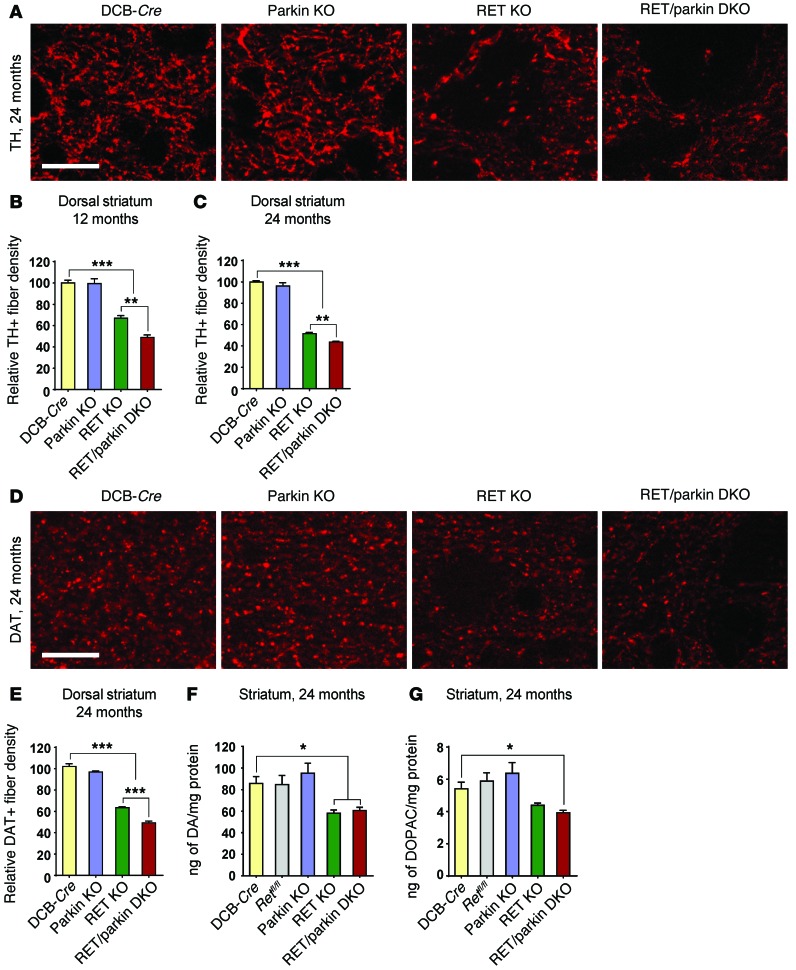
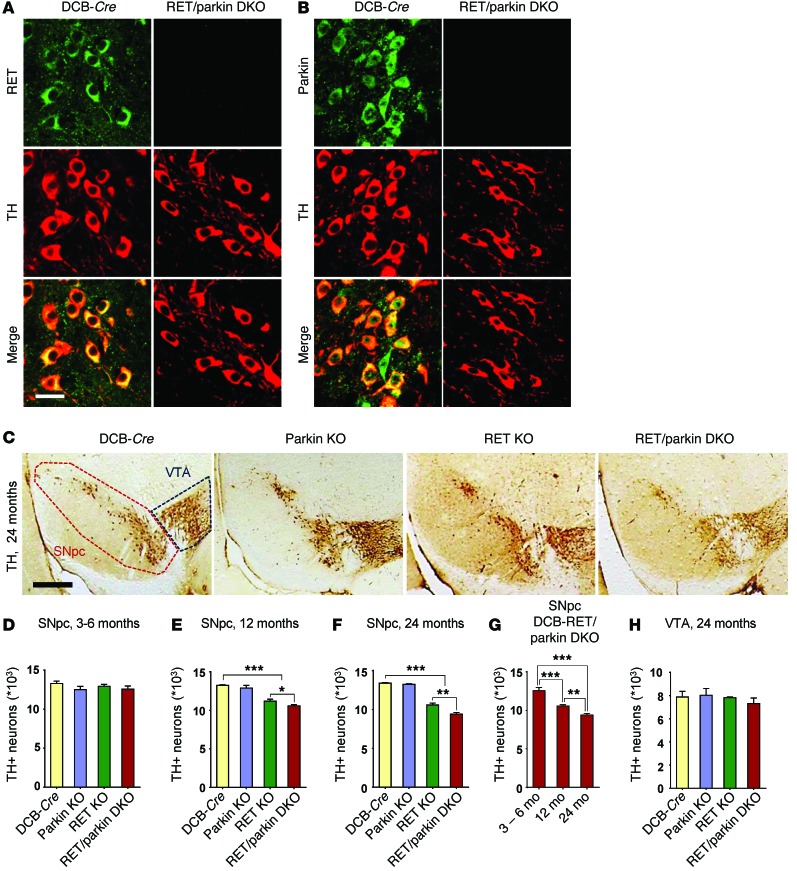
Parkin and the glial cell line-derived neurotrophic factor (GDNF) receptor RET have both been independently linked to the dopaminergic neuron degeneration that underlies Parkinson's disease (PD). In the present study, we demonstrate that there is genetic crosstalk between parkin and the receptor tyrosine kinase RET in two different mouse models of PD. Mice lacking both parkin and RET exhibited accelerated dopaminergic cell and axonal loss compared with parkin-deficient animals, which showed none, and RET-deficient mice, in which we found moderate degeneration. Transgenic expression of parkin protected the dopaminergic systems of aged RET-deficient mice. Downregulation of either parkin or RET in neuronal cells impaired mitochondrial function and morphology. Parkin expression restored mitochondrial function in GDNF/RET-deficient cells, while GDNF stimulation rescued mitochondrial defects in parkin-deficient cells. In both cases, improved mitochondrial function was the result of activation of the prosurvival NF-κB pathway, which was mediated by RET through the phosphoinositide-3-kinase (PI3K) pathway. Taken together, these observations indicate that parkin and the RET signaling cascade converge to control mitochondrial integrity and thereby properly maintain substantia nigra pars compacta dopaminergic neurons and their innervation in the striatum. The demonstration of crosstalk between parkin and RET highlights the interplay in the protein network that is altered in PD and suggests potential therapeutic targets and strategies to treat PD.


Figures

Figure 7
Figure 7. RET knockdown in SH-SY5Y cells induces mitochondrial network alterations.
(A) Representative images of tubular (normal), fragmented (damaged), and condensed (damaged) mitochondria labeled with TOM20 antibody in SH-SY5Y cells (scale bar: 10 μm). (B) Representative images of TOM20-labeled mitochondria in cells transfected with control or RET siRNA (scale bar: 10 μm). (C) Quantification of cells with tubular, fragmented, or condensed mitochondria after transfection with control or RET siRNA. Some cells were additionally transfected with wild-type RET, kinase-dead RET (RET KiD), or parkin constructs. (D) Relative RET mRNA levels quantified by RT-PCR in the cell samples analyzed in C. (E) Quantification of tubular, fragmented, or condensed mitochondria in cells treated with RET siRNA and/or overexpressing IKβΔN, PI3Kwt, constitutive active PI3Kmyr, or MEN2A in the presence or absence of GDNF and GFRα1 in the culture medium. Data are represented as mean ± SEM; n = 3 experiments. Newman-Keuls multiple-comparison test, performed after 2-way ANOVA analysis, was performed for the data in C and E (see Supplemental Tables 3 and 4).
Figure 6
Figure 6. Mitochondrial fragmentation in parkin knockdown SH-SY5Y cells can be prevented by GDNF and GFRα1.
(A) Representative images of tubular (normal) and fragmented (damaged) mitochondria in cells immunofluorescently labeled with TOM20 antibody (scale bar: 10 μm). (B) Representative images of TOM20-stained mitochondria (green) and DAPI-stained nuclei (blue) in cells after transfection with control or parkin siRNA and additional treatment with GDNF and GFRα1 and the inhibitors LY294002, PD98059, or U0126 as indicated (scale bar: 10 μm). (C) Quantification of cells with tubular or fragmented mitochondria from B. (D) Western blot showing the efficient knockdown of parkin protein in cells after parkin siRNA transfection, independent of further treatment with or without GDNF and GFRα1; β-actin is shown as a loading control. (E) Quantification of cells with tubular or fragmented mitochondria from Supplemental Figure 8A treated with parkin or control siRNA. Some cells were additionally stimulated with GDNF and GFRα1 and transfected with IKβΔN (dominant-negative NF-κB signaling inhibitor) or IKKβ (NF-κB activator) constructs. Data are represented as mean ± SEM; n = 3 experiments.
Figure 5
Figure 5. Transgenic parkin prevents neurodegeneration in RET KO mice.
(A) Expression of human parkin (h-parkin) in DA (TH+) neurons of the SNpc in transgenic mice crossed with parkin KO mice. Wild-type and transgenic mice but not parkin KO mice show parkin expression (scale bar: 25 μm). (B) Cell counting revealed that 93% of TH-positive cells express human parkin in the SNpc and VTA region (n = 3, 150–200 cells counted per mouse). (C and D) Stereological quantification of TH-positive neurons in (C) SNpc and (D) VTA of 12-month-old mice of the indicated genotypes (n = 3–4). (E) TH fiber density in dorsal striatum of 12-month-old mice of the indicated genotypes (n = 3–5). (F) Striatal HPLC measurements of total dopamine levels in 12-month-old mice (n = 4–7). (G) Cell soma area measurements of SNpc TH-positive neurons in 12-month-old mice (n = 3). Data are represented as mean ± SEM. *P ≤ 0.05, **P ≤ 0.01, ***P ≤ 0.001, 1-way ANOVA, Newman-Keuls post-hoc test for CE; *P ≤ 0.05, unpaired 2-tailed t test for F and G.
Figure 4
Figure 4. Cellular changes in the RET/parkin DKO mice.
(A and B) Cell soma area measurements of SNpc TH-positive neurons in (A) 24-month-old and (B) 3- to 6-month-old mice (n = 3). (C) Membrane capacitance of GFP-positive neurons from n = 5–7 cells per genotype were measured. (D) HPLC measurements of total striatal dopamine levels in 3- to 6-month-old mice (n = 5-7). (E) Measurements of total cellular ATP levels in the SNpc of 3- to 6-month-old mice (n = 5). (F) Measurements of cellular ATP levels in the SH-SY5Y cells after treatment with parkin and RET siRNA or dissipation of the mitochondrial membrane potential by the uncoupler carbonyl cyanide m‑chlorophenylhydrazone (CCCP) (n = 4 experiments). (G) Measurements of ATP levels in the SH-SY5Y cells treated with parkin siRNA and/or with GDNF and GFRα1 (n = 3 experiments). Rotenone, which interferes with electron transport chain, was used as positive control. (H) Mitochondrial complex I activity measurements in the SNpc of 3- to 6-month-old mice (n = 6–9). (I) Mitochondrial complex I activity measurements in the SNpc of 24-month-old mice (n = 5). Data are represented as mean ± SEM. *P ≤ 0.05, **P ≤ 0.01, ***P ≤ 0.001, 1-way ANOVA, Newman-Keuls post-hoc test for A, B, D, and FH; *P ≤ 0.05, 1-way ANOVA, unpaired 2-tailed t test for C, E, and I.
Figure 3
Figure 3. Aged parkin- and RET-deficient mice exhibit behavioral alterations.
(AC) Open-field test for measuring horizontal activity and anxiety in aged mice is shown. Distance moved (in cm) during a 10-minute duration in (A) 12-month-old (n = 11–24) and (C) 24-month-old (n = 6–17) mice of the indicated genotypes is shown. (B) Thigmotactic behavior was measured by analyzing the time (in seconds) spent by each mouse in the border zone of the arena during the first 5 minutes of a 10-minute trial of 12-month-old mice (n = 11–24) of the indicated genotypes. (D) Quantification showing 180° turning behavior (%) from 3 trials of a pole test in 12-month-old mice (n = 5–13). (EH) Quantification of anxiety behavior from 24-month-old mice during 5 minutes on an elevated plus maze of the indicated genotypes (n = 7–11). (E) Open arm entries, (F) open arm duration, (G) head dipping events, and (H) number of times mouse reaches the end of an open arm are shown. Data are represented as mean ± SEM. *P ≤ 0.05, **P ≤ 0.01, ***P ≤ 0.001, 1-way ANOVA, Newman-Keuls post-hoc test.
Figure 2
Figure 2. RET and parkin maintain DA innervation of the striatum.
(A) Representative images of coronal sections with immunofluorescent staining of TH fibers in the dorsal striatum of 24-month-old mice of the indicated genotypes (scale bar: 10 μm). (B and C) Quantification of TH fiber density in dorsal striatum of (B) 12-month-old mice (n = 4) and (C) 24-month-old mice (n = 3–4). (D) Representative images of coronal sections with fluorescent DAT staining of DA fibers in the dorsal striatum of 24-month-old mice of the indicated genotypes (scale bar: 10 μm). (E) Quantification of DAT fiber density in the dorsal striatum of 24-month-old mice (n = 3–4). (F and G) Striatal measurements of (F) total dopamine and (G) total DOPAC levels in 24-month-old mice of the indicated genotypes (n = 4–7). Data are represented as mean ± SEM. **P ≤ 0.01, ***P ≤ 0.001, 1-way ANOVA, Newman-Keuls post-hoc test for B, C, and E; *P ≤ 0.05, unpaired 2-tailed t test for F and G.
Figure 1
Figure 1. Late-onset and SNpc-specific degeneration of DA neurons in mice lacking RET and parkin.
(A and B) Representative images of coronal sections from 3-month-old control DCB-Cre and RET/parkin DKO mice showing loss of (A) RET and (B) parkin expression in TH-stained DA neurons of the SNpc in the RET/parkin DKO mice (scale bar: 25 μm). (C) Representative images of coronal midbrain sections from 24-month-old mice with the indicated genotypes showing DA neurons in the SNpc and VTA stained with TH antibody (scale bar: 250 μm). (DH) Stereological quantification of TH-positive neurons in the SNpc of (D) 3- to 6-month-old (n = 3–5), (E) 12-month-old (n = 3–6), and (F) 24-month-old (n = 3–6) mice. (G) Progressive and age-dependent loss of SNpc DA neurons in RET/parkin DKO mice (n = 5–6) over time. Data were obtained from DF. (H) TH-positive neurons were not lost in the VTA region in any of the 24-month-old mice (n = 3–6). Data are represented as mean ± SEM. *P ≤ 0.05, **P ≤ 0.01, ***P ≤ 0.001, 1-way ANOVA, Newman-Keuls post-hoc test.

Similar articles

Cited by

References

    1. Dawson TM, Ko HS, Dawson VL. Genetic animal models of Parkinson’s disease. Neuron. 2010;66(5):646–661. doi: 10.1016/j.neuron.2010.04.034. - DOI - PMC - PubMed
    1. Martin I, Dawson VL, Dawson TM. Recent advances in the genetics of Parkinson’s disease. Annu Rev Genomics Hum Genet. 2011;12:301–325. doi: 10.1146/annurev-genom-082410-101440. - DOI - PMC - PubMed
    1. Sulzer D. Multiple hit hypotheses for dopamine neuron loss in Parkinson’s disease. Trends Neurosci. 2007;30(5):244–250. doi: 10.1016/j.tins.2007.03.009. - DOI - PubMed
    1. Kramer ER, et al. Absence of Ret signaling in mice causes progressive and late degeneration of the nigrostriatal system. PLoS Biol. 2007;5(3):e39. doi: 10.1371/journal.pbio.0050039. - DOI - PMC - PubMed
    1. Pascual A, Hidalgo-Figueroa M, Piruat JI, Pintado CO, Gomez-Diaz R, Lopez-Barneo J. Absolute requirement of GDNF for adult catecholaminergic neuron survival. Nat Neurosci. 2008;11(7):755–761. doi: 10.1038/nn.2136. - DOI - PubMed

Publication types

MeSH terms