. 2015 May;125(5):1801-14.
doi: 10.1172/JCI73743. Epub 2015 Mar 30.

MEL-18 loss mediates estrogen receptor-α downregulation and hormone independence

MEL-18 loss mediates estrogen receptor-α downregulation and hormone independence

Jeong-Yeon Lee et al. J Clin Invest. 2015 May.

Abstract

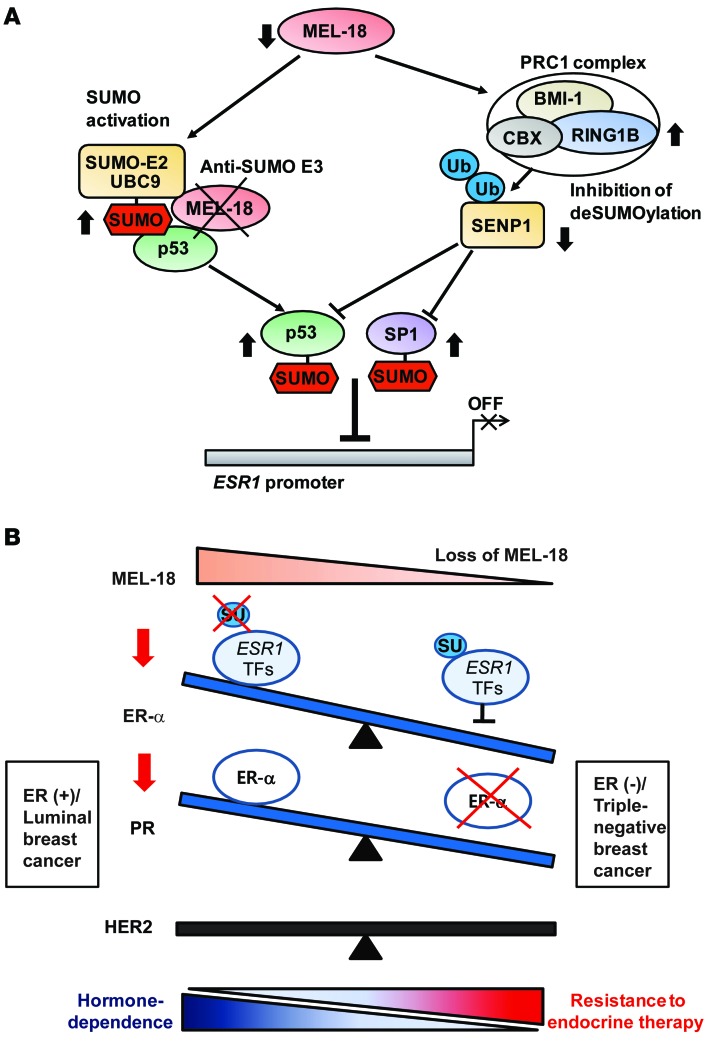
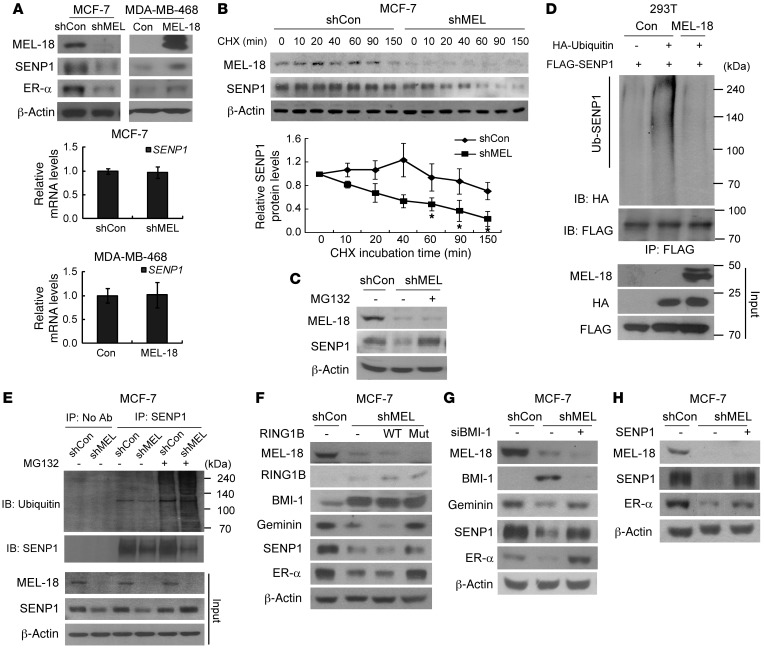
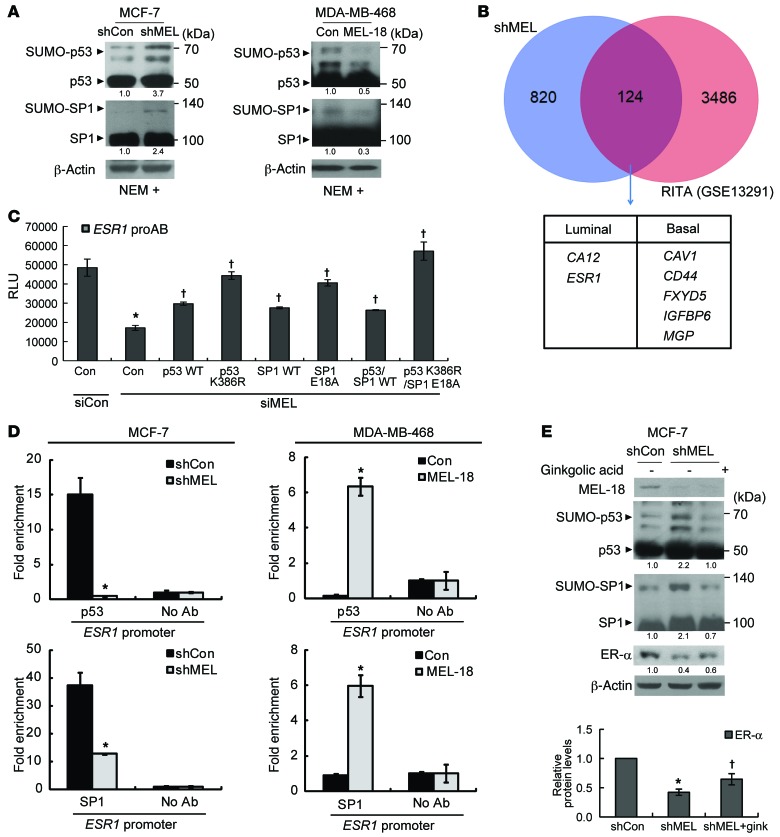
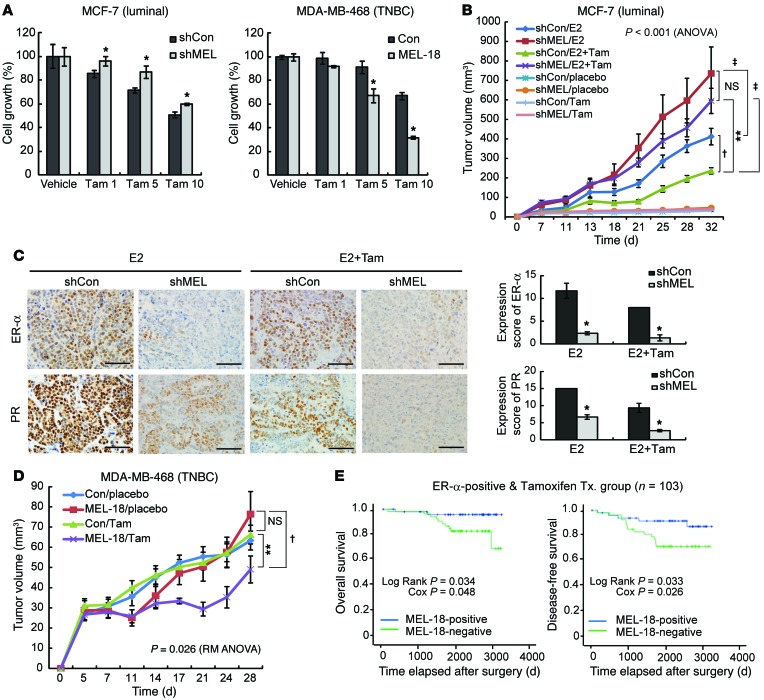
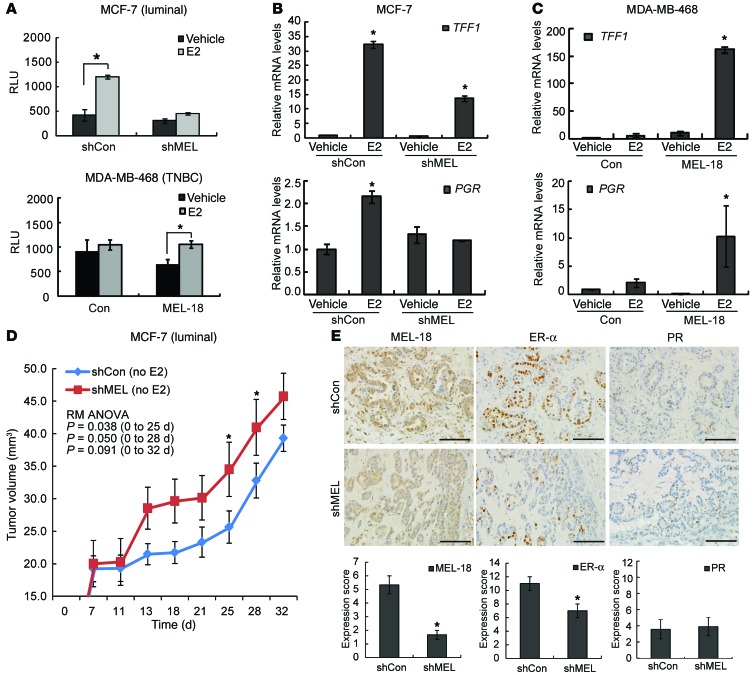
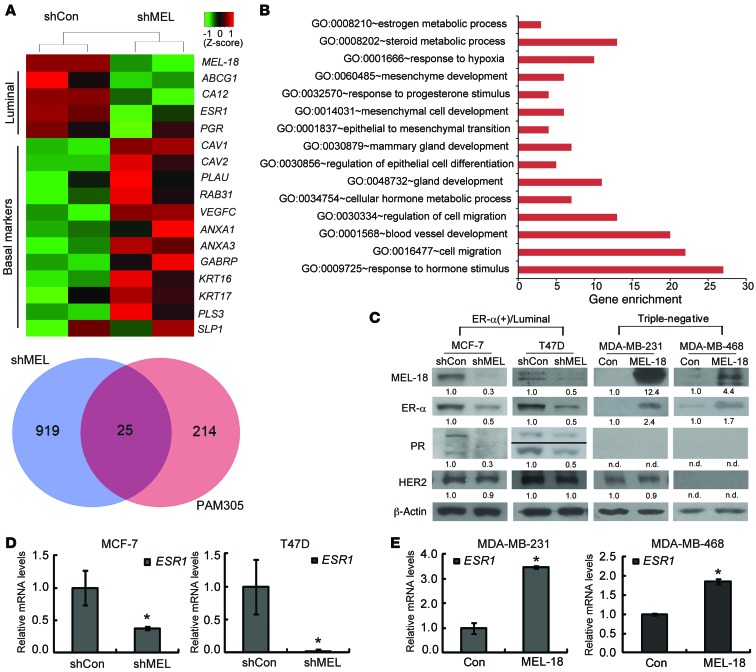
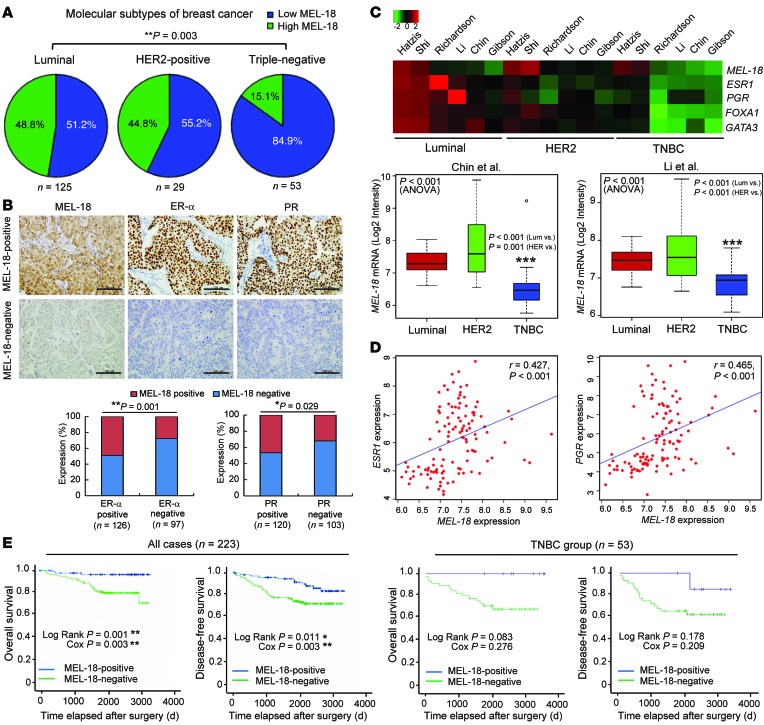
The polycomb protein MEL-18 has been proposed as a tumor suppressor in breast cancer; however, its functional relevance to the hormonal regulation of breast cancer remains unknown. Here, we demonstrated that MEL-18 loss contributes to the hormone-independent phenotype of breast cancer by modulating hormone receptor expression. In multiple breast cancer cohorts, MEL-18 was markedly downregulated in triple-negative breast cancer (TNBC). MEL-18 expression positively correlated with the expression of luminal markers, including estrogen receptor-α (ER-α, encoded by ESR1). MEL-18 loss was also associated with poor response to antihormonal therapy in ER-α-positive breast cancer. Furthermore, whereas MEL-18 loss in luminal breast cancer cells resulted in the downregulation of expression and activity of ER-α and the progesterone receptor (PR), MEL-18 overexpression restored ER-α expression in TNBC. Consistently, in vivo xenograft experiments demonstrated that MEL-18 loss induces estrogen-independent growth and tamoxifen resistance in luminal breast cancer, and that MEL-18 overexpression confers tamoxifen sensitivity in TNBC. MEL-18 suppressed SUMOylation of the ESR1 transactivators p53 and SP1, thereby driving ESR1 transcription. MEL-18 facilitated the deSUMOylation process by inhibiting BMI-1/RING1B-mediated ubiquitin-proteasomal degradation of SUMO1/sentrin-specific protease 1 (SENP1). These findings demonstrate that MEL-18 is a SUMO-dependent regulator of hormone receptors and suggest MEL-18 expression as a marker for determining the antihormonal therapy response in patients with breast cancer.


Figures

Figure 7
Figure 7. Proposed models for the regulation of hormone-dependent breast cancer by MEL-18.
(A) Schematic model of the regulation of SUMO-dependent ER-α transcription by MEL-18. The loss of MEL-18 enhances SUMO activation via direct binding between the SUMO E2 enzyme UBC9 and its substrate. Moreover, MEL-18 depletion inhibits the deSUMOylation activity of SENP1 by enhancing the BMI-1/RING1B E3 ubiquitin ligase complex–mediated ubiquitin-proteasomal degradation of SENP1. Via these two pathways, MEL-18 inhibits the SUMOylation of p53; alternatively, MEL-18 modulates SP1 SUMOylation via the SENP1-mediated deSUMOylation pathway. Increasing p53 and SP1 SUMOylation via MEL-18 silencing inhibits their recruitment to the ER-α promoter and downregulates ER-α expression. (B) Proposed model for the regulation of the balance between hormone dependence and independence by the polycomb protein MEL-18 in human breast cancer. In luminal breast cancer, MEL-18 contributes to the maintenance of the expression of the hormone receptors ER-α and PR but not HER2 by inhibiting the SUMOylation of ER-α transcription factors and by enhancing ER-α–dependent transcriptional activity, respectively. However, when MEL-18 expression is lost during breast cancer progression, the tumor develops hormone independence and resistance to antihormonal therapy, phenotypes of hormone receptor–negative breast cancers, including TNBC, which is characterized by the loss of ER-α and PR expression and the lack of HER2 amplification. Therefore, MEL-18 acts as a modulator of hormone receptor expression and a critical determinant of hormone dependence and independence in human breast cancer. SU, SUMOylation; TFs, transcription factors.
Figure 6
Figure 6. MEL-18 enhances the deSUMOylation of ESR1 transcription factors by inhibiting the ubiquitin-proteasomal degradation of SENP1.
(A) Analysis of SENP1 expression via immunoblotting and qRT-PCR. (B and C) Immunoblotting of the cell lysates from the control and MEL-18–silenced MCF-7 cells treated with 100 μg/ml CHX for the indicated periods (B) or with DMSO or 10 μM MG132 for 2 hours (C). The quantification of SENP1 protein stability is shown as a graph. The data in A and B are presented as the mean ± SD of triplicate measurements. *P < 0.05 vs. shCon (2-tailed Student’s t test). (D) In vivo SENP1 ubiquitination assay in 293T cells. (E) Endogenous SENP1 protein ubiquitination levels in the control and MEL-18–silenced MCF-7 cells treated with or without 40 μM MG132 for 6 hours. (FH) Immunoblotting of the indicated cell lines. Cells stably expressing WT RING1B or a catalytically inactive RING1B mutant (Mut) (F) or SENP1 (H) were generated from MEL-18–silenced MCF-7 cells. For BMI-1 knockdown, nontargeted or BMI-1 siRNA was transfected into MEL-18–silenced MCF-7 cells for 48 hours (G). Geminin protein, a known RING1B E3 ligase substrate, was used as a positive control for the measurement of RING1B activity. All data are representative of three independent experiments.
Figure 5
Figure 5. MEL-18 regulates ESR1 transcription by inhibiting the SUMOylation of the ESR1 transcription factors p53 and SP1.
(A) Cell lysates treated with 20 mM N-ethylmaleimide (NEM) were subjected to immunoblotting. The amount of SUMOylated protein was quantified by measuring the ratio of SUMOylated protein/total protein. (B) Venn diagram showing the relationship between the microarray results for MCF-7 cells expressing MEL-18 shRNA (shMEL) and those for MCF-7 cells treated with RITA (GSE13291) (36). (C) MCF-7 cells expressing MEL-18 siRNA (siMEL) were cotransfected with WT or SUMOylation-deficient mutant constructs of p53 or SP1 and with ESR1 pro-Luciferase and were subjected to a luciferase reporter assay. The data are presented as the mean ± SD (n = 3). *P < 0.05 vs. siCon/Con; P < 0.05 siMEL/Con (2-tailed Student’s t test). (D) ChIP-qPCR analysis showing the amount of ESR1 transcription factor that was recruited to the ESR1 promoter in the indicated cells. The data are presented as the mean ± SD (n = 3). *P < 0.05 vs. shCon (2-tailed Student’s t test). (E) The effect of ginkgolic acid on the expression of ER-α in the MEL-18–silenced cells. Cells were treated with 100 mM ginkgolic acid for 24 hours and subjected to immunoblotting. Parallel samples examined on separate gels are shown. The data were quantified by measuring the immunoblot band densities from three independent experiments (mean ± SD). *P < 0.05 vs. shCon; P < 0.05 vs. shMEL (2-tailed Student’s t test). All data shown are representative of three independent experiments.
Figure 4
Figure 4. The loss of MEL-18 induces resistance to antiestrogen therapy.
(A) Cell viabilities following treatment with the indicated doses (μM) of tamoxifen (Tam) or ethanol (vehicle) for 5 days were analyzed via the MTT assay. The data are presented as mean ± SD (n = 3). (B) NOD/SCID mice injected with control or MEL-18–silenced cells following implantation with or without E2 pellets were administered Tam for 4 weeks (n = 8 per group; mean ± SEM). P values for multiple comparisons (4 groups: shCon/E2, shMEL/E2, shCon/E2+Tam, and shMEL/E2+Tam) were calculated via Welch ANOVA followed by Dunnett’s T3 test. **P = 0.004 vs. shCon/E2+Tam; P = 0.019 vs. shCon/E2; P = NS vs. shMEL/E2; P < 0.001 (shCon/E2+Tam vs. shMEL/E2+Tam) and P = 0.043 (shCon/E2 vs. shMEL/E2) based on RM ANOVA. (C) IHC for ER-α and PR in the xenografted tumors from the indicated groups of mice (mean ± SEM of 3 mice). *P < 0.05 vs. shCon (2-tailed Student’s t test). Scale bars: 100 μm. (D) Tumor growth curves for NOD/SCID mice implanted with control or MEL-18–overexpressing MDA-MB-468 cells treated with Tam (5 mg/ pellet) or placebo (n = 8 per group; mean ± SEM). P < 0.001 (days), P = 0.026 (group × days) based on RM ANOVA. **P = 0.006 vs. Con/Tam; P = 0.026 vs. MEL-18/placebo (post hoc LSD test). (E) Analysis of OS and DFS according to MEL-18 expression in 103 Tam-treated ER-α–positive human breast tumors using the Kaplan-Meier method.
Figure 3
Figure 3. MEL-18 depletion abrogates ER-α–dependent transcriptional activity and induces estrogen-independent tumor growth.
(AC) ERE luciferase assay (A) and qRT-PCR analysis of TFF1 (also known as pS2) and PR (PGR) expression levels (B and C) in the control and MEL-18–silenced or MEL-18–overexpressing cell lines in the presence or absence of E2 (10 nM in MCF-7 cells or 20 nM in MDA-MB-468 cells) for 24 hours. The error bars represent the mean ± SD of triplicate experiments. *P < 0.05 compared with the control (2-tailed Student’s t test). (D) The effect of MEL-18 knockdown on E2-independent breast tumor growth. Control or shMEL MCF-7 cells were transplanted into the mammary fat pads of NOD/SCID mice (n = 8) in the absence of E2 treatment. Tumor size was monitored to assess mouse xenograft tumor growth. *P < 0.05 (group × days) based on RM ANOVA from day 0 to the indicated days. P < 0.001 (days; RM ANOVA). (E) IHC for MEL-18, ER-α, and PR in the indicated samples from three independent xenografted mice. Scale bars: 100 μm. The data in D and E are presented as the mean ± SEM (n = 8 and n = 3, respectively, independent experiments). *P < 0.05 vs. shCon (2-tailed Student’s t test).
Figure 2
Figure 2. MEL-18 positively regulates ESR1 and PR expression.
(A) Heatmap generated from the microarray analysis of MCF-7 cells expressing either control (shCon) or MEL-18 shRNA (shMEL) showing the differential expression of the luminal and basal markers between the two groups. The Venn diagram shows the number of common genes between the MEL-18 target genes and the PAM305 gene list. (B) The MEL-18 target genes obtained from the microarray analysis were categorized according to gene function via GO enrichment analysis. (C) The MEL-18–silenced (shMEL) or MEL-18–overexpressing (MEL-18) breast cancer cells and control cells (shCon and Con) were cultured in DMEM containing 10% FBS for 48 hours, and the cell lysates were subjected to immunoblotting using the indicated antibodies. To detect ER-α protein expression in TNBC cells, more than 100 μg of lysate was used for immunoblotting. The relative immunoblot band densities are indicated at the bottom of each blot. n.d., not detected. A black line within the blot indicates that the bands were spliced from the equal lane in the same gel because of the expression of isoforms of PR at different molecular weights (lower, PR-A, 81 kDa; upper, PR-B, 116 kDa). The data are representative of three independent experiments. (D and E) The mRNA levels of ER-α (ESR1) in the indicated stable cell lines were validated via qRT-PCR. The data represent the mean ± SD of triplicate measurements. *P < 0.05 vs. the controls (shCon or Con) based on 2-tailed Student’s t test.
Figure 1
Figure 1. Loss of MEL-18 is associated with poor prognosis and TNBC.
(A) The percentage of MEL-18 negativity and positivity in different breast cancer subtypes is shown as pie charts. **P < 0.01 (Fisher’s exact test). (B) Representative IHC images and bar graphs showing the correlation between MEL-18 expression and ER-α and PR expression in 223 breast tumor samples. Scale bars: 100 μm. *P < 0.05, **P < 0.01 (Fisher’s exact test). (C) Heatmap (top) and box plots (bottom) of MEL-18 mRNA levels in different breast cancer subtypes in the published microarray datasets from the indicated breast cancer cohorts (defined in Table 1). The bottom and top of the boxes correspond to the first and third quartiles; the bands inside the boxes represent the 50th percentile (median); the whiskers represent the lowest and highest values within 1.5-fold of the interquartile range (IQR) of the lower and upper quartiles; and the outliers are all values beyond the whiskers. P values were calculated via ANOVA with pairwise comparisons. ***P < 0.001 vs. luminal breast cancer (Lum). (D) Scatter plots showing the correlation of MEL-18 expression with ESR1 and PGR expression in a GEO dataset (GSE19615) (22). The r value was calculated via Spearman’s rank correlation coefficient analysis. (E) OS and DFS according to MEL-18 expression among 223 human breast cancer and 53 TNBC cases. The data were analyzed using the Kaplan-Meier method with the log-rank test and Cox regression model. *P < 0.05, **P < 0.01.

Similar articles

Cited by

References

    1. Ali S, Coombes RC. Estrogen receptor alpha in human breast cancer: occurrence and significance. J Mammary Gland Biol Neoplasia. 2000;5(3):271–281. doi: 10.1023/A:1009594727358. - DOI - PubMed
    1. Giacinti L, Claudio PP, Lopez M, Giordano A. Epigenetic information and estrogen receptor alpha expression in breast cancer. Oncologist. 2006;11(1):1–8. doi: 10.1634/theoncologist.11-1-1. - DOI - PubMed
    1. Keen JC, et al. A novel histone deacetylase inhibitor, scriptaid, enhances expression of functional estrogen receptor alpha (ER) in ER negative human breast cancer cells in combination with 5-aza 2′-deoxycytidine. Breast Cancer Res Treat. 2003;81(3):177–186. doi: 10.1023/A:1026146524737. - DOI - PubMed
    1. Yang X, Phillips DL, Ferguson AT, Nelson WG, Herman JG, Davidson NE. Synergistic activation of functional estrogen receptor (ER)-α by DNA methyltransferase and histone deacetylase inhibition in human ER-α-negative breast cancer cells. Cancer Res. 2001;61(19):7025–7029. - PubMed
    1. Peddi PF, Ellis MJ, Ma C. Molecular basis of triple negative breast cancer and implications for therapy. Int J Breast Cancer. 2012;2012:217185. - PMC - PubMed

Publication types

MeSH terms

Substances