

Ex vivo analysis identifies effective HIV-1 latency-reversing drug combinations
- PMID: 25822022
- PMCID: PMC4463209
- DOI: 10.1172/JCI80142
Ex vivo analysis identifies effective HIV-1 latency-reversing drug combinations
Abstract
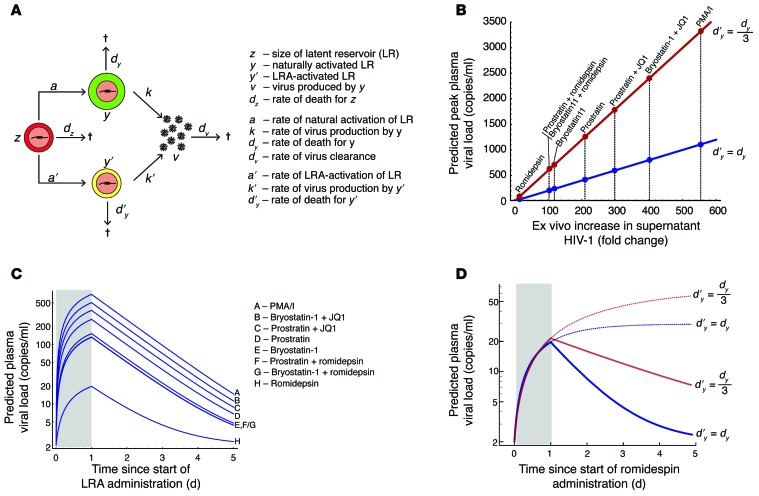
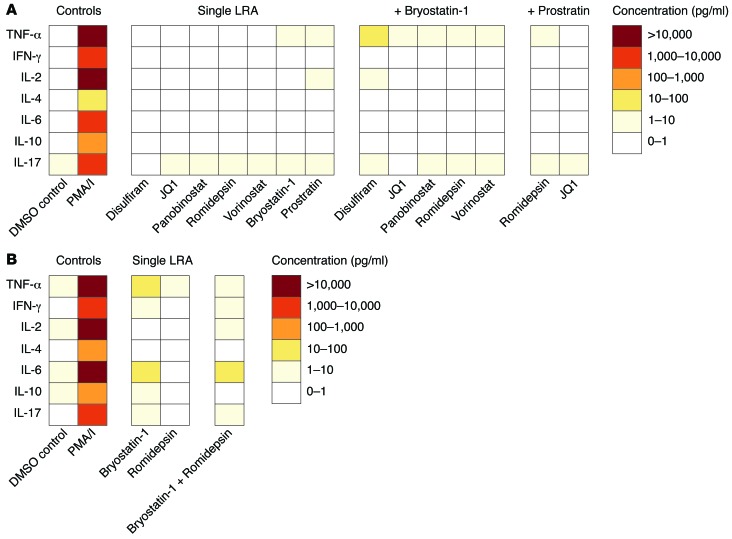
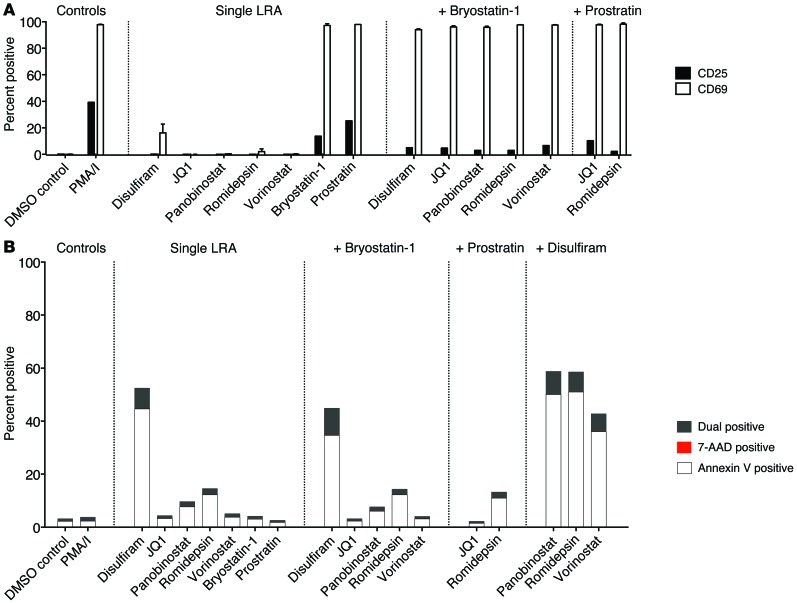
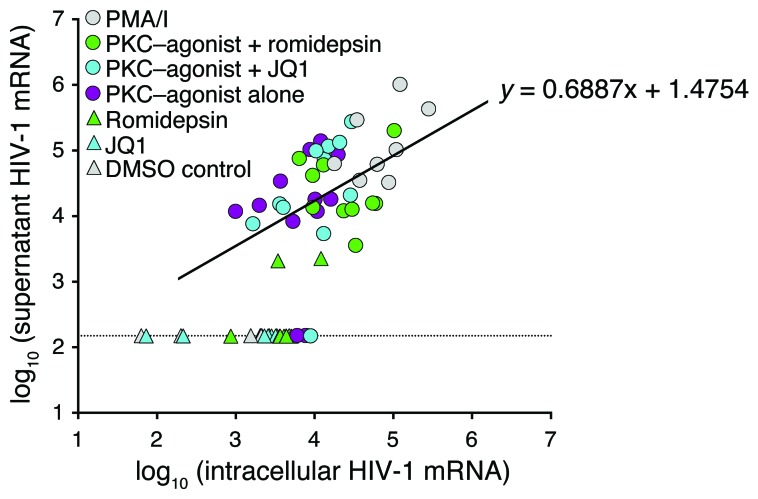
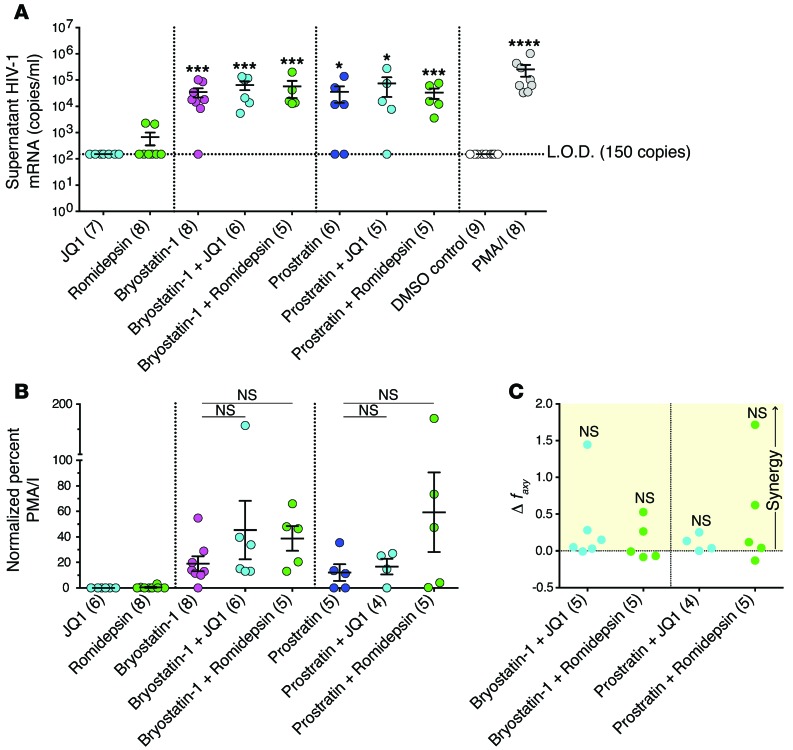
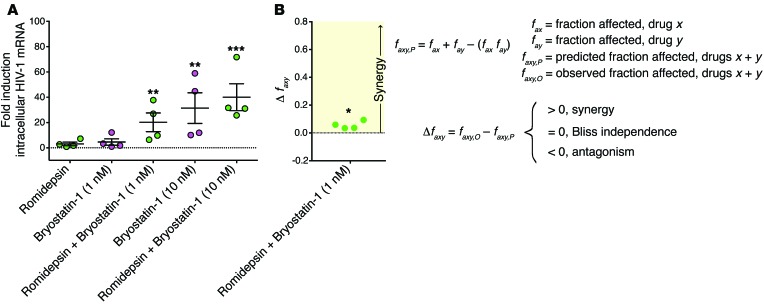
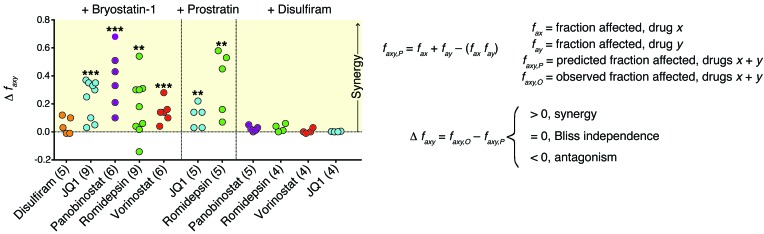
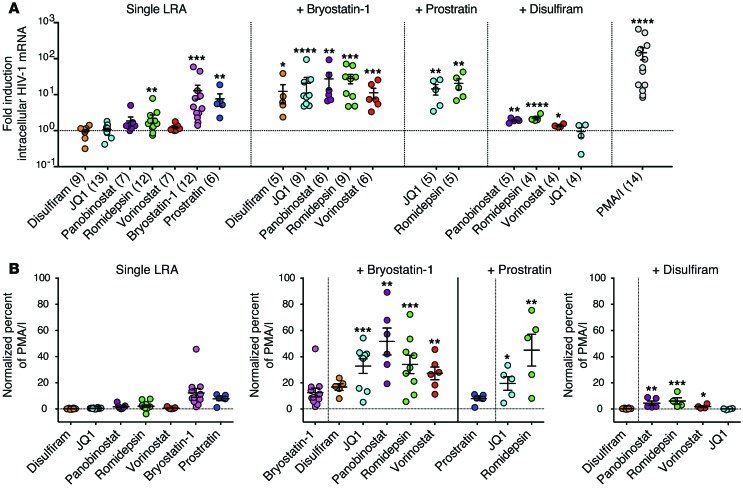
Reversal of HIV-1 latency by small molecules is a potential cure strategy. This approach will likely require effective drug combinations to achieve high levels of latency reversal. Using resting CD4+ T cells (rCD4s) from infected individuals, we developed an experimental and theoretical framework to identify effective latency-reversing agent (LRA) combinations. Utilizing ex vivo assays for intracellular HIV-1 mRNA and virion production, we compared 2-drug combinations of leading candidate LRAs and identified multiple combinations that effectively reverse latency. We showed that protein kinase C agonists in combination with bromodomain inhibitor JQ1 or histone deacetylase inhibitors robustly induce HIV-1 transcription and virus production when directly compared with maximum reactivation by T cell activation. Using the Bliss independence model to quantitate combined drug effects, we demonstrated that these combinations synergize to induce HIV-1 transcription. This robust latency reversal occurred without release of proinflammatory cytokines by rCD4s. To extend the clinical utility of our findings, we applied a mathematical model that estimates in vivo changes in plasma HIV-1 RNA from ex vivo measurements of virus production. Our study reconciles diverse findings from previous studies, establishes a quantitative experimental approach to evaluate combinatorial LRA efficacy, and presents a model to predict in vivo responses to LRAs.
Figures
Similar articles
-
New ex vivo approaches distinguish effective and ineffective single agents for reversing HIV-1 latency in vivo.Nat Med. 2014 Apr;20(4):425-9. doi: 10.1038/nm.3489. Epub 2014 Mar 23. Nat Med. 2014. PMID: 24658076 Free PMC article.
-
Ex Vivo Bioactivity and HIV-1 Latency Reversal by Ingenol Dibenzoate and Panobinostat in Resting CD4(+) T Cells from Aviremic Patients.Antimicrob Agents Chemother. 2015 Oct;59(10):5984-91. doi: 10.1128/AAC.01077-15. Epub 2015 Jul 13. Antimicrob Agents Chemother. 2015. PMID: 26169416 Free PMC article.
-
An In-Depth Comparison of Latency-Reversing Agent Combinations in Various In Vitro and Ex Vivo HIV-1 Latency Models Identified Bryostatin-1+JQ1 and Ingenol-B+JQ1 to Potently Reactivate Viral Gene Expression.PLoS Pathog. 2015 Jul 30;11(7):e1005063. doi: 10.1371/journal.ppat.1005063. eCollection 2015 Jul. PLoS Pathog. 2015. PMID: 26225566 Free PMC article.
-
Shocking HIV out of hiding: where are we with clinical trials of latency reversing agents?Curr Opin HIV AIDS. 2016 Jul;11(4):394-401. doi: 10.1097/COH.0000000000000279. Curr Opin HIV AIDS. 2016. PMID: 26974532 Review.
-
HIV latency reversal agents: A potential path for functional cure?Eur J Med Chem. 2021 Mar 5;213:113213. doi: 10.1016/j.ejmech.2021.113213. Epub 2021 Jan 23. Eur J Med Chem. 2021. PMID: 33540228 Review.
Cited by
-
Identification of celastrol as a novel HIV-1 latency reversal agent by an image-based screen.PLoS One. 2021 Apr 29;16(4):e0244771. doi: 10.1371/journal.pone.0244771. eCollection 2021. PLoS One. 2021. PMID: 33914760 Free PMC article.
-
Human Galectin-9 Is a Potent Mediator of HIV Transcription and Reactivation.PLoS Pathog. 2016 Jun 2;12(6):e1005677. doi: 10.1371/journal.ppat.1005677. eCollection 2016 Jun. PLoS Pathog. 2016. PMID: 27253379 Free PMC article.
-
Bryostatin-1 Decreases HIV-1 Infection and Viral Production in Human Primary Macrophages.J Virol. 2022 Feb 23;96(4):e0195321. doi: 10.1128/JVI.01953-21. Epub 2021 Dec 8. J Virol. 2022. PMID: 34878918 Free PMC article.
-
Harnessing CD8+ T Cells Under HIV Antiretroviral Therapy.Front Immunol. 2019 Feb 26;10:291. doi: 10.3389/fimmu.2019.00291. eCollection 2019. Front Immunol. 2019. PMID: 30863403 Free PMC article. Review.
-
Synthesis and evaluation of designed PKC modulators for enhanced cancer immunotherapy.Nat Commun. 2020 Apr 20;11(1):1879. doi: 10.1038/s41467-020-15742-7. Nat Commun. 2020. PMID: 32312992 Free PMC article.
References
Publication types
MeSH terms
Substances
Grants and funding
- T32 GM007309/GM/NIGMS NIH HHS/United States
- P30 AI094189/AI/NIAID NIH HHS/United States
- U19 AI096109/AI/NIAID NIH HHS/United States
- DP5 OD019851/OD/NIH HHS/United States
- F31AI116316/AI/NIAID NIH HHS/United States
- 1U19AI096109/AI/NIAID NIH HHS/United States
- Howard Hughes Medical Institute/United States
- DP5OD019851/OD/NIH HHS/United States
- F31 AI116316/AI/NIAID NIH HHS/United States
- U19 AI096113/AI/NIAID NIH HHS/United States
- T32 GM008752/GM/NIGMS NIH HHS/United States
- AI096113/AI/NIAID NIH HHS/United States
- R0143222/PHS HHS/United States
LinkOut - more resources
Full Text Sources
Other Literature Sources
Medical
Research Materials
