. 2015 May;125(5):1886-900.
doi: 10.1172/JCI79327. Epub 2015 Mar 30.

CCN1 induces hepatic ductular reaction through integrin αvβ₅-mediated activation of NF-κB

CCN1 induces hepatic ductular reaction through integrin αvβ₅-mediated activation of NF-κB

Ki-Hyun Kim et al. J Clin Invest. 2015 May.

Abstract

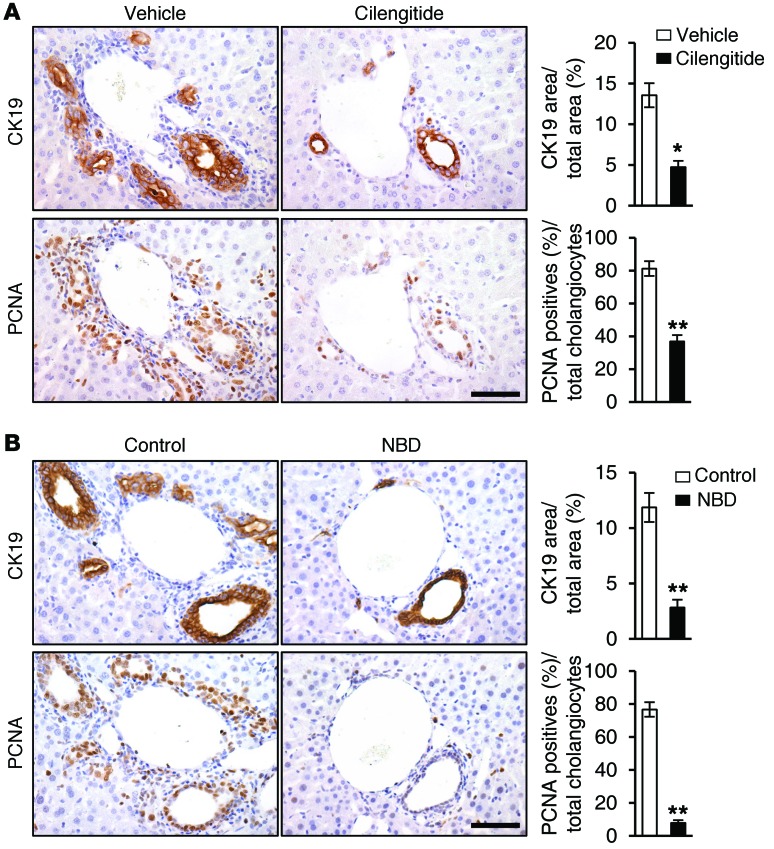
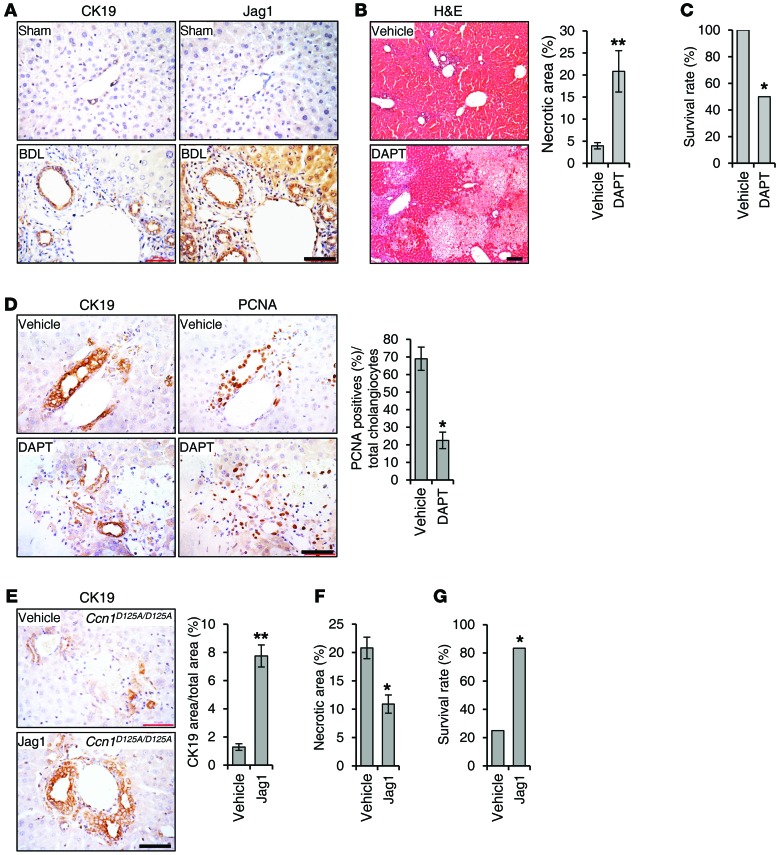
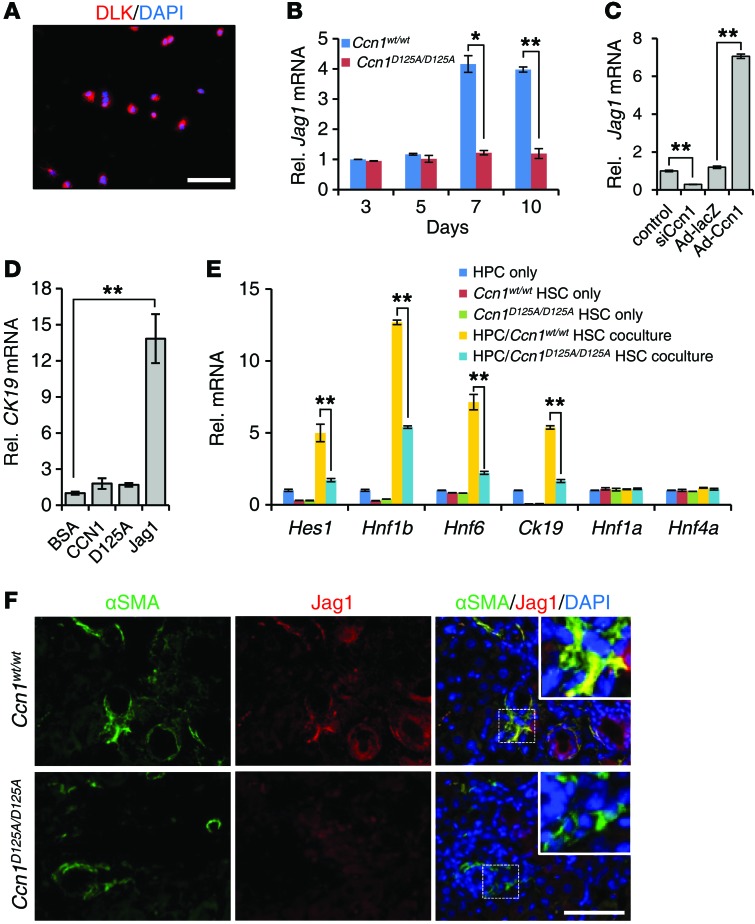
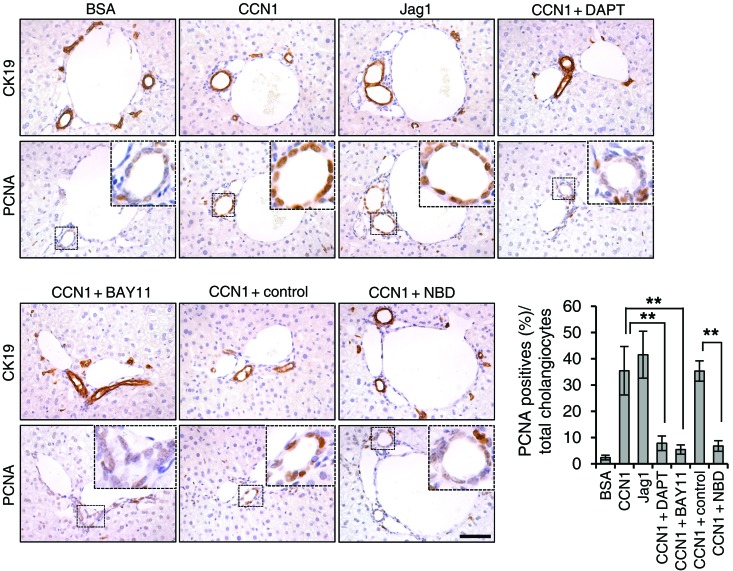
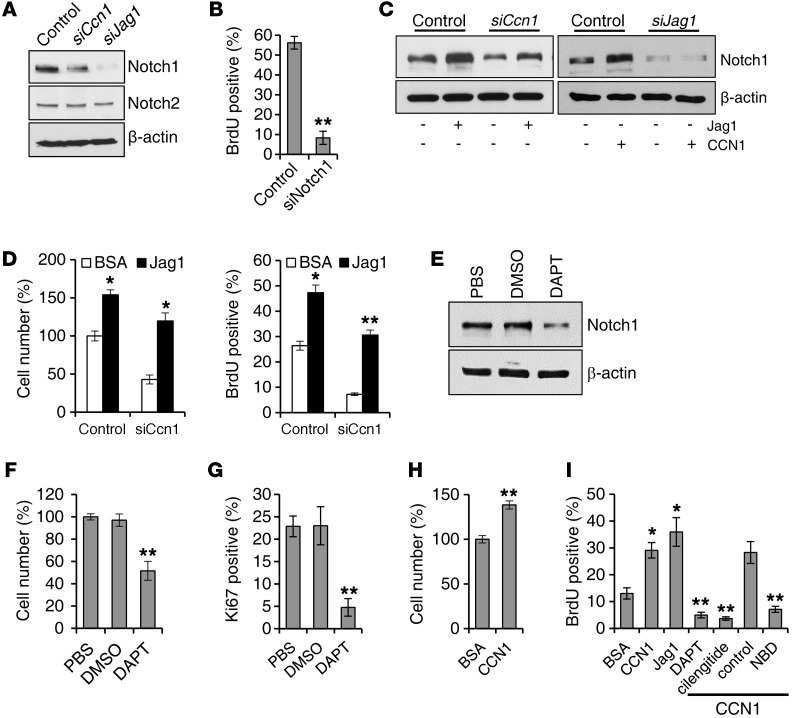
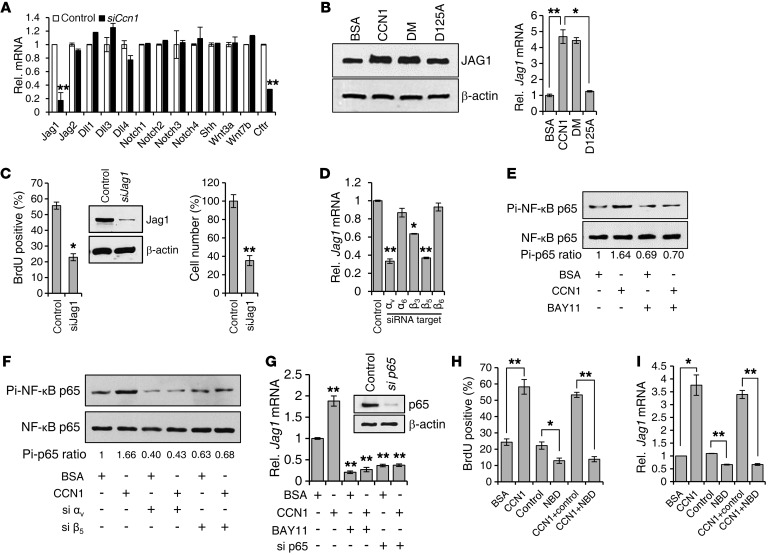
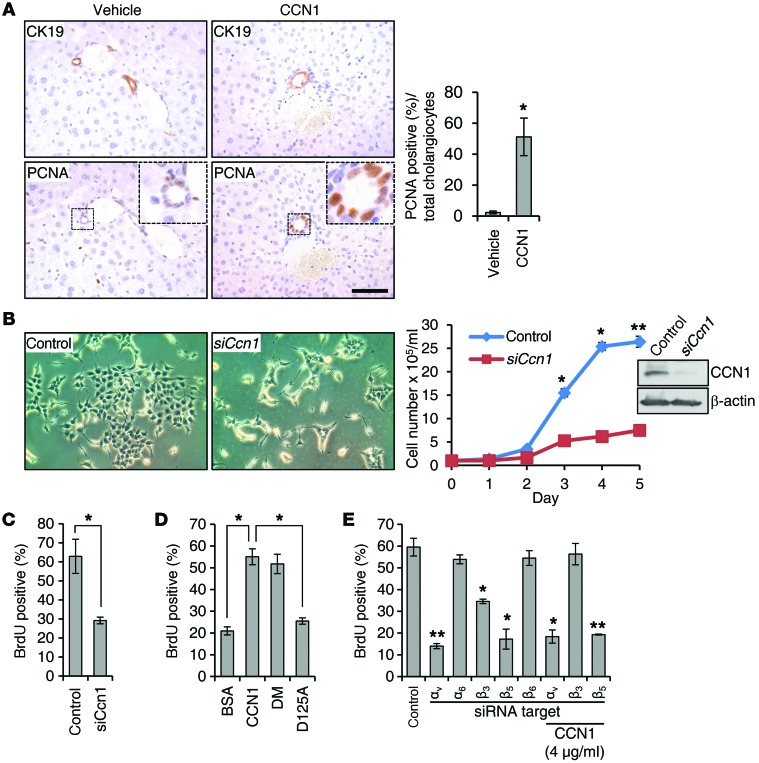
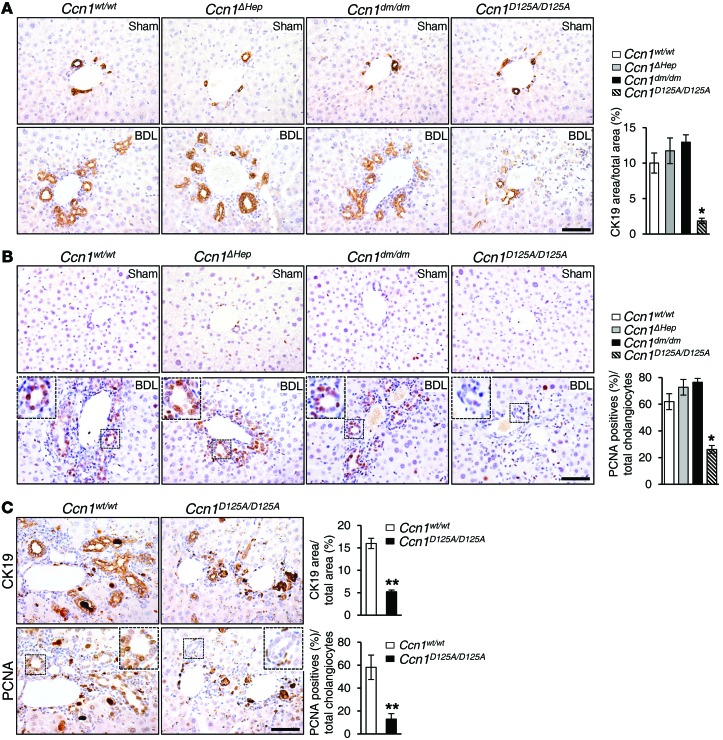
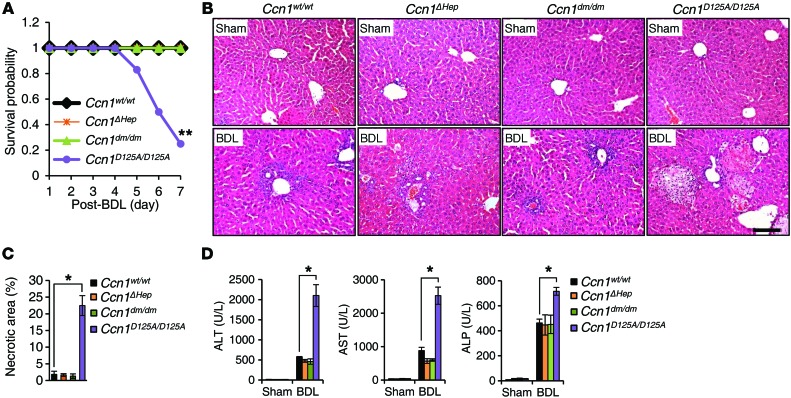
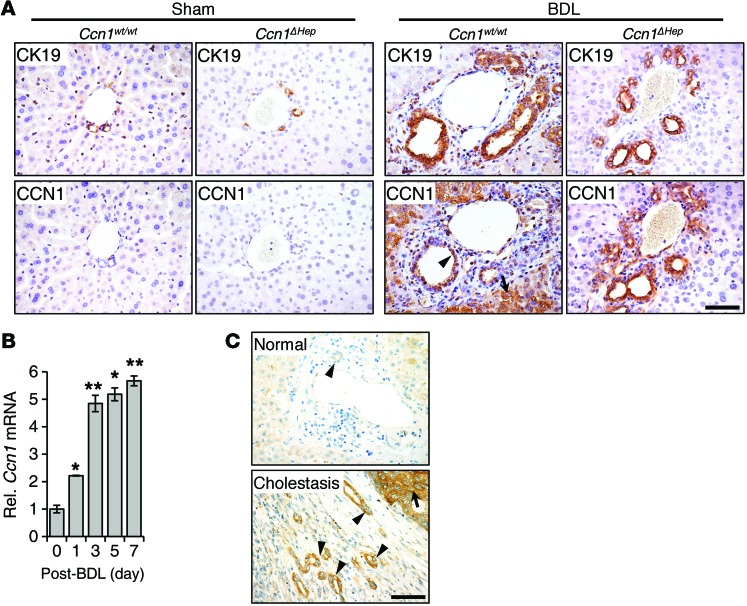
Liver cholestatic diseases, which stem from diverse etiologies, result in liver toxicity and fibrosis and may progress to cirrhosis and liver failure. We show that CCN1 (also known as CYR61), a matricellular protein that dampens and resolves liver fibrosis, also mediates cholangiocyte proliferation and ductular reaction, which are repair responses to cholestatic injury. In cholangiocytes, CCN1 activated NF-κB through integrin αvβ5/αvβ3, leading to Jag1 expression, JAG1/NOTCH signaling, and cholangiocyte proliferation. CCN1 also induced Jag1 expression in hepatic stellate cells, whereupon they interacted with hepatic progenitor cells to promote their differentiation into cholangiocytes. Administration of CCN1 protein or soluble JAG1 induced cholangiocyte proliferation in mice, which was blocked by inhibitors of NF-κB or NOTCH signaling. Knock-in mice expressing a CCN1 mutant that is unable to bind αvβ5/αvβ3 were impaired in ductular reaction, leading to massive hepatic necrosis and mortality after bile duct ligation (BDL), whereas treatment of these mice with soluble JAG1 rescued ductular reaction and reduced hepatic necrosis and mortality. Blockade of integrin αvβ5/αvβ3, NF-κB, or NOTCH signaling in WT mice also resulted in defective ductular reaction after BDL. These findings demonstrate that CCN1 induces cholangiocyte proliferation and ductular reaction and identify CCN1/αvβ5/NF-κB/JAG1 as a critical axis for biliary injury repair.


Figures

Figure 10
Figure 10. Blockade of integrins αvβ3 and αvβ5 and NF-κB abrogates ductular reaction.
(A) WT mice were subjected to BDL and treated with either vehicle or cilengitide (10 mg/kg) daily for 6 days; adjacent liver sections were immunostained for CK19 or PCNA. Data were quantified and expressed as mean ± SD. (n = 6 per group.) *P < 0.02, **P < 0.004, Student’s t test. (B) WT mice were subjected to BDL and injected with either NBD or control peptide (1 mg/kg each) daily for 6 days; adjacent liver sections were immunostained for CK19 or PCNA. Data were quantified and expressed as mean ± SD. (n = 6 per group.) **P < 0.004, Student’s t test. Scale bars: 50 μm.
Figure 9
Figure 9. JAG1/NOTCH signaling is critical for biliary ductal reaction.
(A) Adjacent sections of liver tissue from Ccn1wt/wt mice either sham operated or having undergone BDL were stained with antibodies recognizing CK19 or JAG1 and counterstained with hematoxylin. (B) Ccn1wt/wt mice were subjected to BDL and injected i.p. daily with DAPT (10 mg/kg/d) or vehicle for 6 days and sacrificed on day 7 (n = 6). Liver tissue sections were stained with H&E, and necrotic areas were quantified. **P < 0.007, Student’s t test. (C) Survival rate of these mice was recorded after 7 days. *P < 0.04, log-rank test. (D) Adjacent sections of liver tissue were stained with antibodies recognizing CK19 or PCNA and counterstained with hematoxylin. Percentages of PCNA-positive cholangiocytes were counted and data expressed as mean ± SD (n = 6, right). *P < 0.04, Student’s t test. (E) Ccn1D125A/D125A mice were subjected to BDL, and injected i.p. daily with soluble JAG1 (0.5 mg/kg) or vehicle for 6 days (n = 6). Liver tissue sections were immunostained for CK19 and counterstained with hematoxylin. Percentages of CK19-positive tissue areas were quantified by ImageJ. **P < 0.007, Student’s t test. (F) Necrotic areas were quantified. *P < 0.04, Student’s t test. (G) Survival rate was recorded. *P < 0.04, log-rank test. Scale bars: 50 μm.
Figure 8
Figure 8. Ccn1D125A/D125A HSCs are impaired in Jag1 expression and promotion of HPC differentiation to cholangiocytes.
(A) HPCs isolated from normal mouse livers were cultured overnight and stained with anti-DLK1 antibodies and counterstained with DAPI; 93.8% ± 1.27% of isolated cells stained positive for DLK1. (B) Jag1 expression was analyzed by qRT-PCR in HSCs at indicated days in culture after isolation from Ccn1wt/wt and Ccn1D125A/D125A mice. Data expressed as mean ± SD of triplicate determinations. *P < 0.02, **P < 0.005, Student’s t test. (C) HSCs from Ccn1wt/wt mice were transfected with siCcn1 or control RNA, or transduced with Ad-Ccn1 virus or Ad-LacZ virus as a control. Jag1 mRNA levels were analyzed by qRT-PCR after 3 days. Data expressed as mean ± SD of triplicate determinations. **P < 0.005, Student’s t test. (D) Expression of CK19 was measured by qRT-PCR in primary HPCs treated with BSA, WT CCN1, CCN1-D125A, or soluble JAG1 (4 μg/ml each). Data expressed as mean ± SD of triplicate determinations. **P < 0.005, Student’s t test. (E) Expression of cholangiocyte and hepatocyte marker genes was detected by qRT-PCR in 10-day cocultures of primary WT HPCs and HSCs isolated from Ccn1wt/wt and Ccn1D125A/D125A mice. Data expressed as mean ± SD of triplicate determinations. **P < 0.005, Student’s t test. (F) Liver sections from mice fed DDC diet for 6 weeks were double immunostained for α-smooth muscle actin (αSMA, green) and JAG1 (red) and counterstained with DAPI (n = 6). Scale bars: 50 μm.
Figure 7
Figure 7. CCN1 induces cholangiocyte proliferation through NF-κB and NOTCH signaling in vivo.
Adjacent liver sections of WT mice injected with CCN1 (1 mg/kg), soluble JAG1 (0.5 mg/kg), or BSA (1 mg/kg) by retro-orbital delivery were immunostained for CK19 or PCNA, and percentages of PCNA-positive cholangiocytes were quantified and expressed as mean ± SD. (n = 6 per group.) **P < 0.01, Student’s t test. Where indicated, DAPT (10 mg/kg), BAY11-7082 (5 mg/kg), NBD (1 mg/kg), or control peptide (1 mg/kg) was coinjected. Scale bar: 50 μm.
Figure 6
Figure 6. CCN1 promotes cholangiocyte proliferation through JAG1/NOTCH1 pathway.
(A) Protein lysates of LMCCs transfected with siRNAs targeting Ccn1 or Jag1 were analyzed for NICD of NOTCH1 and NOTCH2 by immunoblotting. (B) Proliferation of cholangiocytes transfected with siNotch1 was assessed by BrdU incorporation. **P < 0.01, Student’s t test. (C) NOTCH 1 NICD was detected by immunoblotting in cells treated with siCcn1, siJag1, or a nontargeting control and incubated with or without soluble JAG1 (2 μg/ml), CCN1 (4 μg/ml), or BSA for 2 days. (D) Proliferation of cells treated with siCcn1 or control siRNA and incubated with or without soluble JAG1 (2 μg/ml) was evaluated by cell numbers and BrdU incorporation. *P < 0.04, **P < 0.01, Student’s t test. (E) NOTCH1 NICD was detected by immunoblotting in cholangiocytes incubated with DAPT (10 μM) or vehicle (DMSO) for 24 hours. (F and G) Proliferation of cells was assessed by counting of cell numbers (F) and immunohistochemical detection of Ki67-positive cells (G). Percentages of Ki67-positive cells relative to total number of cells were counted in 5 randomly chosen high-power fields. **P < 0.01, Student’s t test. (H) Freshly isolated primary cholangiocytes (98.5% ± 0.4% IgG2a-positive) were cultured with BSA or CCN1 (4 μg/ml) for 2 days, and proliferation was assessed by cell numbers. **P < 0.01, Student’s t test. (I) BrdU incorporation was quantified in freshly isolated primary cholangiocytes treated with BSA (4 μg/ml), CCN1 (4 μg/ml), soluble JAG1 (2 μg/ml), DAPT (10 μM), cilengitide (1 μM), NBD (25 μM), or control peptide (25 μM). Where indicated, CCN1 (4 μg/ml) was added with other inhibitors. *P < 0.04, **P < 0.01, Student’s t test. All data are expressed as mean ± SD of triplicate determinations.
Figure 5
Figure 5. CCN1 promotes cholangiocyte proliferation through NF-κB–mediated Jag1 expression.
(A) Expression of indicated genes was assessed by qRT-PCR in LMCCs transfected with siCcn1 or control siRNA. **P < 0.004, Student’s t test. (B) JAG1 protein was detected by immunoblotting in lysates of LMCCs incubated with WT CCN1, CCN1-DM, CCN1-D125A, or BSA (4 μg/ml each) for 2 days, and Jag1 mRNA was quantified by qRT-PCR. *P < 0.02, **P < 0.004, Student’s t test. (C) BrdU incorporation and total cell numbers were assessed in cholangiocytes 2 days after transfection with siJag1 or control siRNA. Knockdown of JAG1 was confirmed by immunoblotting. *P < 0.02, **P < 0.004, Student’s t test. (D) Jag1 mRNA was measured by qRT-PCR in cells treated with siRNAs targeting indicated integrins. *P < 0.02, **P < 0.004, Student’s t test. (E) Phosphorylation of NF-κB p65 was detected by immunoblotting in cholangiocytes incubated with CCN1 for 3 hours with or without pretreatment (30 minutes) with BAY11-7082 (5 μM). Levels of phosphorylated p65 were normalized to total p65. Pi, phosphorylated. (F) LMCCs were treated with siRNA targeting indicated integrins before CCN1 treatment and assayed for phosphorylation of NF-κB p65 by immunoblotting. (G) Jag1 mRNA was measured by qRT-PCR in LMCCs treated with CCN1 for 3 hours, with or without preincubation with BAY11-7082, or in cells transfected with siRNA targeting NF-κB p65. Knockdown of p65 was confirmed by immunoblotting. **P < 0.004, Student’s t test. (H) BrdU incorporation was assessed in LMCCs treated with BSA (4 μg/ml), CCN1 (4 μg/ml), NBD (25 μM), or control peptide (25 μM). *P < 0.02, **P < 0.004, Student’s t test. (I) Jag1 mRNA expression was analyzed with cells treated as in H. *P < 0.02, **P < 0.004, Student’s t test. All data are expressed as mean ± SD of triplicate determinations.
Figure 4
Figure 4. CCN1 promotes cholangiocyte proliferation through integrins αvβ5 and αvβ3.
(A) Serial liver sections from normal WT mice injected with CCN1 (1 mg/kg) or vehicle daily via retro-orbital delivery were immunostained for CK19 or PCNA, and percentages of PCNA-positive cholangiocytes were quantified and expressed as mean ± SD. (n = 6 per group.) *P < 0.01, Student’s t test. (B) LMCCs were transfected with either CCN1-targeting siRNA or nontargeting control RNA. Micrographs show cells 3 days after siRNA transfection, and growth curve shows effects of siCcn1. Immunoblotting shows CCN1 knockdown by siCcn1. *P < 0.01, **P < 0.003, Student’s t test. (C) BrdU incorporation assay carried out on LMCCs 2 days after transfection of siRNA; percentages of BrdU-positive cells were counted in 5 high-power fields. *P < 0.01, Student’s t test. (D) Cells were treated overnight with purified recombinant WT CCN1, CCN1-DM, CCN1-D125A, or BSA (4 μg/ml each), and percentages of BrdU-positive cells were counted as above. *P < 0.01, Student’s t test. (E) BrdU incorporation assay was conducted in LMCCs transfected with control RNA or siRNAs targeting integrins αv, α6, β3, β5, and β6. Where indicated, CCN1 (4 μg/ml) was added 1 day after siRNA treatment. Knockdown of integrins was confirmed by qRT-PCR (Supplemental Figure 6). *P < 0.01, **P < 0.003, Student’s t test. Data in CE expressed as mean ± SD of triplicate determinations. Scale bar: 50 μm.
Figure 3
Figure 3. Blunted biliary ductal reaction in Ccn1D125A/D125A mice following BDL or DDC diet.
(A) Liver sections from either sham- or BDL-operated Ccn1wt/wt, Ccn1ΔHep, Ccn1dm/dm, and Ccn1D125A/D125A mice were stained with anti-CK19 antibodies, and the average percentage of CK19-positive area in each genotype was quantified and expressed as mean ± SD. (n = 6 per group.) *P < 0.001, Student’s t test. (B) Adjacent tissue sections from above were stained with anti-PCNA antibodies, and the percentage of PCNA-positive cholangiocytes for each genotype was quantified and expressed as mean ± SD. (n = 6 per group.) *P < 0.001, Student’s t test. (C) Serial sections of liver tissue from mice fed DDC diet for 6 weeks were immunostained for CK19 or PCNA (n = 6). **P < 0.0001, Student’s t test. Note that some of the brown-staining areas were due to protoporphyrin crystals resulting from the DDC diet. Scale bars: 50 μm.
Figure 2
Figure 2. Ccn1D125A/D125A mice suffer massive hepatic necrosis and mortality after BDL.
Ccn1wt/wt, Ccn1ΔHep, Ccn1dm/dm, and Ccn1D125A/D125A mice were subjected to sham operation or BDL and sacrificed 7 days later. (A) Survival curve after BDL (n = 12 each). **P < 0.001, log-rank test. (B) Liver sections were stained with H&E. (C) Percentages of necrotic area were determined by ImageJ software (n = 6 each). *P < 0.02, Student’s t test. (D) Serum levels of alanine aminotransferase (ALT), aspartate aminotransferase (AST), and alkaline phosphatase (ALP) were analyzed (n = 6 each). *P < 0.02, Student’s t test. Data represent means ± SD of the results determined in triplicate experiments. Scale bar: 100 μm.
Figure 1
Figure 1. CCN1 is highly elevated in cholangiocytes in human and murine cholestatic livers.
(A) Serial sections of liver from WT C57BL/6 and Ccn1ΔHep mice 7 days after sham operation or BDL were stained with antibodies against CK19 or CCN1 (brown), and counterstained with hematoxylin (blue). (B) Ccn1 mRNA in WT mouse liver at indicated days after BDL was measured by qRT-PCR (n = 3). Data expressed as mean ± SD. *P < 0.01, **P < 0.002, Student’s t test. (C) Representative images of immunohistochemical staining (brown) for CCN1 in normal and cholestatic human livers. Arrows point to hepatocytes, arrowheads to cholangiocytes. Scale bars: 50 μm.

Similar articles

Cited by

References

    1. Lazaridis KN, Strazzabosco M, LaRusso NF. The cholangiopathies: disorders of biliary epithelia. Gastroenterology. 2004;127(5):1565–1577. doi: 10.1053/j.gastro.2004.08.006. - DOI - PubMed
    1. Tabibian JH, Masyuk AI, Masyuk TV, O’Hara SP, LaRusso NF. Physiology of cholangiocytes. Compr Physiol. 2013;3(1):541–565. - PMC - PubMed
    1. Gouw AS, Clouston AD, Theise ND. Ductular reactions in human liver: diversity at the interface. Hepatology. 2011;54(5):1853–1863. doi: 10.1002/hep.24613. - DOI - PubMed
    1. Roskams TA, et al. Nomenclature of the finer branches of the biliary tree: canals, ductules, and ductular reactions in human livers. Hepatology. 2004;39(6):1739–1745. doi: 10.1002/hep.20130. - DOI - PubMed
    1. Park SM. The crucial role of cholangiocytes in cholangiopathies. Gut Liver. 2012;6(3):295–304. doi: 10.5009/gnl.2012.6.3.295. - DOI - PMC - PubMed

Publication types

MeSH terms