. 2015 May;47(5):469-78.
doi: 10.1038/ng.3258. Epub 2015 Mar 30.

Targeted disruption of DNMT1, DNMT3A and DNMT3B in human embryonic stem cells

Affiliations

Targeted disruption of DNMT1, DNMT3A and DNMT3B in human embryonic stem cells

Jing Liao et al. Nat Genet. 2015 May.

Abstract

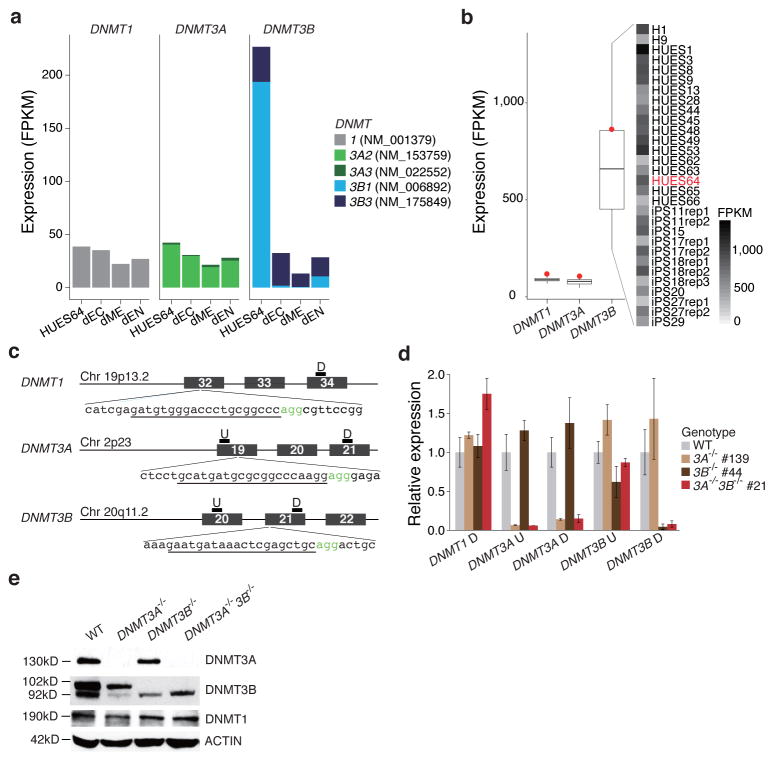
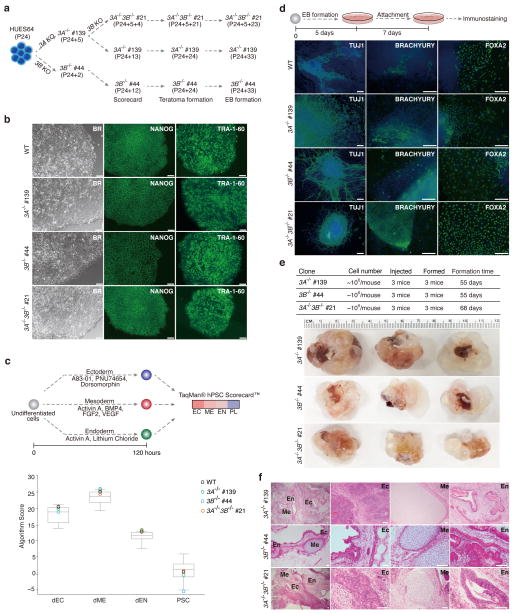
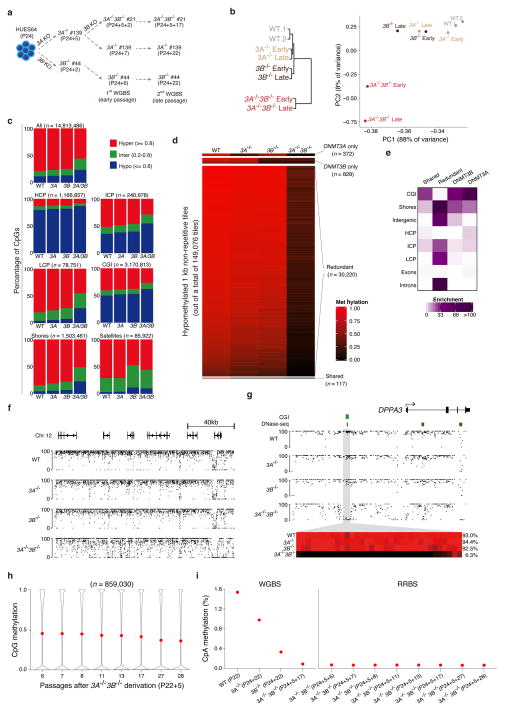
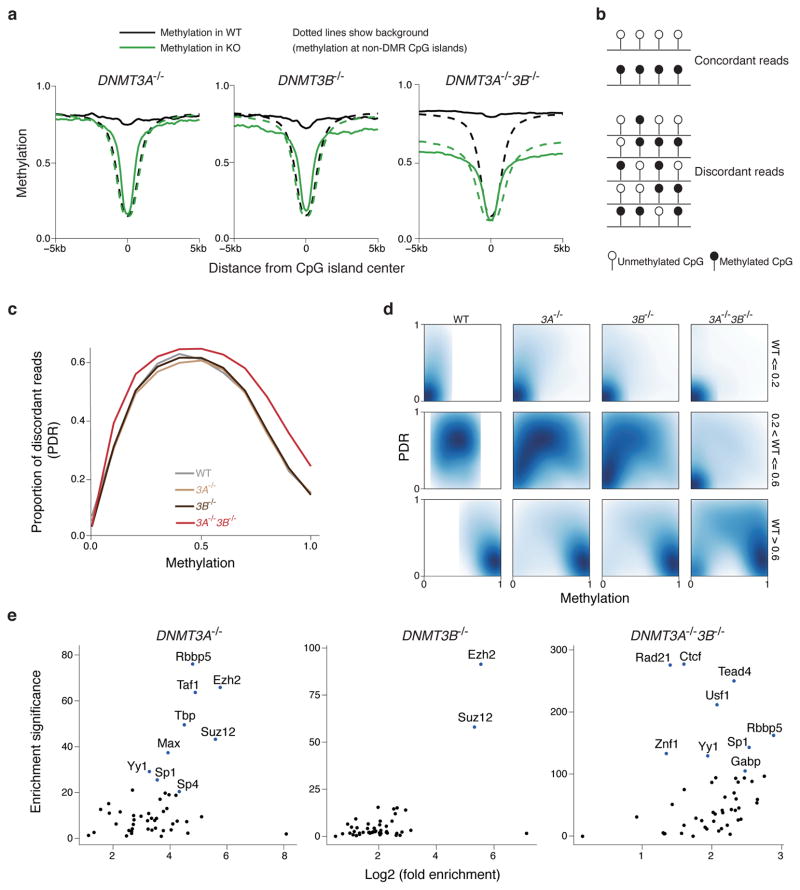
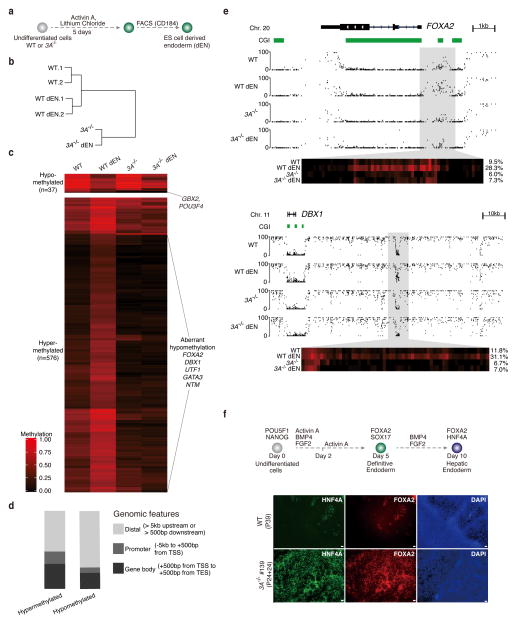
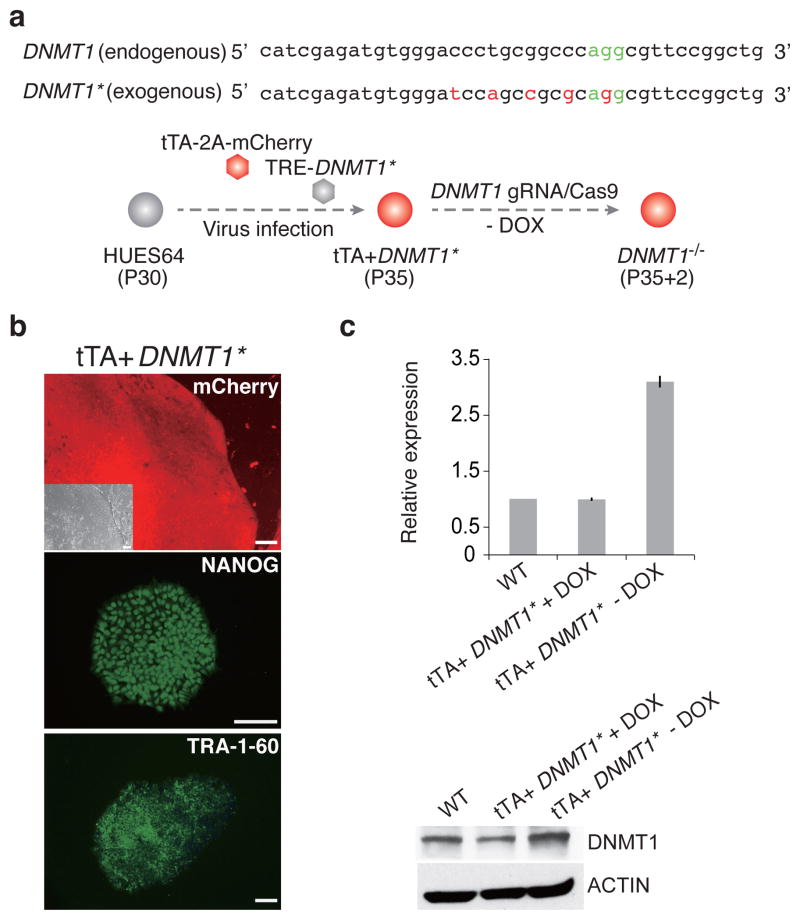
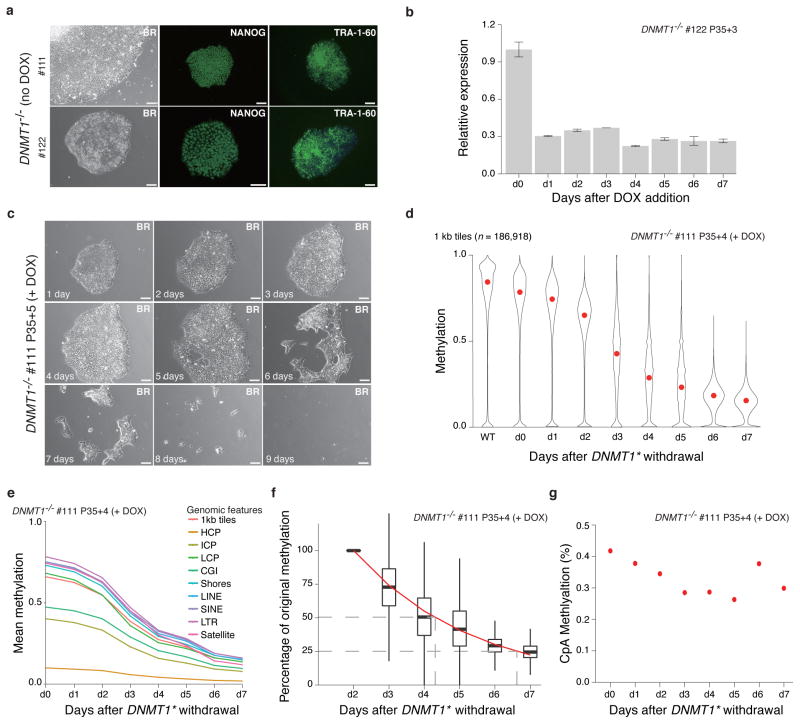
DNA methylation is a key epigenetic modification involved in regulating gene expression and maintaining genomic integrity. Here we inactivated all three catalytically active DNA methyltransferases (DNMTs) in human embryonic stem cells (ESCs) using CRISPR/Cas9 genome editing to further investigate the roles and genomic targets of these enzymes. Disruption of DNMT3A or DNMT3B individually as well as of both enzymes in tandem results in viable, pluripotent cell lines with distinct effects on the DNA methylation landscape, as assessed by whole-genome bisulfite sequencing. Surprisingly, in contrast to findings in mouse, deletion of DNMT1 resulted in rapid cell death in human ESCs. To overcome this immediate lethality, we generated a doxycycline-responsive tTA-DNMT1* rescue line and readily obtained homozygous DNMT1-mutant lines. However, doxycycline-mediated repression of exogenous DNMT1* initiates rapid, global loss of DNA methylation, followed by extensive cell death. Our data provide a comprehensive characterization of DNMT-mutant ESCs, including single-base genome-wide maps of the targets of these enzymes.


Figures

Figure 1
Figure 1. Targeted deletion of DNMT1, 3A and 3B in human ESCs
(a) Expression levels of DNMT1, 3A and 3B in undifferentiated HUES64 ESCs and their derivatives, ectoderm (dEC), mesoderm (dME) and endoderm (dEN) in FPKM (Fragments Per Kilobase per Million fragments mapped) are shown. Only expression of the major isoforms is shown (see Supplementary Fig. 1a for all). (b) Left: Expression of DNMT1, 3A, 3B for 25 pluripotent (ESC and iPSC) lines (line: median, box: IQR, whiskers: furthest point within 1.5xIQR, red dot: HUES64). Right: Cell lines and DNMT3B expression. There is substantial variation of DNMT3B expression even among biological replicates (“rep”).(c) Overview schematic of the Cas9/gRNA-target sites. Genomic coordinates are shown on the right. The gRNA-targeting sequence is underlined, and the Protospacer-Adjacent Motif (PAM) sequence is labeled in green. Position of qPCR primers for RNA expression validation is shown on the top of the exons. P: primer pair; U: upstream; D: downstream.(d) RT-qPCR analysis for DNMT1, 3A and 3B in HUES64, DNMT3A−/− (#139), DNMT3B−/− (#44) and DNMT3A−/−3B−/− (#21). Primer details are in Fig. 1c. Error bars were generated from biological triplicates and represent one standard error. (e) Western blot analysis for DNMT3A, 3B and DNMT1 in HUES64, DNMT3A−/− (#139), DNMT3B−/− (#44) and DNMT3A−/−3B−/− (#21). Arrow indicates the major DNMT3B isoform (NM_006892). The smaller band in the DNMT3B western blotting result is likely isoform 3 (NM_175849) as reported in Ref. , which was not targeted by our knockout strategy.
Figure 2
Figure 2. Assessing the differentiation potential of the DNMT3 knockouts
(a) Overview of clones and passage numbers used for the various assays. HUES64 passage 24 (P24) was used to generate DNMT3A and 3B single knockouts. The number after “+” represents the passage number post targeting. The DNMT3A−/− clone #139 was passaged five times (P24+5) and then targeted using the DNMT3B gRNA. The DNMT3A−/−3B−/− passage numbers are then counted from there. (b) Wild-type and DNMT3A−/−, 3B−/− and 3A−/−3B−/− cells show comparable morphology and expression of characteristic markers. Representative bright field (BR) and pluripotency-associated marker (NANOG, TRA-1-60) immunostaining images are shown. 10X magnification is shown. Scale bars, 100μm. (c) TaqMan hPSC Scorecard analysis of direct differentiation potential for WT, DNMT3A−/−, 3B−/− and 3A−/−3B−/− cells. Top: Schematic overview of the conditions used for direct differentiation into ectoderm, mesoderm and endoderm. Bottom: Differentiation scores for WT, DNMT3A−/−, 3B−/− and 3A−/−3B−/− cells. Gray box represents the score range of 11 reference human PSC lines. (d) Top: Schematic overview for the embryonic body (EB) formation. Bottom: Representative immunostaining images for TUJ1 (ectoderm), BRACHYURY (mesoderm) and FOXA2 (endoderm). 10X magnification is shown. Scale bars, 100μm. (e) Top: Summary of injection and teratoma formation results. Bottom: Images of the nine teratomas collected. Ruler on top provides a size reference. (f) Representative images of Hematoxylin and Eosin (H&E) staining of the teratoma from panel e. Neuroepithelium (ectoderm) (EC), cartilage with ossification center (mesoderm) (ME), and gut-like epithelium (EN). Scale bars, 50μm.
Figure 3
Figure 3. Global DNA methylation dynamics
(a) Overview of the samples used for whole genome bisulfite sequencing (WGBS). (b) Left: Hierarchical clustering using Euclidean distance based on mean DNA methylation levels of 1 kb tiles across the human genome. Right: Principal component analysis (PCA) based on mean CpG methylation levels for 1 kb tiles. (c) Fraction of CpGs with high (≥ 0.8, red), intermediate (inter, >0.2 and <0.8, green) and low (≤ 0.2, blue) methylation values. Top left panel shows all CpGs while the other panels show CpG methylation distribution within different genomic features, including high CpG Promoters (HCP), intermediate CpG promoters (ICP), low CpG promoters (LCP), CpG islands (CGI), CpG island shores, and satellite repeats. The total number of CpGs associated with each feature is shown above each bar plot. (d) Heatmap of non-repetitive differentially methylated 1kb tiles (q-value < 0.05 and methylation difference greater than 0.4). (e) Enrichment [−log10(hypergeometric p-value)] of genomic features in the target classes identified in Fig. 3d. (f) Genome browser tracks covering approximately 160kb in the different lines. (g) Higher resolution view of the DPPA3 (STELLA) locus. The heat map below shows the DNA methylation values of individual CpGs within the grey region. The average DNA methylation value for the entire highlighted region is shown on the right. (h) CpG methylation levels over several passages of the DNMT3A−/−3B−/− cells. Red dot indicates mean methylation. (i) Global mean CpA methylation levels as assayed by WGBS and over several passages of the DNMT3A−/−3B−/− cells by RRBS.
Figure 4
Figure 4. Characterization of targets for DNMT3A and DNMT3B
(a) Composite plot of methylation around CpG islands in WT and knockouts. The solid lines show the mean methylation of differentially methylated CpG islands, while the dotted lines show the mean methylation of all other CpG islands. (b) Schematic for the definition of concordant and discordant reads. (c) Proportion of discordant reads (PDR) in WT, DNMT3A−/−, 3B−/− and 3A−/−3B−/− cells. (d) Two-dimensional density plots of PDR vs. methylation for CpGs with low (<= 0.2), medium(> 0.2 and <= 0.6) and high(> 0.6) methylation in WT cells. (e) Enrichment of experimentally determined transcription factor binding sites in H1 ESCs generated by the ENCODE project for DMRs in DNMT3A−/−, 3B−/− and 3A−/−3B−/− cells compared to WT. Enrichment significance was defined as −log10(p-value) of the Fisher’s exact test, with the background being non-repetitive 1kb tiles that had at least 0.4 enrichment in WT.
Figure 5
Figure 5. Effect of DNMT3A deletion on endoderm differentiation
(a) Schematic for the generation of CD184+ endodermal progenitor cells (dEN). (b) Global analysis for the WGBS data of undifferentiated and dEN cells from WT (P23 and P26) and DNMT3A−/− (P24+13). Hierarchical clustering based on mean DNA methylation levels of 1 kb tiles across the human genome using Euclidean distance. 1 and 2 are two biological replicates. The passage number of the replicates is within 2 passages. (c) Heat map of methylation levels (black, 0; red, 1) in WT, WT dEN, DNMT3A−/−, and DNMT3A−/− dEN of DMRs that change methylation significantly (q-value < 0.05 and methylation difference of at least 0.2) between WT and WT dEN. (d) Classification of endoderm DMRs into promoters, gene bodies and distal regions as defined in the legend. (e) Genome browser tracks of 1kb and 10kb regions highlight global and local methylation level for FOXA2 and DBX1. The heat map below shows the DNA methylation values of individual CpGs within the highlighted region. The average DNA methylation value for the entire highlighted region is shown on the right. (f) Hepatoblast differentiation of WT (P39) and DNMT3A−/− (P24+24) cells. Top: Schematic of hepatoblast differentiation. Bottom: Representative images from two individual biological replicates are shown. 4X magnification of hepatoblast markers FOXA2, HNF4A immunostaining images for HUES64 (WT), DNMT3A−/− (#139) are shown. Scale bars, 100μm.
Figure 6
Figure 6. DNMT1 knockout strategy and targeting efficiency
(a) Strategy to obtain DNMT1 homozygous clones. Top: We created mutations within the exogenous DNMT1 sequence that would prevent the targeting by our gRNA, but not alter the protein (Supplementary Fig. 6d). Asterisk (*) is used to distinguish the exogenous modified DNMT1* from endogenous DNMT1. Bottom: The DNMT1 rescue line was established by infecting HUES64 with two separate lenti virus, tTA-2a-mCherry and TRE-DNMT1* at passage 30. Then, DNMT1 was targeted as before into the tTA-DNMT1* line while the exogenous DNMT1* was expressed (no DOX). (b) Representative bright field (BR), mCherry expression and pluripotent markers NANOG, TRA-1-60 immunostaining images for rescue line tTA+DNMT1*. Scale bars, 100μm. (c) DNMT1 expression levels in our DNMT1* TET/OFF system. Left: RT-qPCR analysis for DNMT1. Primers amplify both endogenous and exogenous DNMT1. Error bars were generated from biological replicates and represent one standard error. Right: Western blotting analysis for DNMT1 under the control of DOX. The antibody can detect both endogenous and exogenous DNMT1.
Figure 7
Figure 7. Loss of DNMT1 causes global demethylation and cell death
(a) Representative bright field (BR) and NANOG/TRA-1-60 immunostaining for DNMT1−/− cells with the exogenous DNMT1* expressed (no DOX). 10X magnification. Scale bars, 100μm. (b) RT-qPCR analysis after DNMT1* withdrawal relative to d0 level. Error bars are based on two replicates and represent one standard error. (c) DNMT1* withdrawal causes massive cell death. Representative 10X magnification bright field (BR) images are shown. Scale bars: 100μm. (d) Violin plots of the mean methylation (measured by RRBS) of 1 kb tiles across the human genome after DNMT1* withdrawal. Mean is indicated by red dot. (e) Global reduction of DNA methylation in different genomic features. Overall CpGs (1kb tile) and selected features including CpG Islands (CGI), Shores, HCPs, ICPs, LCPs, LINEs, SINEs and satellite repeats are shown. (f) Exponential model of methylation decay for 1kb tiles. Methylation at day 2 was normalized to 1 and methylation levels on subsequent days were calculated as a percentage of the day 2 value. An exponential model was fitted starting at day 2 and is shown by the red line. The dashed grey lines mark the timepoints when 50% and 25% of the day 2 methylation levels remain. Days 0 and 1 were excluded from this model to avoid noise from any remaining DNMT1 protein. (g) Mean CpA methylation levels after DNMT1* withdrawal.

Comment in

References

    1. Bird A. DNA methylation patterns and epigenetic memory. Genes Dev. 2002;16:6–21. - PubMed
    1. Jackson M, et al. Severe global DNA hypomethylation blocks differentiation and induces histone hyperacetylation in embryonic stem cells. Mol Cell Biol. 2004;24:8862–71. - PMC - PubMed
    1. Li E, Bestor TH, Jaenisch R. Targeted mutation of the DNA methyltransferase gene results in embryonic lethality. Cell. 1992;69:915–26. - PubMed
    1. Okano M, Bell DW, Haber DA, Li E. DNA methyltransferases Dnmt3a and Dnmt3b are essential for de novo methylation and mammalian development. Cell. 1999;99:247–57. - PubMed
    1. Jin B, et al. DNA methyltransferase 3B (DNMT3B) mutations in ICF syndrome lead to altered epigenetic modifications and aberrant expression of genes regulating development, neurogenesis and immune function. Hum Mol Genet. 2008;17:690–709. - PubMed

Publication types

MeSH terms

Substances

Associated data