. 2015 May;16(5):485-94.
doi: 10.1038/ni.3132. Epub 2015 Mar 30.

Senataxin suppresses the antiviral transcriptional response and controls viral biogenesis

Affiliations

Senataxin suppresses the antiviral transcriptional response and controls viral biogenesis

Matthew S Miller et al. Nat Immunol. 2015 May.

Abstract

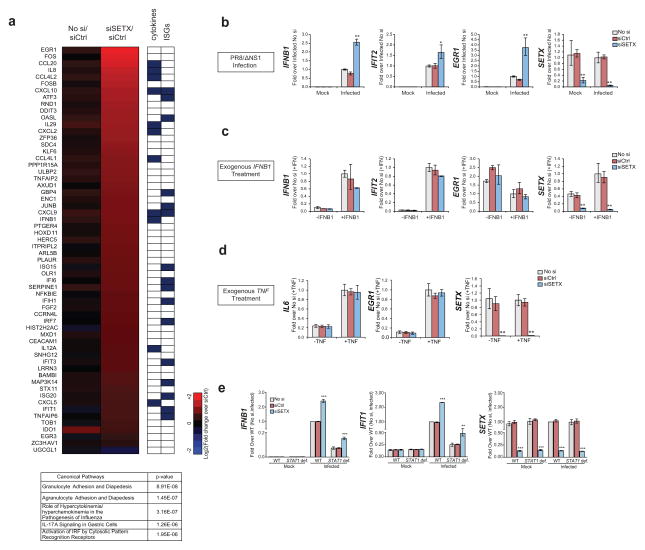
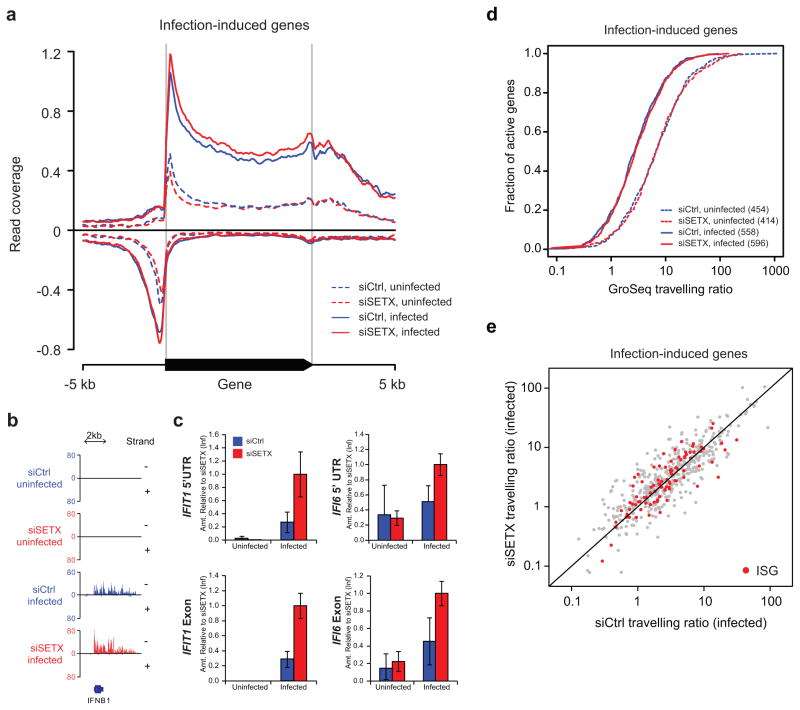
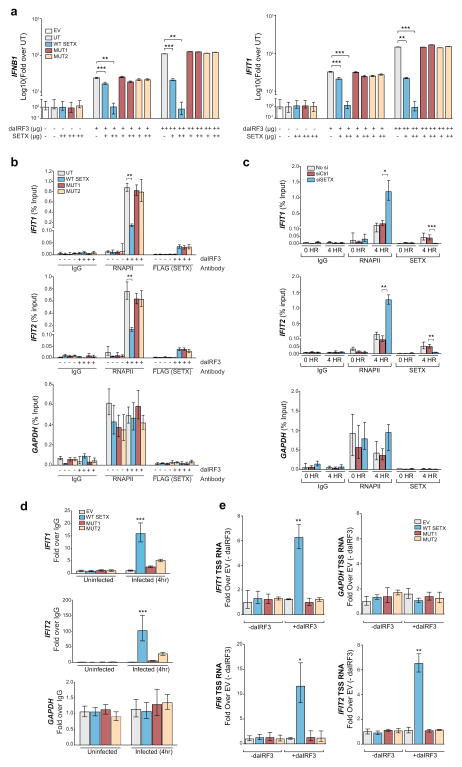
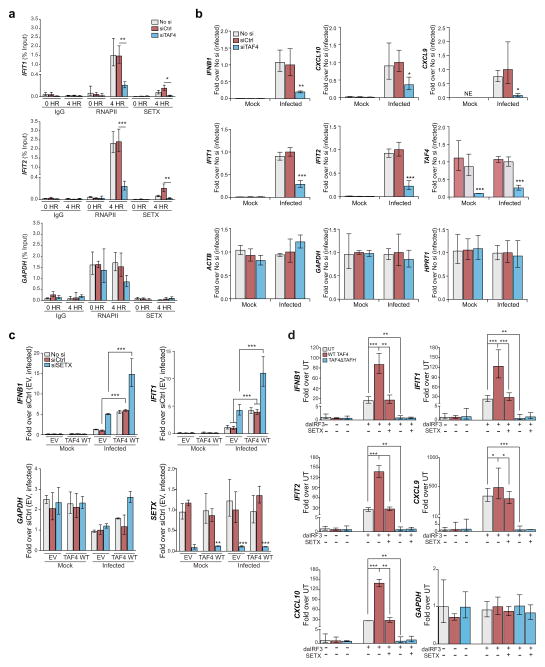
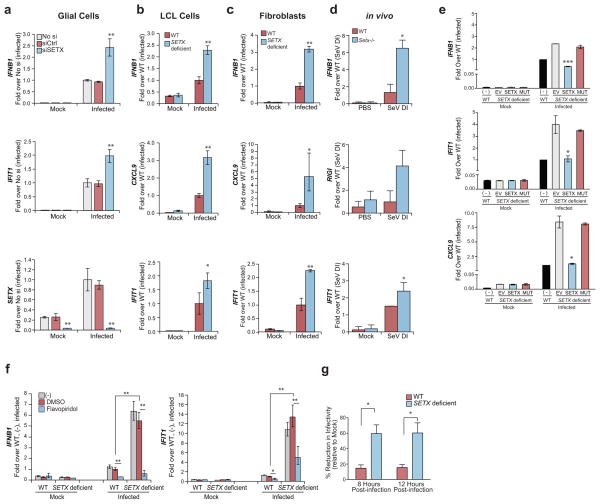
The human helicase senataxin (SETX) has been linked to the neurodegenerative diseases amyotrophic lateral sclerosis (ALS4) and ataxia with oculomotor apraxia (AOA2). Here we identified a role for SETX in controlling the antiviral response. Cells that had undergone depletion of SETX and SETX-deficient cells derived from patients with AOA2 had higher expression of antiviral mediators in response to infection than did wild-type cells. Mechanistically, we propose a model whereby SETX attenuates the activity of RNA polymerase II (RNAPII) at genes stimulated after a virus is sensed and thus controls the magnitude of the host response to pathogens and the biogenesis of various RNA viruses (e.g., influenza A virus and West Nile virus). Our data indicate a potentially causal link among inborn errors in SETX, susceptibility to infection and the development of neurologic disorders.


Conflict of interest statement

COMPETING FINANCIAL INTERESTS

The authors declare no competing financial interests.

Figures

Figure 1
Figure 1
SETX suppresses antiviral gene expression during infection (a) Heatmap of gene expression fold changes in un-transfected (No si) or SETX siRNA (siSETX) transfected A549 cells compared to control siRNA transfected cells (siCtrl) (p<0.01; ANOVA with post-hoc TUKEY HSD test, n=3 per condition) at an early (4 hours) time point post-infection. Known cytokines and interferon-stimulated genes (ISGs) are indicated in the right panel. The top five significant canonical pathways enriched within siSETX-affected genes are shown in the table underneath. (b–d). Expression of indicated genes in siSETX transfected, siCtrl transfected and untransfected A549 cells upon PR8 NS1 infection (b), exogenous IFNB1 treatment (c) or exogenous TNF treatment (d). (e) Expression of the indicated genes in uninfected or PR8ΔNS1 infected (4 hours post-infection) human STAT1-deficient (STAT1 def.) and STAT1-proficient (WT) human fibroblast cells left untreated, or treated with siCtrl or siSETX. For b–e, the means and standard deviation of three independent experiments are shown. Asterisks (*, ** and ***) indicate t-test p-values of <0.05, <0.005 and <0.0005 respectively.
Figure 2
Figure 2
Loss of SETX increases engaged RNAPII at infection-induced genes. (a) Meta-analysis of GRO-seq signals across 872 genes induced in human A549 cells upon infection with influenza PR8ΔNS1, before (dashed) and 4 hours after infection (solid) in siCtrl (blue lines) and siSETX (red lines) treated cells. Y-axis indicates the geometric mean coverage per 5 million reads in a 30 bp sliding window. (b) GRO-seq read coverage in the IFNB1 gene region. Y-axis indicates base coverage per 5 million reads. − and + refer to the DNA strands. (c) Quantification of GRO-seq by using qPCR for the representative affected IFI6 and IFIT1 genes. The means and standard deviations of three experiments are shown. (d) Travelling ratios (TR) of active infection induced genes for the conditions indicated in a. TRs were calculated as the average number of tags per bp in the promoter-proximal region (30 to +300 bp around TSS) divided by that on the gene body (+300 bp to the end of the gene). The number of active genes identified in each condition is indicated between brackets. (e) Scatter plot of TRs of active genes in siSETX and siCtrl treated A549 cells, 4 hours after infection with PR8ΔNS1. Known interferon stimulated genes (ISG) are highlighted in red.
Figure 3
Figure 3
SETX controls IRF3-dependent antiviral gene expression. (a) Expression levels of IFNB and IFIT1 genes in A549 cells upon transient expression of the indicated proteins. The means and standard deviation of three independent experiments are shown. The amount of DNA transfected per condition is indicated as (−) : 0 μg; (+): 1 μg; (++): 5 μg. (b) ChIP-qPCR analysis of RNAPII and Flag-SETX using the experimental system described in (a), and showing the recruitment of RNAPII and wild type and mutant SETX to the transcription start sites (TSS) of antiviral (IFIT1 and IFIT2) and housekeeping (GAPDH) genes. IgG represents the control IP. A representative experiment of three independent ChIP experiments is shown, where the mean and standard deviation of three technical replicates are displayed. (c) ChIP analysis of endogenous RNAPII and SETX at the TSS of the indicated genes upon infection in control or SETX-depleted A549 cells. A representative experiment of three independent experiments is shown. The means and standard deviation of three technical replicates are shown. (d). RNA-IP of uninfected or PR8ΔNS1 infected A549 cells transfected with empty vector (EV) or vectors expressing wild type or mutant SETX. Specific enrichment of SETX binding to 5′ UTR-derived RNAs of IFIT1, IFIT2 and GAPDH was analyzed by qPCR. The means and standard deviation of three independent experiments are shown. (e) qPCR analyses of TSS-associated RNA in A549 cells overexpressing wild type and mutant SETX along with daIRF3. Means and standard deviations of three independent experiments are shown. For a–e, asterisks (*,** and ***) indicate t-test p-values <0.05, 0.005 and <0.0005 respectively. Abbreviations used: UT: untreated; EV: empty vector; WT SETX: wild type SETX; MUT1: K1969Q SETX helicase mutant; MUT2: G2343D SETX RNA-binding mutant; daIRF3: dominant active IRF3
Figure 4
Figure 4
TAF4 controls antiviral gene expression. (a) ChIP analyses of IgG control, RNAPII and SETX in PR8ΔNS1 infected or control cells treated with control non-targeting siRNA (siCtrl) or siRNAs against TAF4 (siTAF4). Untreated cells (No Si) are included as controls. Analyses were performed at the transcriptional start (TSS) of the indicated genes. (b) Expression levels of the indicated genes upon infection in siTAF4 treated or control cells (siCtrl or No si). (c) Expression levels of the indicated genes in siCtrl and siSETX treated cells overexpressing wild type TAF4 or its empty vector control (EV). (d) Expression levels of the indicated genes in upon transient expression of the indicated proteins. Abbreviations: UT: untreated; SETX: wild type SETX; daIRF3: dominant active IRF3; TAF4: wild type TAF4; TAF4 Δ TAFH: TAFH deletion mutant. For a–d, A549 cells were used and the means and standard deviation of three independent experiments are shown; Asterisks (*,**,***) indicate p-values <0.05, < 0.005 and <0.0005 as calculated by t-tests against siCtrl treated cells (a–c) or the corresponding daIRF3 overexpressing cells (d).
Figure 5
Figure 5
Dysregulated antiviral response in SETX deficient human cells. (a–c) mRNA expression in PR8ΔNS1 infected (4 hours post-infection) SETX depleted and control human glial (a) or lymphoblastoid (LCL; b) and fibroblast (c) cells isolated from AOA2 patients derived SETX deficient and wild type human cells (WT). (d) qPCR expression analyses of the indicated genes in the lungs of WT or Setx−/− mice treated for 6 hours with 4 μg of in vitro transcribed Sendai virus defective interfering RNA (SeV DI; n = 3 per group) or PBS (n = 4 per group) intranasally. (e) qPCR analyses of representative antiviral genes in uninfected or PR8ΔNS1 infected SETX deficient LCL reconstituted with empty vector (EV), wild type (SETX) and ATPase mutant (MUT) SETX. (f) Expression of IFNB1 and IFIT1 in SETX deficient and WT fibroblasts in the presence of flavopiridol, DMSO vehicle control or untreated control cells. (g) WT and SETX deficient LCL cells were infected with PR8ΔNS1 at a high MOI and supernatants collected at 8 and 12 hours post-infection were used to pretreat A549 cells for 12h prior to infection with a PR8-GLuc reporter virus at an MOI 1. Luciferase signal was quantified 8 hours post-infection. The mean and standard error of 3 independent experiments are shown. For a–c, e and f the means and standard deviation of three independent experiments are shown. For a–g, asterisks (*,** and ***) indicate t-test p-values < 0.05, < 0.005 and 0.0005 respectively.

References

    1. Pichlmair A, Sousa CRE. Innate recognition of viruses. Immunity. 2007;27(3):370–383. - PubMed
    1. Ward PA. New approaches to the study of sepsis. Embo Mol Med. 2012;4(12):1234–1243. - PMC - PubMed
    1. Brandes M, Klauschen F, Kuchen S, Germain RN. A systems analysis identifies a feedforward inflammatory circuit leading to lethal influenza infection. Cell. 2013;154(1):197–212. - PMC - PubMed
    1. Crow YJ, Leitch A, Hayward BE, Garner A, Parmar R, Griffith E, et al. Mutations in genes encoding ribonuclease H2 subunits cause Aicardi-Goutieres syndrome and mimic congenital viral brain infection. Nat Genet. 2006;38(8):910–916. - PubMed
    1. Garcia-Sastre A, Biron CA. Type 1 interferons and the virus-host relationship: a lesson in detente. Science. 2006;312(5775):879–882. - PubMed

Publication types

MeSH terms

Supplementary concepts

Associated data