. 2015 Apr;21(4):335-43.
doi: 10.1038/nm.3832. Epub 2015 Mar 30.

DOT1L inhibits SIRT1-mediated epigenetic silencing to maintain leukemic gene expression in MLL-rearranged leukemia

Affiliations

DOT1L inhibits SIRT1-mediated epigenetic silencing to maintain leukemic gene expression in MLL-rearranged leukemia

Chun-Wei Chen et al. Nat Med. 2015 Apr.

Abstract

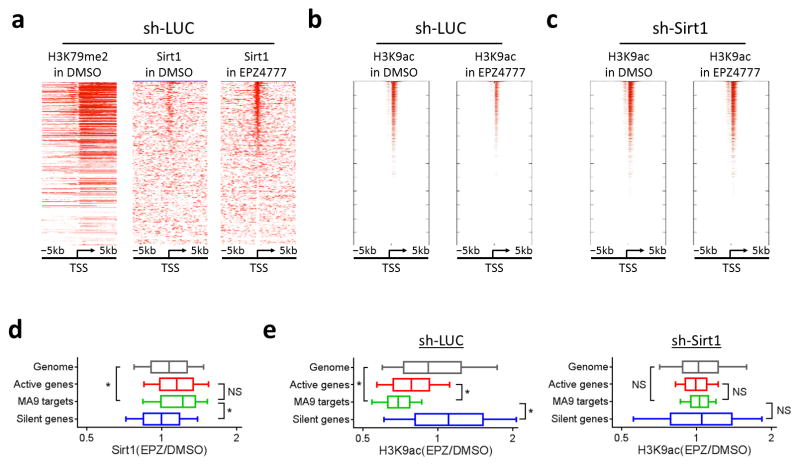
Rearrangements of MLL (encoding lysine-specific methyltransferase 2A and officially known as KMT2A; herein referred to as MLL to denote the gene associated with mixed-lineage leukemia) generate MLL fusion proteins that bind DNA and drive leukemogenic gene expression. This gene expression program is dependent on the disruptor of telomeric silencing 1-like histone 3 lysine 79 (H3K79) methyltransferase DOT1L, and small-molecule DOT1L inhibitors show promise as therapeutics for these leukemias. However, the mechanisms underlying this dependency are unclear. We conducted a genome-scale RNAi screen and found that the histone deacetylase SIRT1 is required for the establishment of a heterochromatin-like state around MLL fusion target genes after DOT1L inhibition. DOT1L inhibits chromatin localization of a repressive complex composed of SIRT1 and the H3K9 methyltransferase SUV39H1, thereby maintaining an open chromatin state with elevated H3K9 acetylation and minimal H3K9 methylation at MLL fusion target genes. Furthermore, the combination of SIRT1 activators and DOT1L inhibitors shows enhanced antiproliferative activity against MLL-rearranged leukemia cells. These results indicate that the dynamic interplay between chromatin regulators controlling the activation and repression of gene expression could provide novel opportunities for combination therapy.


Conflict of interest statement

COMPETING FINANCIAL INTERESTS

S.A.A. is a consultant for Epizyme Inc.. The remaining authors report no competing financial interests.

Figures

Figure 1
Figure 1
Genome-scale RNAi screen for “antagonists of Dot1L” in MLL-AF9 leukemia. (a) Schematic outline of a genome-scale shRNA library screen coupled with high-throughput sequencing (HiSeq) in mouse MLL-AF9 leukemia cells harboring Dot1lfl/fl alleles and tamoxifen-inducible Cre recombinase (CreER). (b) Genotyping PCR for Dot1L engineered allele and immunoblot for histone H3 modifications in MLL-AF9-Dot1lfl/fl-CreER leukemia cells after tamoxifen-induced Dot1L-excision. (c) Wright-Giemsa stain of MLL-AF9-Dot1lfl/fl-CreER leukemia cells before and after tamoxifen treatment. Scale bar, 20 μm. (d) Cell number expansion of Dot1lfl/fl-CreER (red) and Dot1lwt/wt-CreER (blue) MLL-AF9 leukemia cells cultured in tamoxifen. (e) Volcano plot depicts the changes in representation (x-axis) and significance (y-axis) of each shRNA construct in the screen before versus after tamoxifen-induced Dot1L deletion. Total library (gray; 92,425 shRNA), enriched shRNA (red; more than 4-fold increase and p value ≤ 0.05 in the six replicates; 934 shRNA) and sh-Sirt1 (blue; five shRNA) are highlighted. (f) Relative blast colony number from sh-LUC or sh-Sirt1 transduced MLL-AF9-Dot1lfl/fl-CreER leukemic cells cultured in ethanol (green) or tamoxifen (red). The numbers of blast colonies were normalized to the total colony count in control cultures transduced with the same shRNA construct. Data represent the observed values and mean ± s.d. of (d) three independent experiments and (f) four replicates. *P < 0.01 using Student’s t-test.
Figure 2
Figure 2
Sirt1 mediates the response of MLL-AF9 leukemia cells to DOT1L inhibitor EPZ4777. (a,c,h,i) Effect of EPZ4777 on the proliferation of mouse MLL-AF9 leukemia cells transduced with (a) sh-Sirt1 (red) or sh-LUC (green), (h) MSCV-puro-Meis1 (red), Hoxa7 (blue), or empty vector (green), and (i) MSCV-puro-Meis1 plus MSCV-ires-Tomato-Hoxa7 (red) or dual empty vectors (green), as well as (c) co-treated with Ex527 (red), suramin (blue) or DMSO (green). (b,d) Immunoblot of (b) Sirt1, H3K79me2, histone H3 and tubulin in MLL-AF9 leukemic cells transduced with sh-LUC or sh-Sirt1 and cultured in EPZ4777, and (d) Sirt1 and tubulin in sh-Sirt1 transduced MLL-AF9 cells further infected with MSCV-ires-Tomato empty vector (MIT-Vec) or Sirt1 (MIT-Sirt1) virus. (e) Relative number of the cells described in (d) cultured in EPZ4777 (red) or DMSO (green). (f) Microarray and GSEA analyses showing changes in expression of “EPZ4777_down gene set” (978 genes; Supplementary Table 3) in sh-LUC transduced MLL-AF9 cells cultured in EPZ4777 versus DMSO (left panel), as well as sh-Sirt1 versus sh-LUC transduced MLL-AF9 cells cultured in EPZ4777 (right panel). Heatmaps showing genes comprising the early leading edge (top 50 genes) of the GSEA plots. (g) RT-qPCR of Hoxa7 and Meis1 in sh-LUC or sh-Sirt1 transduced MLL-AF9 leukemic cells cultured in EPZ4777 (red) or DMSO (green). Cells were cultured in the presence of EPZ4777 or DMSO for (f,g) 6 days and (a,c,e,h,i) 9 days, respectively. Data represent the observed values and mean ± s.d. of (a,c,e,h,i) three replicates, and (g) three independent experiments. *P < 0.05; **P < 0.01 to control group using Student’s t-test.
Figure 3
Figure 3
Sirt1 localizes to active genes and mediates deacetylation of H3K9 in response to Dot1L inhibition. (a–c) Heatmaps showing ChIP-seq signal of (a) H3K79me2 and Sirt1, and (b,c) H3K9ac at TSS ± 5 kb regions for all genes in MLL-AF9 leukemic cells transduced with (a,b) sh-LUC or (c) sh-Sirt1. Genes are ranked according to ChIP-seq signal of Sirt1 in EPZ4777 from high (top) to low (bottom). (d,e) Boxplots showing changes in ChIP-seq signal of (d) Sirt1 and (e) H3K9ac at TSS ± 2 kb regions of genome (gray; 18,420 genes), active genes (red; 4,560 genes), MLL-AF9 targets (green; 129 genes) and silent genes (blue; 4,560 genes) in mouse MLL-AF9 leukemic cells. Cells were cultured in DMSO or EPZ4777 for 6 days. Data represent mean ± s.d. NS, not significant; *P < 0.001 to MLL-AF9 targets using Welch’s t-test.
Figure 4
Figure 4
Unique H3K9 epigenomic signature at MLL-AF9 bound gene loci in MLL-fusion leukemia. (a,b) Scatterplots showing ChIP-seq signals for H3K79me2 (x-axis) and H3K9ac (y-axis) in mouse (a) MLL-AF9 leukemic cells, and (b) LSK cells sorted from normal mouse bone marrow. Hoxa cluster genes and Meis1 are highlighted in black circles. (c,h) Screen shots showing ChIP-seq profiles of MLL-AF9 fusion protein (black), H3K79me2 (blue) and H3K9ac (red) at select MLL-AF9 bound target (HOXA cluster and MEIS1), active gene (GAPDH) and silent gene (HBB/OLFR) loci in (c) mouse and (h) human MLL-AF9 leukemic cell lines. The core occupied regions for MLL-AF9 fusion protein in mouse MLL-AF9 leukemia are highlighted (c; green-dashed box). (d–g) Boxplots showing ChIP-seq signal of H3K9ac in (d) mouse and (e–g) human MLL-AF9 leukemic cells including (e) Molm13, (f) Nomo1 and (g) MonoMac6 cells. (a,b,d–g) Data showing ChIP-seq signals of H3K79me2 or H3K9ac at TSS ± 2 kb regions of genome (gray; 18,240 genes), active genes (red; 4,560 genes), MLL-AF9 targets (green; 129 genes) and silent genes (blue; 4,560 genes). (d–g) Data represent mean ± s.d. *P < 0.001 to MLL-AF9 targets using Welch’s t-test.
Figure 5
Figure 5
Methylation of H3K9 by Suv39h1 is involved in Sirt1-mediated silencing of the MLL-AF9 leukemic program upon suppression of Dot1L. (a) Scatterplots and boxplots showing changes in ChIP-seq signals for H3K9ac (x-axis; both panels), H3K9me2 (y-axis; left panel) and H3K27me3 (y-axis; right panel) at TSS ± 2 kb regions of genome (gray; 18,240 genes) and MLL-AF9 targets (129 genes) in sh-LUC (red) or sh-Sirt1 (blue) transduced mouse MLL-AF9 leukemic cells cultured in EPZ4777 versus DMSO. (b) Venn diagram showing the overlap genes in “SIRT1-interacting proteins” and “candidate antagonists of Dot1L”. (c) Effect of EPZ4777 on the proliferation of MLL-AF9 leukemic cells transduced with sh-LUC (green), sh-Sirt1 (red) or sh-Suv39h1 (blue). (d) Immunoblot of Suv39h1, Sirt1, H3K9me2 and histone H3 in MLL-AF9 leukemic cells transduced with sh-LUC or sh-Suv39h1. (e,g,h) ChIP-qPCR of (e) H3K9me2, (g) Sirt1, and (h) Suv39h1 for Hoxa7 and Meis1 gene TSS regions in MLL-AF9 leukemic cells transduced with sh-LUC, sh-Sirt1, or sh-Suv39h1. (f) RT-qPCR of Hoxa7 and Meis1 in sh-LUC or sh-Suv39h1 transduced MLL-AF9 leukemic cells. (i) Bar-graph and boxplot showing changes in ATAC-seq signals at TSS ± 2 kb regions of MLL-AF9 targets (129 genes) in sh-LUC (green), sh-Sirt1 (red) and sh-Suv39h1 (blue) transduced MLL-AF9 leukemic cells cultured in EPZ4777 versus DMSO. Individual MLL-AF9 target genes in bar-graph are ranked according to ATAC-seq (EPZ/DMSO) ratio in sh-LUC cells from high (left) to low (right). Cells were cultured in the presence of EPZ4777 or DMSO for (a,e–i) 6 days and (c) 9 days, respectively. Data represent the observed values and mean ± s.d. of (c,e) two and (g,h) four replicates, and (f) three independent experiments. NS, not significant; *P < 0.05; **P < 0.01; ***P < 0.001 using (a,i) Welch’s t-test and (c, e–h) Student’s t-test.
Figure 6
Figure 6
SIRT1 activator SRT1720 sensitizes MLL-r leukemia to DOT1L inhibitor EPZ4777. (a–e) Mouse MLL-AF9 leukemic cells were treated with DMSO (blue), SRT1720 alone (1 μM; red), EPZ4777 alone (10 μM; orange) or the combination of SRT1720 plus EPZ4777 (green) for 6 days in tissue culture. (a) RT-qPCR and (b) H3K9ac-ChIP-qPCR for Hoxa7 and Meis1 genes. (c) Kaplan-Meier survival curves of mice transplanted with pretreated cells. (d) Percentage of GFP-positive MLL-AF9 leukemic blasts in the peripheral blood of the mice described in (c) on day 15 post-transplantation. (e) Relative blast colony count of pretreated cells further cultured in methylcellulose without the small molecules. (f,g) Effect of EPZ4777 on the proliferation of (f) mouse MLL-AF9 leukemic cells, and (g) human Molm13 (MLL-AF9), MV4-11 (MLL-AF4), SEMK2 (MLL-AF4), Kasumi-1 (AML1-ETO) and HL-60 leukemic cell lines. Cells were co-treated with the indicated concentration of EPZ4777 and either DMSO (red) or SRT1720 (1 μM; green) for (f) 3, 6 and 10 days, and (g) 17 days, respectively. Data represent the observed values and mean ± s.d. of (a,b,f,g) two and (e) six replicates, and (d) ten mice per group. *P < 0.05 and #P <0.01 compared to DMSO group; **P < 0.05 and ##P < 0.01 compared to both DMSO and EPZ4777 alone groups using (a,b,d,e) Student’s t-test and (c) Mantel-Cox test.

Comment in

References

    1. Strahl BD, Allis CD. The language of covalent histone modifications. Nature. 2000;403:41–45. - PubMed
    1. Tessarz P, Kouzarides T. Histone core modifications regulating nucleosome structure and dynamics. Nature reviews Molecular cell biology. 2014;15:703–708. - PubMed
    1. Rea S, et al. Regulation of chromatin structure by site-specific histone H3 methyltransferases. Nature. 2000;406:593–599. - PubMed
    1. van Leeuwen F, Gafken PR, Gottschling DE. Dot1p modulates silencing in yeast by methylation of the nucleosome core. Cell. 2002;109:745–756. - PubMed
    1. Singer MS, et al. Identification of high-copy disruptors of telomeric silencing in Saccharomyces cerevisiae. Genetics. 1998;150:613–632. - PMC - PubMed

Publication types

MeSH terms

Associated data