. 2015 May;14(5):532-9.
doi: 10.1038/nmat4249. Epub 2015 Mar 30.

Biodegradable silicon nanoneedles delivering nucleic acids intracellularly induce localized in vivo neovascularization

Affiliations

Biodegradable silicon nanoneedles delivering nucleic acids intracellularly induce localized in vivo neovascularization

C Chiappini et al. Nat Mater. 2015 May.

Abstract

The controlled delivery of nucleic acids to selected tissues remains an inefficient process mired by low transfection efficacy, poor scalability because of varying efficiency with cell type and location, and questionable safety as a result of toxicity issues arising from the typical materials and procedures employed. High efficiency and minimal toxicity in vitro has been shown for intracellular delivery of nuclei acids by using nanoneedles, yet extending these characteristics to in vivo delivery has been difficult, as current interfacing strategies rely on complex equipment or active cell internalization through prolonged interfacing. Here, we show that a tunable array of biodegradable nanoneedles fabricated by metal-assisted chemical etching of silicon can access the cytosol to co-deliver DNA and siRNA with an efficiency greater than 90%, and that in vivo the nanoneedles transfect the VEGF-165 gene, inducing sustained neovascularization and a localized sixfold increase in blood perfusion in a target region of the muscle.


Figures

Figure 1
Figure 1. Porous silicon nanoneedles
a, Schematic of the nanoneedle synthesis combining conventional microfabrication and metal-assisted chemical etch (MACE). RIE, Reactive ion etching. b,c, SEM micrographs showing the morphology of porous silicon nanoneedles fabricated according to the process outlined in a. b, Ordered nanoneedle arrays with pitches of 2 µm, 10 µm and 20 µm, respectively. Scale bars, 2 µm. c, High-resolution SEM micrographs of nanoneedle tips showing the nanoneedles’ porous structure and the tunability of tip diameter from less than 100nm to over 400 nm. Scale bars, 200 nm. d, Time course of nanoneedles incubated in cell-culture medium at 37 °C. Progressive biodegradation of the needles appears, with loss of structural integrity between 8 and 15 h. Complete degradation occurs at 72 h. Scale bars, 2 µm. e, ICP-AES quantification of Si released in solution. Blue and black bars represent the rate of silicon release per hour and the cumulative release of silicon, respectively, at each timepoint, expressed as a percentage of total silicon released. Error bars represent the s.d. of 3–6 replicates.
Figure 2
Figure 2. Cell interfacing, cytocompatibility and biodegradation
a,b, Confocal microscopy, SEM and FIB-SEM cross-sections of cells over nanoneedles (nN-B) at 4 h (a) and of nanoneedles on top of cells (nN-T; 100 rcf) at 0 h (b) show cell spreading, adhesion and nanoneedle interfacing. Scale bars, 10 µm confocal; 5 µm SEM; 2 µm FIB-SEM. c,MTT assay comparing the metabolic activity of cells grown on a flat silicon substrate (WT) with the activities for the nN-T and nN-B settings over the course of five days. d, LDH assay comparing the release of lactate dehydrogenase over the course of two days for human dermal fibroblasts (HDF) grown on nN-T, nN-B, and tissue culture plastic (WT). Cells incubated with Triton-X serve as positive controls for membrane permeabilization. ***p<0.001. Error bars in c,d represent the s.d. of 3 replicates.
Figure 3
Figure 3. Intracellular co-delivery of nucleic acids
a, Co-delivery of GAPDH-siRNA (Cy3 labelled in yellow) and GFP plasmid (GFP in green) to cells in culture after application using the nN-B interfacing strategy. Confocal image acquired 48 h post transfection. The siRNA and GFP signal are present diffusely throughout the cytosol. Scale bars, 5 µm. b, Flow-cytometry scatter (dot) plot shows that >90% of siRNA transfected cells are positive for Cy3 (blue cluster) and that greater than 90% of co-transfected cells are positive for GFP and Cy3 (red cluster) compared with cells transfected with empty needles (black). c, Quantification of flow-cytometry data according to the gate outlined in b to show the percentage of GAPDH-positive, GFP-positive and double-positive cells for nanoneedles loaded with siRNA (S), siRNA and GFP plasmid (SCP). Empty needles were used as the control (C). d, In-cell western assay showing an entire nN-B chip seeded with cells. The fluorescent signal from GAPDH is significantly reduced for cells to which GAPDH siRNA has been delivered (NN-G) relative to empty nanoneedles (NN), nanoneedles loaded with scrambled siRNA (NN-Sc), and empty nanoneedles with GAPDH siRNA delivered from solution (NNCsG). e, Quantification of the in-cell western assay, showing statistically significant silencing of GAPDH expression to <20% of basal level only in cells treated with nanoneedles loaded with GAPDH. Basal level was evaluated for cells grown on empty nanoneedles. ***p<0.001. Error bars represent the s.d. of 3 replicates.
Figure 4
Figure 4. Nanoneedles mediate in vivo
delivery. a, Longitudinal imaging of mice treated with nanoneedles on top of the skin or underneath the skin on the back muscle and loaded with a near-infrared fluorescent dye. The distribution and diffusion of the delivered fluorescent dye was monitored using whole-animal fluorescent imaging for 48 h. b, The delivery and diffusion of the dye was measured at several times following 1-min nanoinjection, and plotted to compare delivery kinetics at the different sites of administration. Error bars represent the s.d. of 3 replicates. c, Near-infrared fluorescent imaging on the skin of mice, comparing the delivery of DyLight 800 using a drop (left), flat Si wafer (middle), or nanoneedles (right). d, Intravital confocal image, showing the delivery pattern of dye-loaded nanoneedles. Scale bar, 1 mm.
Figure 5
Figure 5. Safety profile of nanoinjection
a, Representative longitudinal bioluminescence images of mice with luminol at 5 and 24 h following nanoneedle treatment to the muscle and skin on the ear. Phorbol-12-myristate-13-acetate (PMA) treatment and surgical incisions were employed as positive controls. b, Quantification of the average radiance exposure acquired from mice administered with luminol at 5 and 24 h for surgical incision (black), PMA-treated ears (green), muscles (blue) and skin of ear (red) following treatment with nanoneedles. Data normalized to control represented by the black dashed line. *p<0.05 versus control. Error bars represent the s.d. of 3 replicates. c, H&E and TEM micrographs at the site of nanoinjection for muscle, skin and ear, comparing nanoneedles and control tissues. d, H&E images of muscle sections at 5 h, 5 days and 15 days following nanoinjection compared against wild-type (WT; that is, control) tissues. e, Quantification of individual myofibres for area, diameter and roughness for the times depicted in d. Error bars represent the s.d. of measurements in 34–92 areas (for nN-T: 49, 34 and 92 for 5 h, 5 d and 15 d, respectively; for WT: 60, 90 and 53 for 5 h, 5 d and 15 d, respectively) taken from 3 animals. f,g, TEM micrographs of muscle sections for nanoneedles (f) and control (g) sections, illustrating the impact of nanoinjection on the ultrastructure of tissues at low magnification. Higher-magnification images to the right depict intact myofibrils (top) and mitochondria (bottom). Red lines, A-band; black lines, I-band; black arrows, M-line; red arrows, Z-line; red crosses, transverse tubules; black stars, sarcoplasmic reticulum; red squares (or red arrows in high-magnification images), mitochondria.
Figure 6
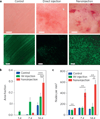
Figure 6. Nanoneedles mediate neovascularization
a, Intravital bright-field (top) and confocal (bottom) microscopy images of the vasculature of untreated (left) and hVEGF-165-treated muscles with either direct injection (centre) or nanoinjection (right). The fluorescence signal originates from systemically injected FITC–dextran. Scale bars, bright-field 100 µm; confocal 50 µm. b,c, Quantification of the fraction of fluorescent signal (dextran) (b) and the number of nodes in the vasculature per mm2 (c) within each field of view acquired for untreated control, intramuscular injection (IM) and nanoinjection. *p=0.05, **p<0.01, ***p<0.001. Error bars represent the s.d. of the averages of 5 areas taken from 3 animals.

Comment in

References

    1. Leader B, Baca QJ, Golan DE. Protein therapeutics: A summary and pharmacological classification. Nature Rev. Drug Discov. 2008;7:21–39. - PubMed
    1. Vlieghe P, Lisowski V, Martinez J, Khrestchatisky M. Synthetic therapeutic peptides: Science and market. Drug Discov. Today. 2010;15:40–56. - PubMed
    1. Kole R, Krainer AR, Altman S. RNA therapeutics: Beyond RNA interference and antisense oligonucleotides. Nature Rev. Drug Discov. 2012;11:125–140. - PMC - PubMed
    1. Khademhosseini A. Microscale technologies for tissue engineering and biology. Proc. Natl Acad. Sci. USA. 2006;103:2480–2487. - PMC - PubMed
    1. Whitehead KA, Langer R, Anderson DG. Knocking down barriers: Advances in siRNA delivery. Nature Rev. Drug Discov. 2009;8:129–138. - PMC - PubMed

Publication types