

Nonlinear Association Between Cerebrospinal Fluid and Florbetapir F-18 β-Amyloid Measures Across the Spectrum of Alzheimer Disease
- PMID: 25822737
- PMCID: PMC5642905
- DOI: 10.1001/jamaneurol.2014.4829
Nonlinear Association Between Cerebrospinal Fluid and Florbetapir F-18 β-Amyloid Measures Across the Spectrum of Alzheimer Disease
Abstract
Importance: Cerebrospinal fluid (CSF) and positron emission tomographic (PET) amyloid biomarkers have been proposed for the detection of Alzheimer disease (AD) pathology in living patients and for the tracking of longitudinal changes, but the relation between biomarkers needs further study.
Objective: To determine the association between CSF and PET amyloid biomarkers (cross-sectional and longitudinal measures) and compare the cutoffs for these measures.
Design, setting, and participants: Longitudinal clinical cohort study from 2005 to 2014 including 820 participants with at least 1 florbetapir F-18 (hereafter referred to as simply florbetapir)-PET scan and at least 1 CSF β-amyloid 1-42 (Aβ1-42) sample obtained within 30 days of each other (501 participants had a second PET scan after 2 years, including 150 participants with CSF Aβ1-42 measurements). Data were obtained from the Alzheimer's Disease Neuroimaging Initiative database.
Main outcomes and measures: Four different PET scans processing pipelines from 2 different laboratories were compared. The PET cutoff values were established using a mixture-modeling approach, and different mathematical models were applied to define the association between CSF and PET amyloid measures.
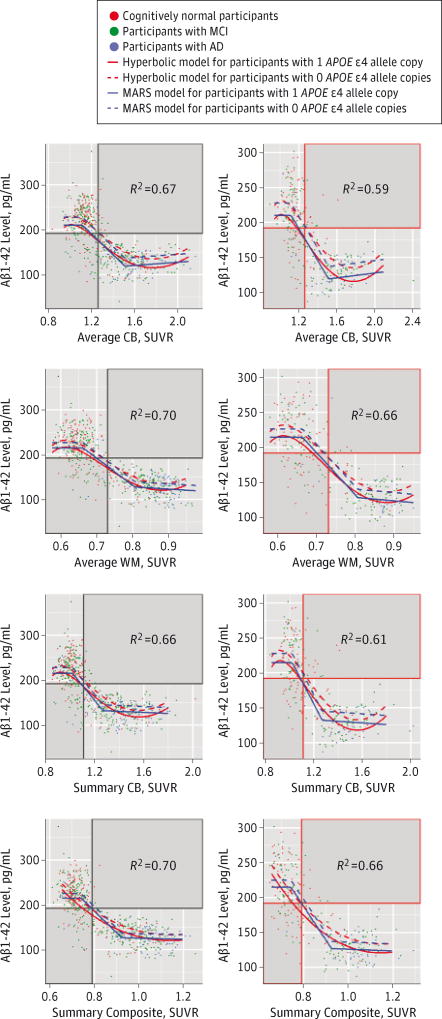
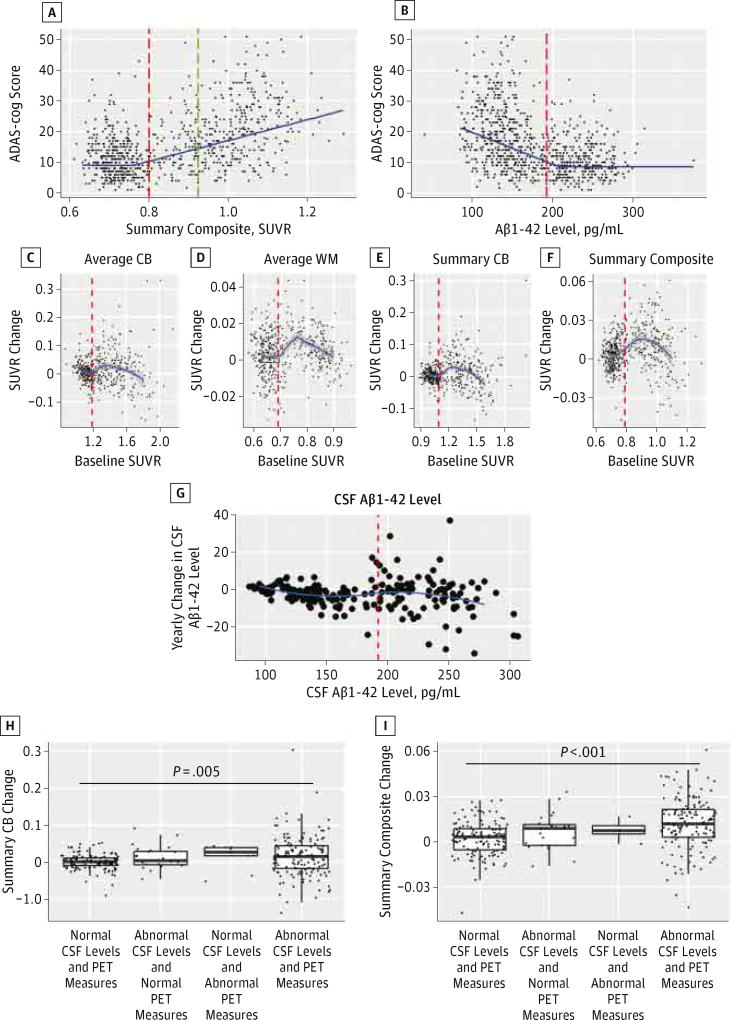
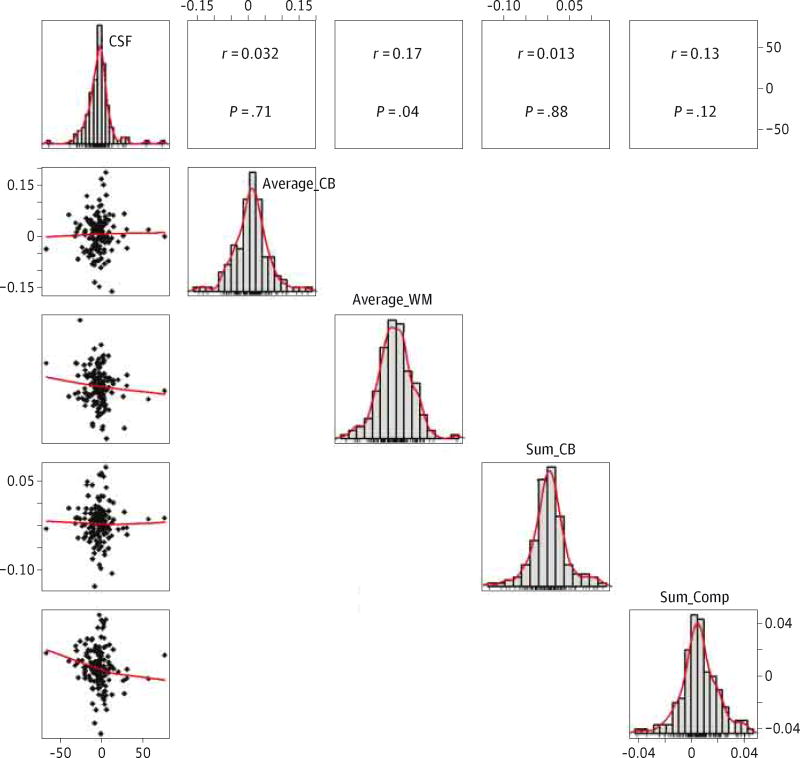
Results: The values of the CSF Aβ1-42 samples and florbetapir-PET scans showed a nonlinear association (R2 = 0.48-0.66), with the strongest association for values in the middle range. The presence of a larger dynamic range of florbetapir-PET scan values in the higher range compared with the CSF Aβ1-42 plateau explained the differences in correlation with cognition (R2 = 0.36 and R2 = 0.25, respectively). The APOE genotype significantly modified the association between both biomarkers. The PET cutoff values derived from an unsupervised classifier converged with previous PET cutoff values and the established CSF Aβ1-42 cutoff levels. There was no association between longitudinal Aβ1-42 levels and standardized uptake value ratios during follow-up.
Conclusions and relevance: The association between both biomarkers is limited to a middle range of values, is modified by the APOE genotype, and is absent for longitudinal changes; 4 different approaches in 2 different platforms converge on similar pathological Aβ cutoff levels; and different pipelines to process PET scans showed correlated but not identical results. Our findings suggest that both biomarkers measure different aspects of AD Aβ pathology.
Conflict of interest statement
Figures
References
Publication types
MeSH terms
Substances
Grants and funding
- P01 AG032953/AG/NIA NIH HHS/United States
- R01 AG041851/AG/NIA NIH HHS/United States
- P30 AG010124/AG/NIA NIH HHS/United States
- U01-AG024904/AG/NIA NIH HHS/United States
- P01 AG017586/AG/NIA NIH HHS/United States
- U01 HL096917/HL/NHLBI NIH HHS/United States
- U01 AG024904/AG/NIA NIH HHS/United States
- R01AG043392/AG/NIA NIH HHS/United States
- P30 AG013846/AG/NIA NIH HHS/United States
- P50 NS053488/NS/NINDS NIH HHS/United States
- R01 AG011378/AG/NIA NIH HHS/United States
- R01 AG037551/AG/NIA NIH HHS/United States
- U01-HL096917/HL/NHLBI NIH HHS/United States
- R01 AG043392/AG/NIA NIH HHS/United States
- R01 AG37551/AG/NIA NIH HHS/United States
- R01-AG011378/AG/NIA NIH HHS/United States
- U01-AG06786/AG/NIA NIH HHS/United States
- U01 AG006786/AG/NIA NIH HHS/United States
LinkOut - more resources
Full Text Sources
Other Literature Sources
Medical
Miscellaneous
