. 2015 Mar 30;11(3):e1004758.
doi: 10.1371/journal.ppat.1004758. eCollection 2015 Mar.

Spatiotemporal analysis of hepatitis C virus infection

Affiliations

Spatiotemporal analysis of hepatitis C virus infection

Ana Shulla et al. PLoS Pathog. .

Abstract

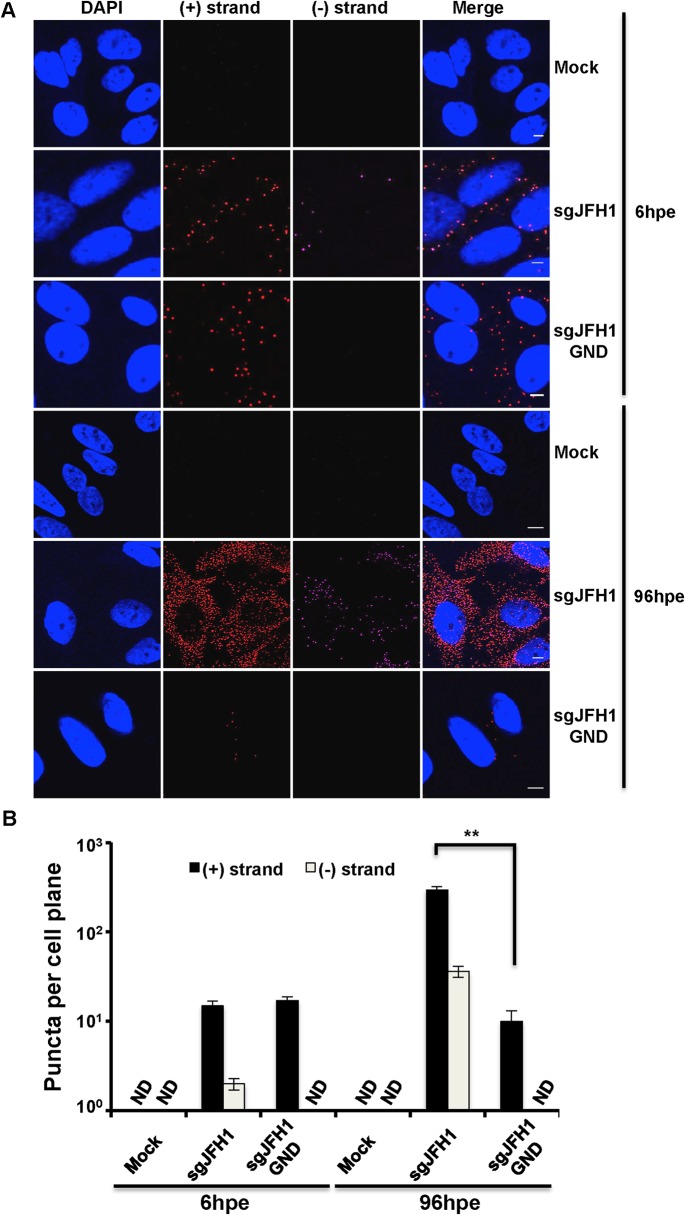
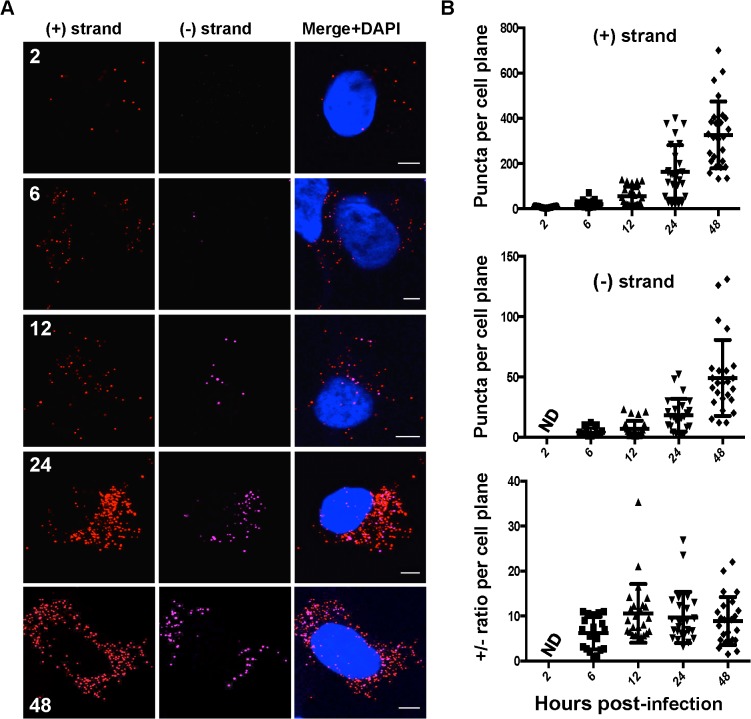
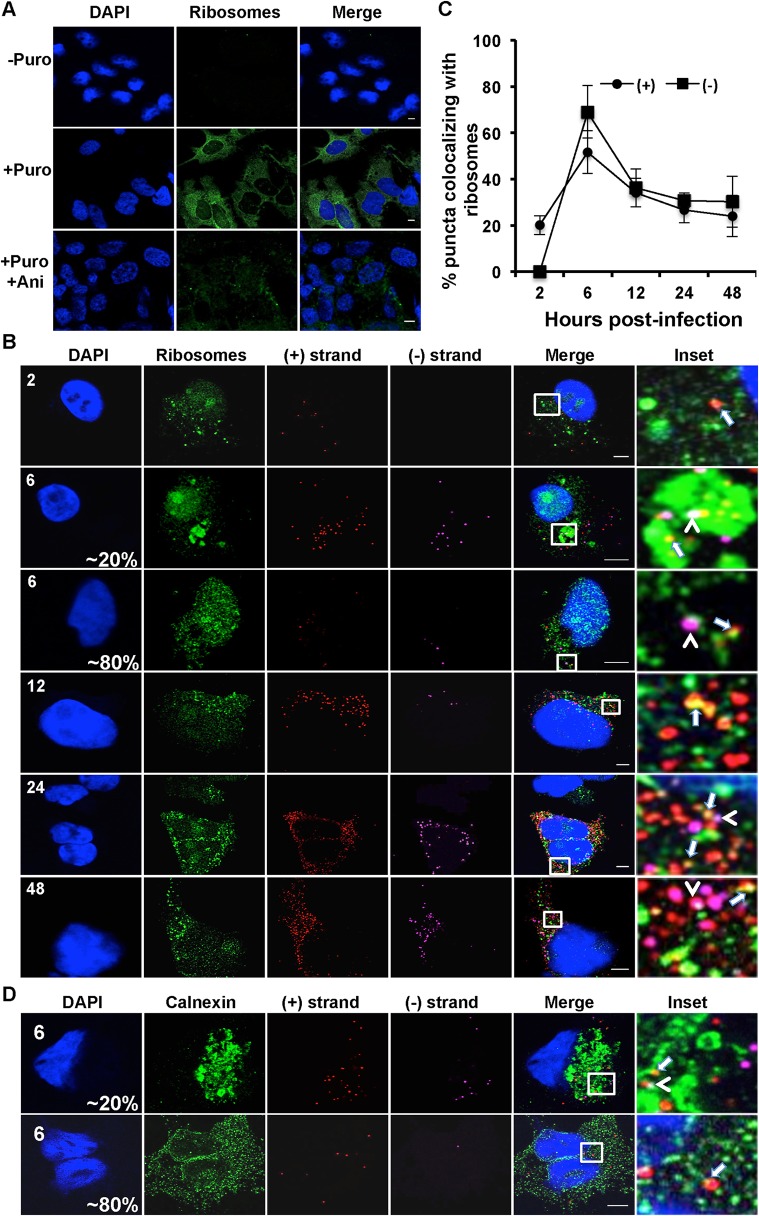
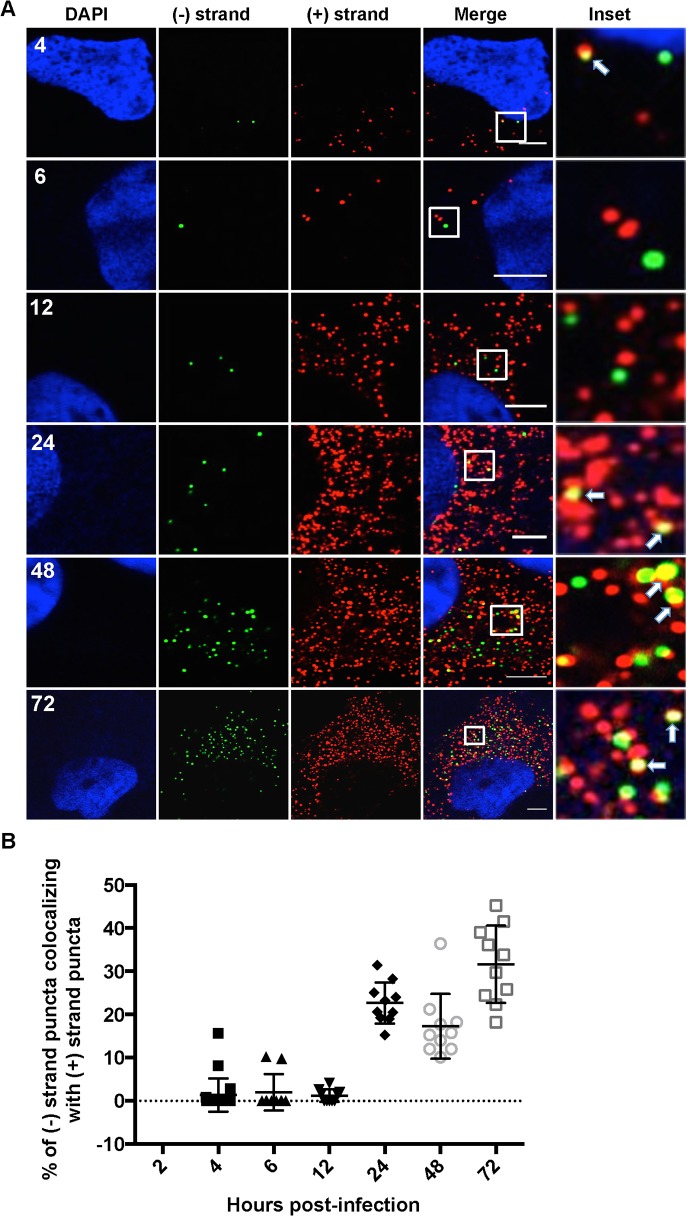
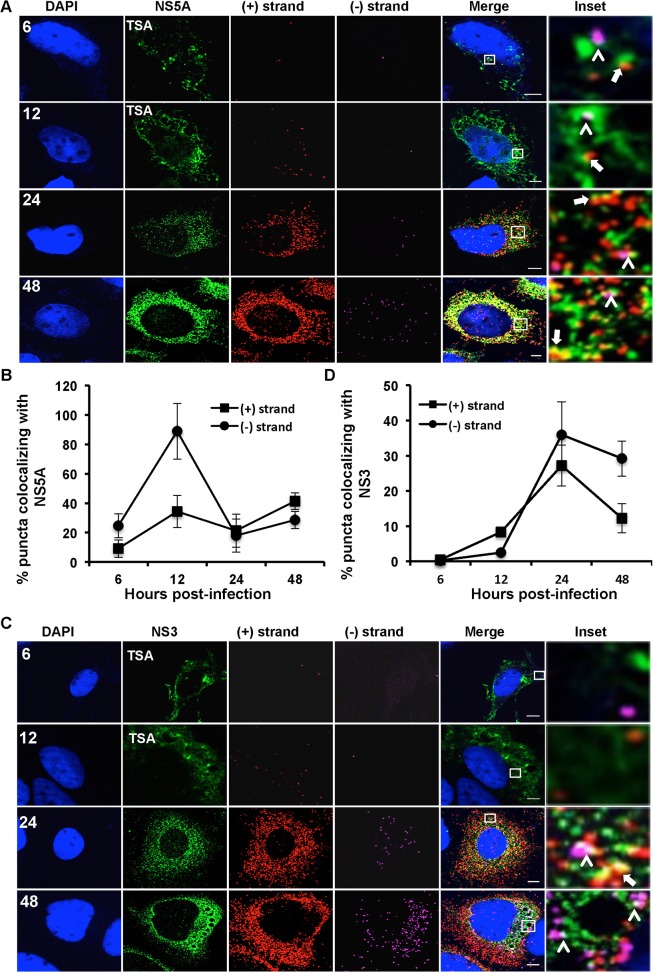
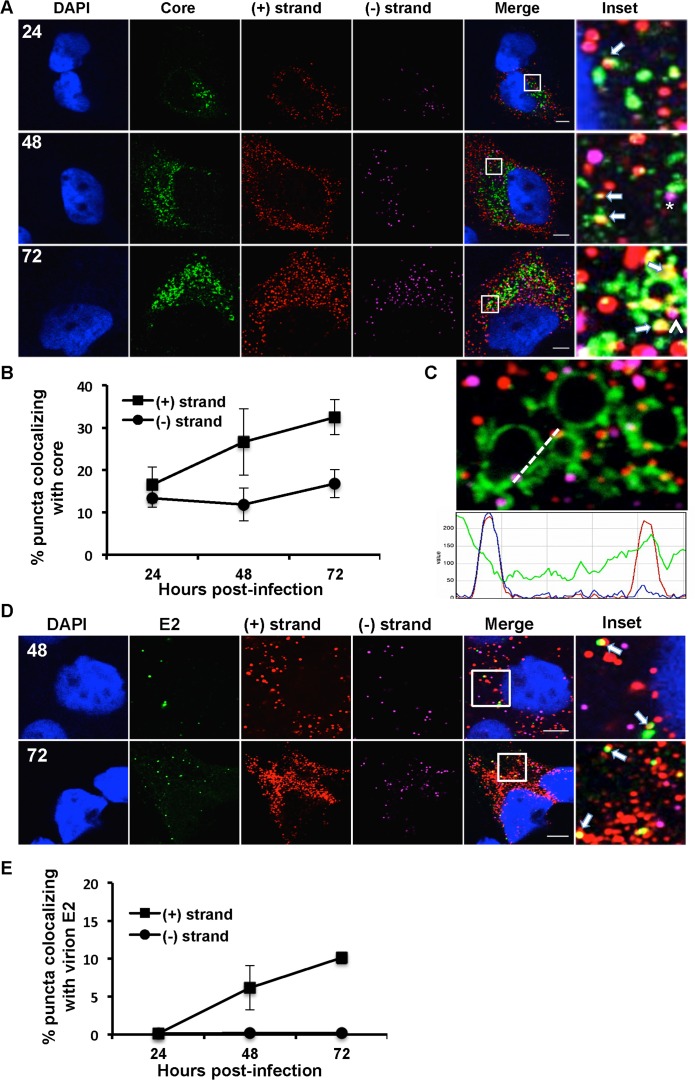
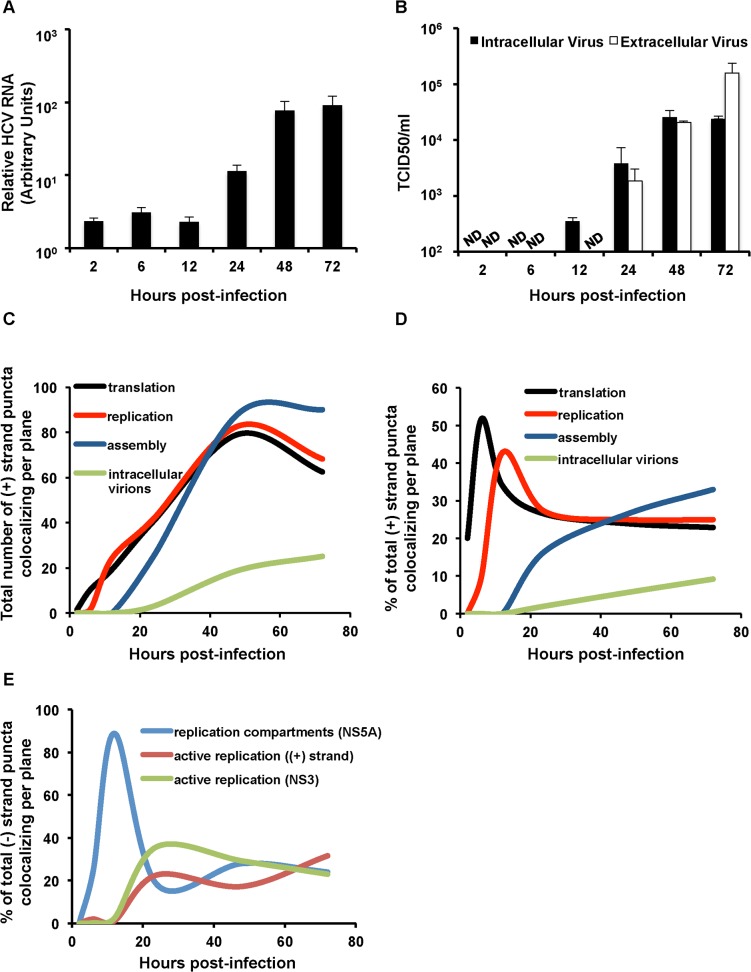
Hepatitis C virus (HCV) entry, translation, replication, and assembly occur with defined kinetics in distinct subcellular compartments. It is unclear how HCV spatially and temporally regulates these events within the host cell to coordinate its infection. We have developed a single molecule RNA detection assay that facilitates the simultaneous visualization of HCV (+) and (-) RNA strands at the single cell level using high-resolution confocal microscopy. We detect (+) strand RNAs as early as 2 hours post-infection and (-) strand RNAs as early as 4 hours post-infection. Single cell levels of (+) and (-) RNA vary considerably with an average (+):(-) RNA ratio of 10 and a range from 1-35. We next developed microscopic assays to identify HCV (+) and (-) RNAs associated with actively translating ribosomes, replication, virion assembly and intracellular virions. (+) RNAs display a defined temporal kinetics, with the majority of (+) RNAs associated with actively translating ribosomes at early times of infection, followed by a shift to replication and then virion assembly. (-) RNAs have a strong colocalization with NS5A, but not NS3, at early time points that correlate with replication compartment formation. At later times, only ~30% of the replication complexes appear to be active at a given time, as defined by (-) strand colocalization with either (+) RNA, NS3, or NS5A. While both (+) and (-) RNAs colocalize with the viral proteins NS3 and NS5A, only the plus strand preferentially colocalizes with the viral envelope E2 protein. These results suggest a defined spatiotemporal regulation of HCV infection with highly varied replication efficiencies at the single cell level. This approach can be applicable to all plus strand RNA viruses and enables unprecedented sensitivity for studying early events in the viral life cycle.


Conflict of interest statement

The authors have declared that no competing interests exist.

Figures

Fig 1
Fig 1. Strand specific HCV RNA detection in fixed cells.
A. Huh-7.5 cells were electroporated with the indicated HCV RNA constructs and cells were fixed and processed for RNA detection at 6 and 96 hours post-electroporation. Scale bar is 5 μm. B. Quantification of images in panel A. Error bars represent standard deviation from 25 different images. ND = not detected. ** p = 0.0008.
Fig 2
Fig 2. Kinetics of HCV RNA accumulation during infection.
A. Huh-7.5 cells were infected with HCV at MOI = 1.5 and at the indicated times post-infection cells were fixed and processed for strand specific RNA detection. Scale bar is 5 μm. B. Individual (+) and (−) strand puncta for each time point were quantified and graphed using Prism software.
Fig 3
Fig 3. Colocalization of (+) and (−) strand HCV RNAs with active translating ribosomes.
A. Huh-7.5 cells were infected with HCV at MOI = 1.5 and at 48 hours post-infection cells were left untreated or pre-treated with anisomycin (Ani) (competitive inhibitor of puromycin; 9.4 uM) followed by puromycin (Puro) labeling and digitonin extraction before fixation. Cells were processed for immunofluorescence using the anti-puromycin PMY-2A4 monoclonal antibody. Scale bar is 5 μm. B. Huh-7.5 cells were infected with HCV at MOI = 1.5 and at the indicated times post-infection the cells were fixed and processed for strand specific RNA detection followed by immunofluorescence staining for puromycylated ribosomes. Scale bar is 5 μm. Insets represent 10 times magnification of the merged image. Solid arrows point to (+) strand RNA colocalizing with ribosomes; arrowheads point to (−) strand RNA colocalizing with ribosomes. C. Quantitation of % colocalization in (B). Each error bar indicates standard deviation from 25 different images. D. Huh-7.5 cells were infected with HCV at MOI = 1.5 and at 6 hpi the cells were fixed and processed for strand specific RNA detection followed by immunofluorescence staining for calnexin.
Fig 4
Fig 4. Colocalization of (−) and (+) HCV RNA strands.
A. Huh-7.5 cells were infected with HCV at MOI = 1.5 and at the indicated times post infection cells were fixed and processed for strand specific RNA detection. Scale bar is 5 μm. Solid arrows point to (+) strand RNA colocalizing with (−) strand RNA. B. Quantitation of % colocalization in (A).
Fig 5
Fig 5. Colocalization of (+) and (−) strand HCV RNAs with NS5A and NS3.
Huh-7.5 cells were infected with HCV at MOI = 1.5 and at the indicated times post-infection the cells were fixed and processed for strand specific RNA detection followed by immunofluorescence staining for A. NS5A or C. NS3. For 6 and 12 hpi samples, antibody signal was amplified using the tyramide signal amplification kit (TSA) as described in the materials and methods section. Scale bar is 5 μm. B. Quantitation of (A) D. Quantitation of (C). Each error bar indicates standard deviation from 25 different images. Scale bar is 5 μm. Insets represent 10 times magnification of the merged image. Solid arrows point to (+) strand RNA colocalizing with NS5A and NS3; arrowheads point to (−) strand RNA colocalizing with NS5A and NS3.
Fig 6
Fig 6. Colocalization of (+) and (−) strand HCV RNAs with core protein and virion E2.
A. Huh-7.5 cells were infected with HCV at MOI = 1.5, fixed at the indicated times post-infection and processed for strand specific RNA detection followed by immunofluorescence staining for core. Scale bar is 5 um. Solid arrows indicate (+) strand (red) colocalization; arrowheads indicate (−) strand (magenta) colocalization with core (green). Insets represent 10 times magnification of the merged image. The asterisk indicates juxtaposition of (−) strand with core. B. Quantification of images in panel A. C. A merged image of core colocalization with (+) and (−) HCV RNAs at 48 hpi is shown together with an ImageJ color intensity plot for the white line drawn in the merged image. D, E. Huh-7.5 cells were infected with HCV at MOI = 1.5 and at 48 and 72 hpi the cells were fixed and processed for strand specific RNA detection followed by immunofluorescence staining for E2 protein using CBH-5 antibody and quantified. Insets represent 10 times magnification of the merged image.
Fig 7
Fig 7. Kinetic analysis of genomic RNA fate.
A. Huh-7.5 cells were infected with HCV at MOI = 1.5. RNA was collected at the indicated time points post-infection and quantified with real-time RT-PCR. Error bar, standard deviation. B. Intra- and extra-cellular viral supernatants from infections in panel A were collected at the indicated time points and titered by limiting dilution assay. Shown are the averages of two sets of titer data. Error bar, standard deviation. C. Total (+) puncta or D. Percent of (+) strand puncta colocalizing with translation (puromycylated ribosomes), replication (NS5A + NS3), assembly (core) and virion (E2) markers over the indicated time course (Figs. 3–6) were plotted using the smooth graph function in Microsoft Excel. E. Percent of (−) strand puncta colocalizing with active replication compartments (NS5A), active replication ((+) strands) and active replication (NS3) over the indicated time course plotted using the smooth graph function in Microsoft Excel.

References

    1. Choo QL, Richman KH, Han JH, Berger K, Lee C, et al. (1991) Genetic organization and diversity of the hepatitis C virus. Proc Natl Acad Sci U S A 88: 2451–2455. - PMC - PubMed
    1. Grakoui A, Wychowski C, Lin C, Feinstone SM, Rice CM (1993) Expression and identification of hepatitis C virus polyprotein cleavage products. J Virol 67: 1385–1395. - PMC - PubMed
    1. Lohmann V, Korner F, Koch J, Herian U, Theilmann L, et al. (1999) Replication of subgenomic hepatitis C virus RNAs in a hepatoma cell line. Science 285: 110–113. - PubMed
    1. Blight KJ, Kolykhalov AA, Rice CM (2000) Efficient initiation of HCV RNA replication in cell culture. Science 290: 1972–1974. - PubMed
    1. Egger D, Wolk B, Gosert R, Bianchi L, Blum HE, et al. (2002) Expression of hepatitis C virus proteins induces distinct membrane alterations including a candidate viral replication complex. J Virol 76: 5974–5984. - PMC - PubMed

Publication types

Substances