

Correlative in-resin super-resolution and electron microscopy using standard fluorescent proteins
- PMID: 25823571
- PMCID: PMC4379466
- DOI: 10.1038/srep09583
Correlative in-resin super-resolution and electron microscopy using standard fluorescent proteins
Erratum in
-
Corrigendum: Correlative in-resin super-resolution and electron microscopy using standard fluorescent proteins.Sci Rep. 2016 Mar 8;6:22681. doi: 10.1038/srep22681. Sci Rep. 2016. PMID: 26951786 Free PMC article. No abstract available.
Abstract
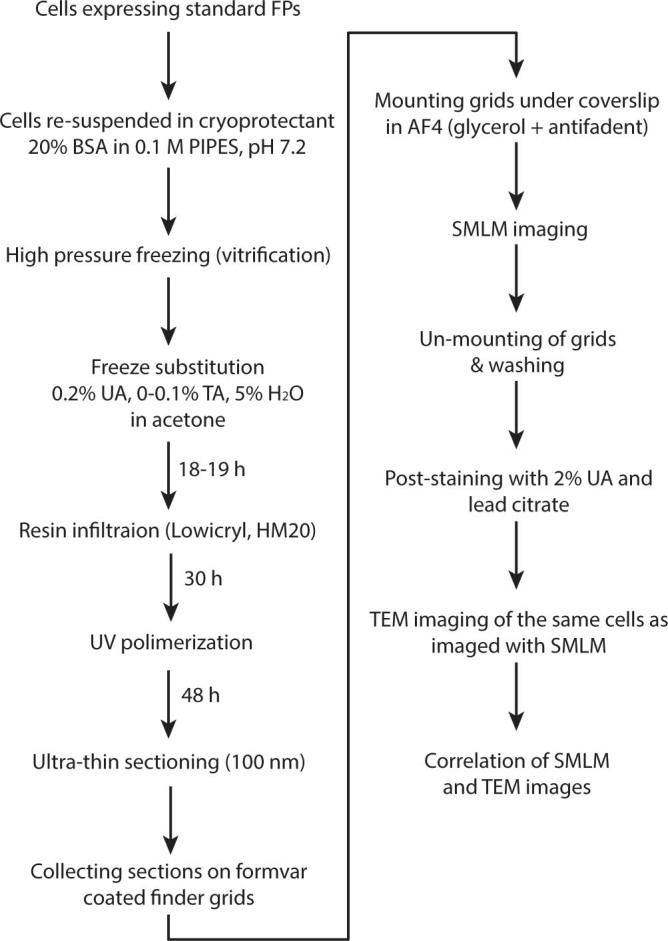
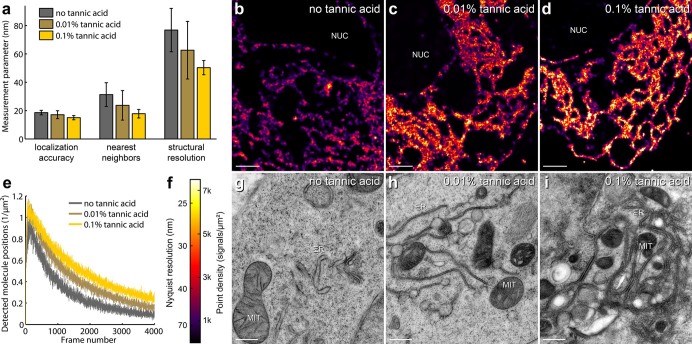
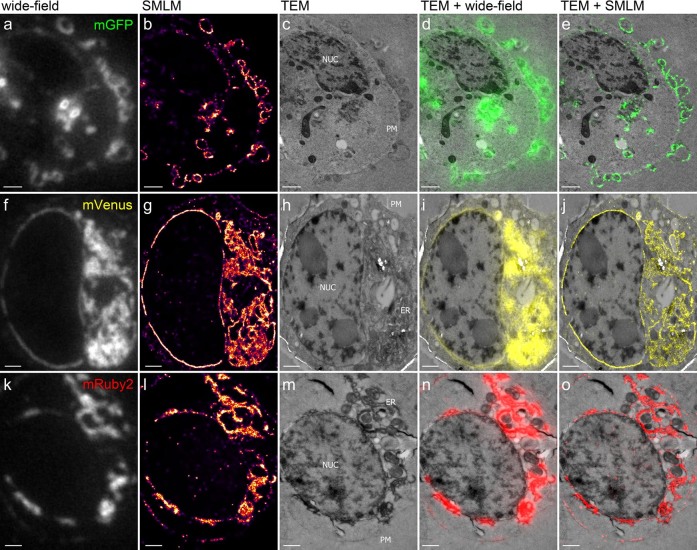
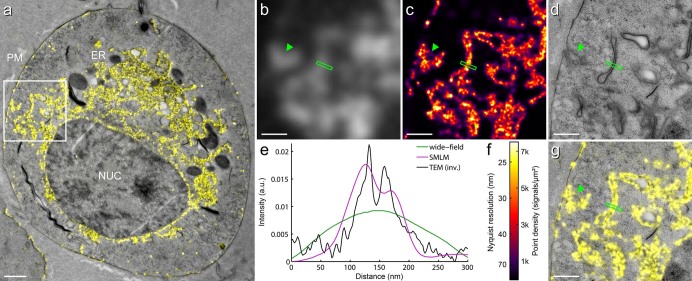
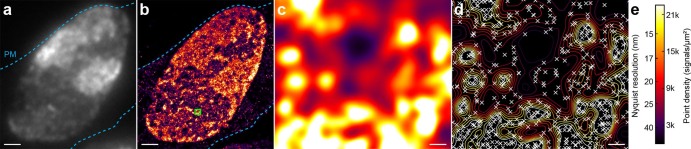
We introduce a method for correlative in-resin super-resolution fluorescence and electron microscopy (EM) of biological structures in mammalian culture cells. Cryo-fixed resin embedded samples offer superior structural preservation, performing in-resin super-resolution, however, remains a challenge. We identified key aspects of the sample preparation procedure of high pressure freezing, freeze substitution and resin embedding that are critical for preserving fluorescence and photo-switching of standard fluorescent proteins, such as mGFP, mVenus and mRuby2. This enabled us to combine single molecule localization microscopy with transmission electron microscopy imaging of standard fluorescent proteins in cryo-fixed resin embedded cells. We achieved a structural resolution of 40-50 nm (~17 nm average single molecule localization accuracy) in the fluorescence images without the use of chemical fixation or special fluorophores. Using this approach enabled the correlation of fluorescently labeled structures to the ultrastructure in the same cell at the nanometer level and superior structural preservation.
Figures
Similar articles
-
Preserving the photoswitching ability of standard fluorescent proteins for correlative in-resin super-resolution and electron microscopy.Methods Cell Biol. 2017;140:49-67. doi: 10.1016/bs.mcb.2017.04.001. Epub 2017 May 5. Methods Cell Biol. 2017. PMID: 28528641
-
Correlative In-Resin Super-Resolution Fluorescence and Electron Microscopy of Cultured Cells.Methods Mol Biol. 2017;1663:163-177. doi: 10.1007/978-1-4939-7265-4_14. Methods Mol Biol. 2017. PMID: 28924667
-
A Global Approach for Quantitative Super Resolution and Electron Microscopy on Cryo and Epoxy Sections Using Self-labeling Protein Tags.Sci Rep. 2017 Feb 2;7(1):23. doi: 10.1038/s41598-017-00033-x. Sci Rep. 2017. PMID: 28154417 Free PMC article.
-
One for All, All for One: A Close Look at In-Resin Fluorescence Protocols for CLEM.Front Cell Dev Biol. 2022 Jun 30;10:866472. doi: 10.3389/fcell.2022.866472. eCollection 2022. Front Cell Dev Biol. 2022. PMID: 35846358 Free PMC article. Review.
-
Correlative microscopy.Arch Biochem Biophys. 2015 Sep 1;581:98-110. doi: 10.1016/j.abb.2015.05.017. Epub 2015 Jun 10. Arch Biochem Biophys. 2015. PMID: 26072116 Review.
Cited by
-
Correlative cryo super-resolution light and electron microscopy on mammalian cells using fluorescent proteins.Sci Rep. 2019 Feb 4;9(1):1369. doi: 10.1038/s41598-018-37728-8. Sci Rep. 2019. PMID: 30718653 Free PMC article.
-
Imaging cellular structures in super-resolution with SIM, STED and Localisation Microscopy: A practical comparison.Sci Rep. 2016 Jun 6;6:27290. doi: 10.1038/srep27290. Sci Rep. 2016. PMID: 27264341 Free PMC article.
-
Inducing fluorescence of uranyl acetate as a dual-purpose contrast agent for correlative light-electron microscopy with nanometre precision.Sci Rep. 2017 Sep 5;7(1):10442. doi: 10.1038/s41598-017-10905-x. Sci Rep. 2017. PMID: 28874723 Free PMC article.
-
Deep learning-based subdivision approach for large scale macromolecules structure recovery from electron cryo tomograms.Bioinformatics. 2017 Jul 15;33(14):i13-i22. doi: 10.1093/bioinformatics/btx230. Bioinformatics. 2017. PMID: 28881965 Free PMC article.
-
Meisosomes, folded membrane microdomains between the apical extracellular matrix and epidermis.Elife. 2023 Mar 13;12:e75906. doi: 10.7554/eLife.75906. Elife. 2023. PMID: 36913486 Free PMC article.
References
-
- Sjollema K. A., Schnell U., Kuipers J., Kalicharan R. & Giepmans B. N. Correlated Light Microscopy and Electron Microscopy. Method. Cell Biol. 111, 157 (2012). - PubMed
-
- Hell S. W. & Wichmann J. Breaking the Diffraction Resolution Limit by Stimulated-Emission - Stimulated-Emission-Depletion Fluorescence Microscopy. Opt. Lett. 19, 780–782 (1994). - PubMed
-
- Heintzmann R. & Cremer C. Laterally modulated excitation microscopy: Improvement of resolution by using a diffraction grating. Proc. SPIE 3568, 185–196 (1999).
-
- Gustafsson M. G. L. Surpassing the lateral resolution limit by a factor of two using structured illumination microscopy. J. Microsc. 198, 82–87 (2000). - PubMed
-
- Betzig E. et al. Imaging intracellular fluorescent proteins at nanometer resolution. Science 313, 1642–1645 (2006). - PubMed
Publication types
MeSH terms
Substances
Grants and funding
LinkOut - more resources
Full Text Sources
Other Literature Sources
