

Hypomethylation and up-regulation of PD-1 in T cells by azacytidine in MDS/AML patients: A rationale for combined targeting of PD-1 and DNA methylation
- PMID: 25823822
- PMCID: PMC4496243
- DOI: 10.18632/oncotarget.3324
Hypomethylation and up-regulation of PD-1 in T cells by azacytidine in MDS/AML patients: A rationale for combined targeting of PD-1 and DNA methylation
Abstract
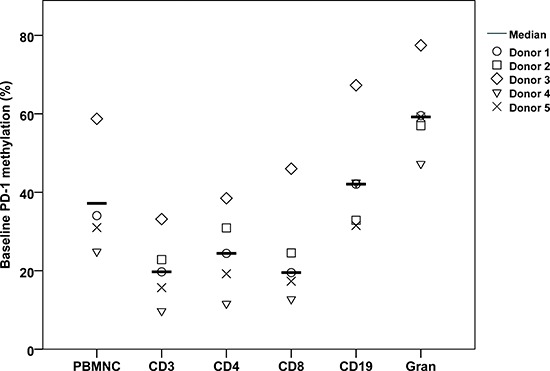
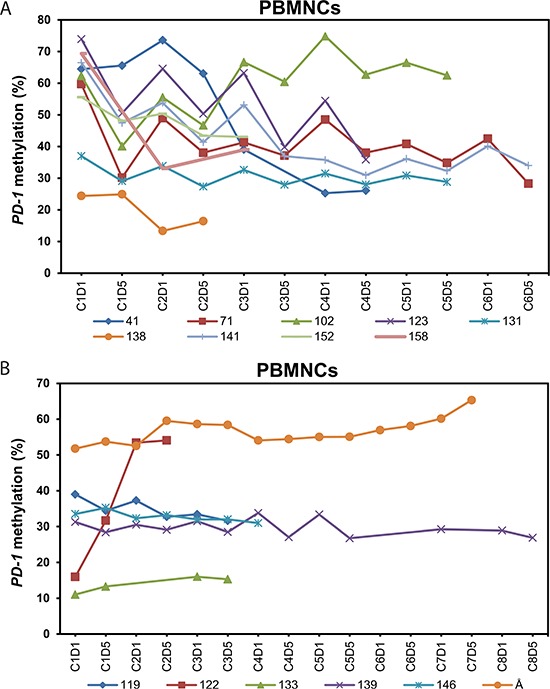
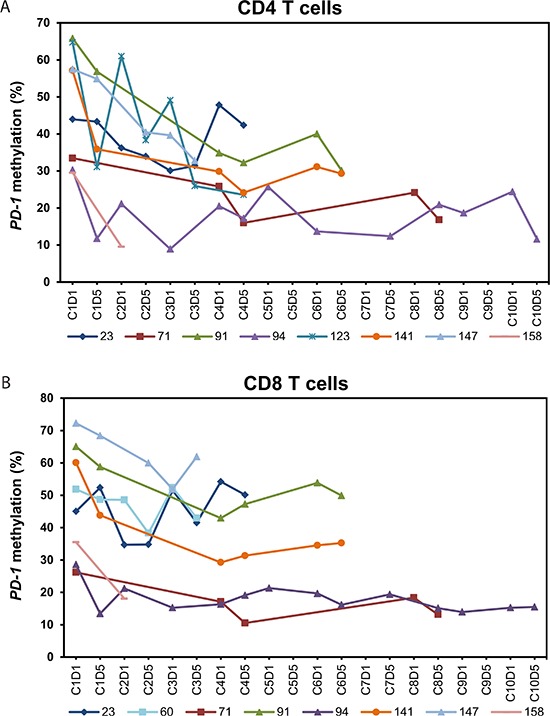
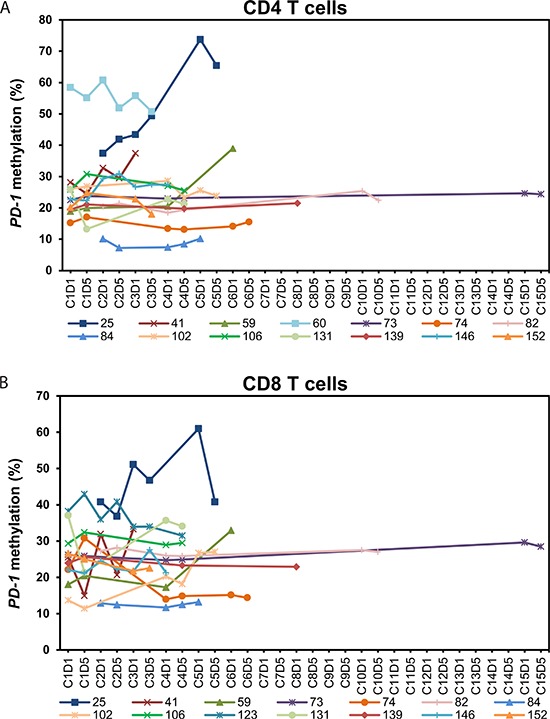
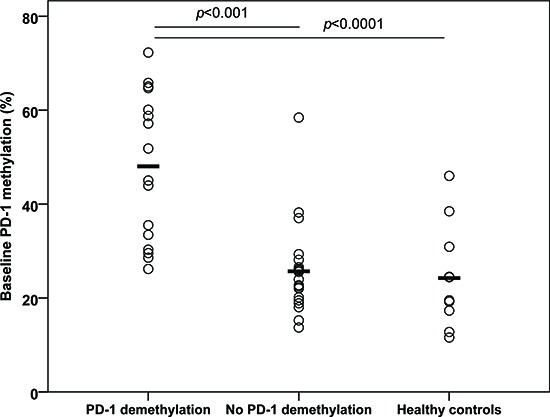
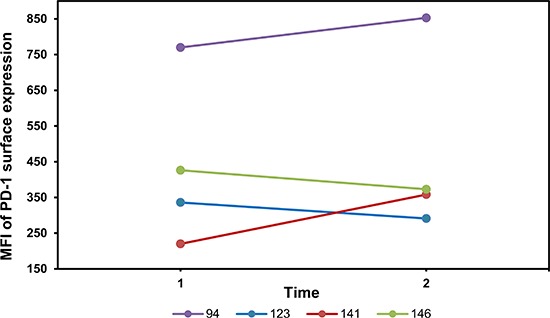
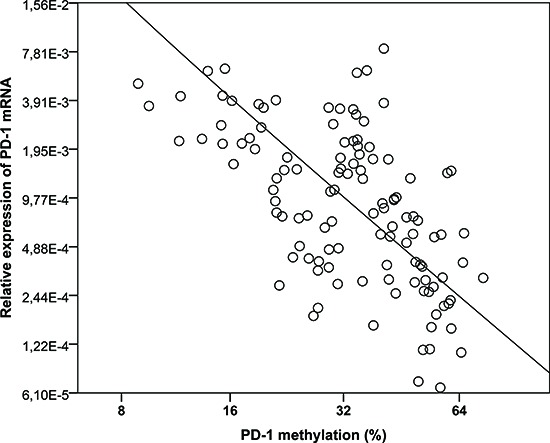
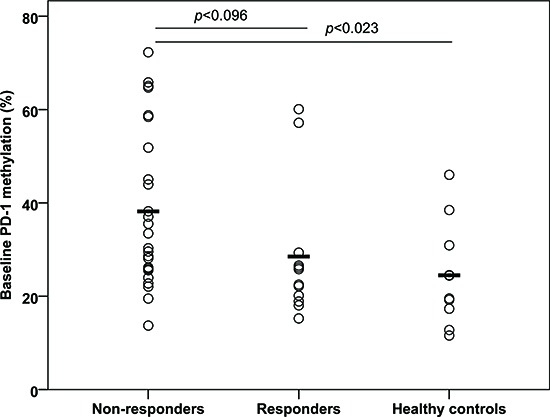
The hypomethylating agents (HMAs) are standard therapy for patients with higher-risk myelodysplastic syndrome (MDS); however, the majority of the patients will lose their response to HMAs over time due to unknown mechanisms. It has recently been shown that T cell expression of the immunoinhibitory receptor PD-1 is regulated by DNA methylation. In 12 of 27 patients (44%) PD-1 promoter demethylation was observed in sorted peripheral blood T cells isolated over consecutive cycles of treatment with 5-azacytidine (5-aza). The PD-1 promoter demethylation correlated with an increase in PD-1 expression. Moreover, demethylation of the PD-1 promoter correlated with a significantly worse overall response rate (8% vs. 60%, p = 0.014), and a trend towards a shorter overall survival (p = 0.11) was observed. A significantly higher baseline methylation level of the PD-1 promoter was observed in T cells of non-responding patients compared to healthy controls (p = 0.023). Accordingly, in addition to their beneficial function, HMAs induce PD-1 expression on T cells in the MDS microenvironment, thereby likely hampering the immune response against the MDS blasts. Thus, we suggest that activation of the PD-1 checkpoint during HMA treatment can be a possible resistance mechanism, which may be overcome by combination therapy with a PD-1 pathway inhibitor.
Keywords: DNA methylation; T cells; hypomethylating agents; myelodysplastic syndromes; programmed death-1.
Conflict of interest statement
The authors declare no competing financial interests.
Figures
Similar articles
-
Expression of PD-L1, PD-L2, PD-1 and CTLA4 in myelodysplastic syndromes is enhanced by treatment with hypomethylating agents.Leukemia. 2014 Jun;28(6):1280-8. doi: 10.1038/leu.2013.355. Epub 2013 Nov 25. Leukemia. 2014. PMID: 24270737 Free PMC article.
-
DNA demethylation in PD-1 gene promoter induced by 5-azacytidine activates PD-1 expression on Molt-4 cells.Cell Immunol. 2011;271(2):450-4. doi: 10.1016/j.cellimm.2011.08.014. Epub 2011 Aug 23. Cell Immunol. 2011. PMID: 21907333
-
Digging deep into "dirty" drugs - modulation of the methylation machinery.Drug Metab Rev. 2015 May;47(2):252-79. doi: 10.3109/03602532.2014.995379. Epub 2015 Jan 8. Drug Metab Rev. 2015. PMID: 25566693 Free PMC article. Review.
-
[Effect of methylation inhibitor on demethylation pattern of the PD-1 gene in promoter region and PD-1 expression in human T lymphocyte cell line].Zhong Nan Da Xue Xue Bao Yi Xue Ban. 2011 Dec;36(12):1163-9. doi: 10.3969/j.issn.1672-7347.2011.12.007. Zhong Nan Da Xue Xue Bao Yi Xue Ban. 2011. PMID: 22246361 Chinese.
-
Clinical update on hypomethylating agents.Int J Hematol. 2019 Aug;110(2):161-169. doi: 10.1007/s12185-019-02651-9. Epub 2019 Apr 24. Int J Hematol. 2019. PMID: 31020568 Review.
Cited by
-
Hypomethylating agents (HMA) for the treatment of acute myeloid leukemia and myelodysplastic syndromes: mechanisms of resistance and novel HMA-based therapies.Leukemia. 2021 Jul;35(7):1873-1889. doi: 10.1038/s41375-021-01218-0. Epub 2021 May 6. Leukemia. 2021. PMID: 33958699 Free PMC article. Review.
-
Deciphering DNA Methylation in HIV Infection.Front Immunol. 2021 Dec 2;12:795121. doi: 10.3389/fimmu.2021.795121. eCollection 2021. Front Immunol. 2021. PMID: 34925380 Free PMC article. Review.
-
A randomized phase 2 trial of azacitidine with or without durvalumab as first-line therapy for older patients with AML.Blood Adv. 2022 Apr 12;6(7):2219-2229. doi: 10.1182/bloodadvances.2021006138. Blood Adv. 2022. PMID: 34933333 Free PMC article. Clinical Trial.
-
Efficacy of azacitidine is independent of molecular and clinical characteristics - an analysis of 128 patients with myelodysplastic syndromes or acute myeloid leukemia and a review of the literature.Oncotarget. 2018 Jun 12;9(45):27882-27894. doi: 10.18632/oncotarget.25328. eCollection 2018 Jun 12. Oncotarget. 2018. PMID: 29963245 Free PMC article. Review.
-
Treatment of Low-Blast Count AML using Hypomethylating Agents.Mediterr J Hematol Infect Dis. 2017 Jul 1;9(1):e2017045. doi: 10.4084/MJHID.2017.045. eCollection 2017. Mediterr J Hematol Infect Dis. 2017. PMID: 28698788 Free PMC article. Review.
References
-
- Tefferi A, Vardiman JW. Myelodysplastic syndromes. N. Engl. J. Med. 2009;361:1872–85. - PubMed
-
- Fenaux P, Mufti GJ, Hellstrom-Lindberg E, Santini V, Finelli C, Giagounidis A, Schoch R, Gattermann N, Sanz G, List A, Gore SD, Seymour JF, Bennett JM, et al. Efficacy of azacitidine compared with that of conventional care regimens in the treatment of higher-risk myelodysplastic syndromes: a randomised, open-label, phase III study. Lancet Oncol. 2009;10:223–32. - PMC - PubMed
-
- Kantarjian H, Issa J-PJ, Rosenfeld CS, Bennett JM, Albitar M, DiPersio J, Klimek V, Slack J, de Castro C, Ravandi F, Helmer R, Shen L, Nimer SD, et al. Decitabine improves patient outcomes in myelodysplastic syndromes: results of a phase III randomized study. Cancer. 2006;106:1794–803. - PubMed
-
- Lübbert M, Suciu S, Baila L, Rüter BH, Platzbecker U, Giagounidis A, Selleslag D, Labar B, Germing U, Salih HR, Beeldens F, Muus P, Pflüger K-H, et al. Low-dose decitabine versus best supportive care in elderly patients with intermediate- or high-risk myelodysplastic syndrome (MDS) ineligible for intensive chemotherapy: final results of the randomized phase III study of the European Organisation for Rese. J. Clin. Oncol. 2011;29:1987–96. - PubMed
-
- Fenaux P, Mufti GJ, Hellström-Lindberg E, Santini V, Gattermann N, Germing U, Sanz G, List AF, Gore S, Seymour JF, Dombret H, Backstrom J, Zimmerman L, et al. Azacitidine prolongs overall survival compared with conventional care regimens in elderly patients with low bone marrow blast count acute myeloid leukemia. J. Clin. Oncol. 2010;28:562–9. - PubMed
Publication types
MeSH terms
Substances
LinkOut - more resources
Full Text Sources
Other Literature Sources
Medical
Research Materials
Miscellaneous
