. 2015 May 19;370(1668):20140165.
doi: 10.1098/rstb.2014.0165.

Dwelling quietly in the rich club: brain network determinants of slow cortical fluctuations

Affiliations

Dwelling quietly in the rich club: brain network determinants of slow cortical fluctuations

Leonardo L Gollo et al. Philos Trans R Soc Lond B Biol Sci. .

Abstract

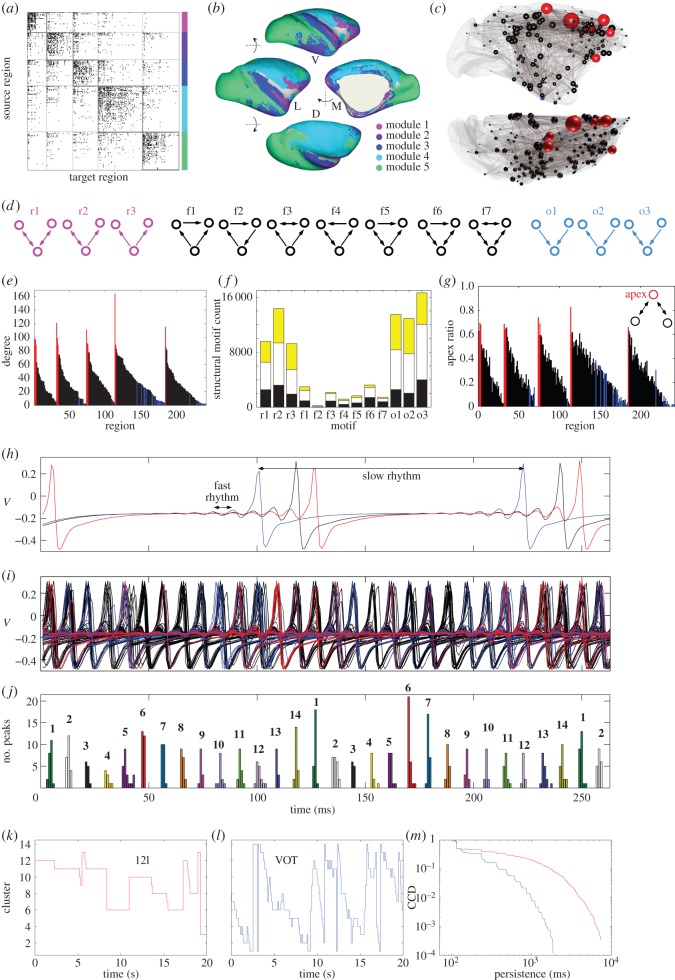
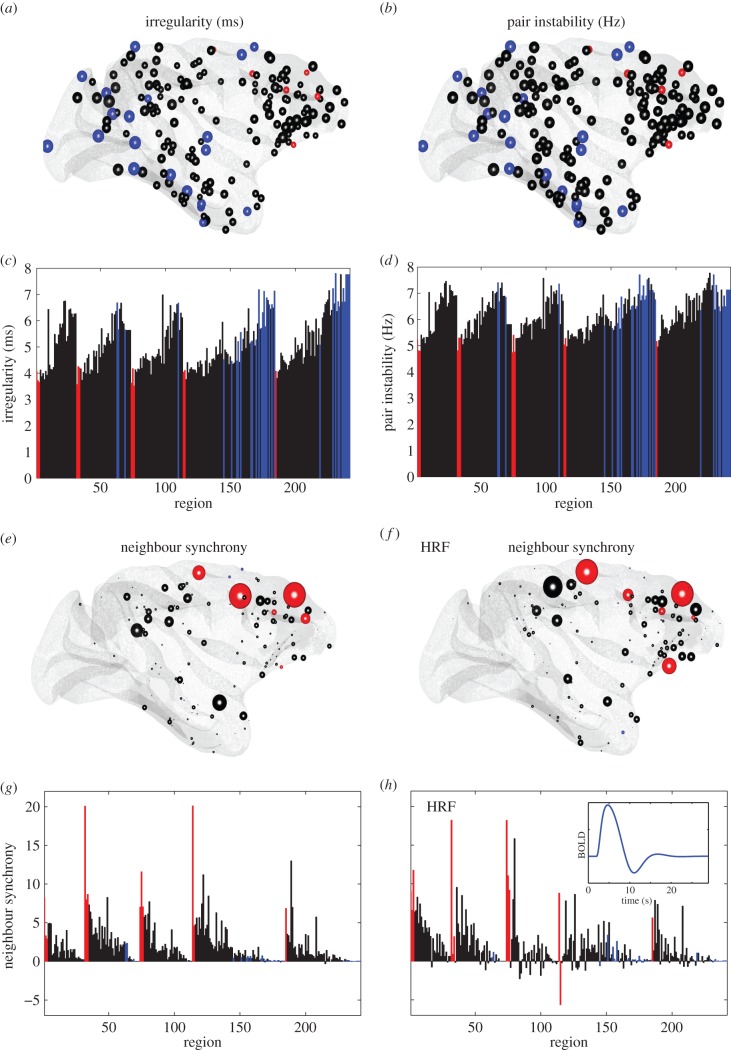
For more than a century, cerebral cartography has been driven by investigations of structural and morphological properties of the brain across spatial scales and the temporal/functional phenomena that emerge from these underlying features. The next era of brain mapping will be driven by studies that consider both of these components of brain organization simultaneously--elucidating their interactions and dependencies. Using this guiding principle, we explored the origin of slowly fluctuating patterns of synchronization within the topological core of brain regions known as the rich club, implicated in the regulation of mood and introspection. We find that a constellation of densely interconnected regions that constitute the rich club (including the anterior insula, amygdala and precuneus) play a central role in promoting a stable, dynamical core of spontaneous activity in the primate cortex. The slow timescales are well matched to the regulation of internal visceral states, corresponding to the somatic correlates of mood and anxiety. In contrast, the topology of the surrounding 'feeder' cortical regions shows unstable, rapidly fluctuating dynamics likely to be crucial for fast perceptual processes. We discuss these findings in relation to psychiatric disorders and the future of connectomics.

Keywords: brain dynamics; chronoarchitecture; connectome; core-periphery axis; metastability; prefrontal hierarchy.


Figures

Figure 1.
Figure 1.
Time series and power spectra of nested time-scales hierarchy in an ensemble of coupled nonlinear oscillators. Each system has a unique colour. (a) Time series from slow (top) to fast (bottom). (b) Corresponding power spectra from fast (right) to slow (left). The fundamental and harmonic frequencies of the slow systems (left-hand side of the spectra) overlap the harmonics and subharmonics of the faster, driving systems. Arrows show natural (uncoupled) frequencies of each system. Note that the intrinsic timescales are uniformly positioned along the logarithmic axis. Adapted from fig. 1 of Fujimoto et al. [49]. (Online version in colour.)
Figure 2.
Figure 2.
Structure and dynamics of simulated model. (a) Binary connectivity matrix with 242 regions, 4090 directed connections. (b) Inflated right hemisphere of macaque brain; (a,b) adapted from Harriger et al. [59] and show that the network decomposes into five modules. (c) Anatomical representation of the network, with nodes colour-coded by club membership (red = rich club (R); black = feeders (F); blue = periphery (P)) and degree denoted by size. (d) Collection of all three-node motifs. The 13 motifs are divided into three families: resonant (r1, r2, r3); frustrated (f1–f7) and other (o1, o2, o3). (e) Degree of nodes, ordered into their modules and colour-coded according to (c). (f) Structural motif count; black bars represent proportion of motifs with only intracluster connections, yellow bars motifs with only intercluster connections, and white bars motifs with both types of connections. (g) Proportion of counts in which each node occupies the apex position of three-node motifs, including all types of motifs. Rich-club members are shown in red. (h) Illustrative time traces of three neural mass models showing two oscillatory rhythms. (i) Time traces corresponding to all nodes. (j) Functional clusters; the set of phase-locked regions are divided into 14 independent clusters based on the co-occurrence of their slow rhythm peaks (the time series of i and h are temporally aligned). Exemplar functional cluster dynamics for 12 l, a rich-club region (k), and for VOT, a peripheral region (l). (m) Complementary cumulative distribution of 12 l (red) and VOT (blue). Electronic supplementary material, figure S1 shows a graphical representation of the core (rich)–feeder–periphery structure of the connectome with colours showing average cluster switching rate. Electronic supplementary material, movie S1 shows the switching dynamics. (Online version in colour.)
Figure 3.
Figure 3.
Dynamical core. Irregularity of IPI; (a) representative network (of figure 1c) and (c) bar plot. (b,d) Average number of changes in phase relation per second for all pairs that each node participates in. Average synchronization between pairs of neighbours of three-node motifs for the membrane potential of the excitatory subpopulation V (e) and (g). Results represent an average over 20 trials of 90 seconds. (f,h) Same as (e,g) but for the haemodynamic response function (inset) in a long trial of 600 s. (Online version in colour.)
Figure 4.
Figure 4.
Role of topology in dynamic timescales. (a) Coefficient of variation of the irregularity and (b) irregularity for the CoCoMac, degree-preserving random (DPR) network, random network, random network with homogeneous in-degree (open circle), and each of these networks randomized to eliminate all bidirectional connections (black symbols next to each network). (c) Same as (b) but with no time delays. (d) Normalized average number of changes in phase relation (top) and normalized sum of in-degree for each pair of nodes (bottom). (e) Number of changes in phase relation per second versus sum in-degree. Colours depict representation of the proportion of shared input. Inset: average proportion of shared input for the different type of node pairs for the CoCoMac and the DPR network. (f) Average number of changes in phase relation (white), difference between disconnected and connected pairs (green), and difference between pairs of different clusters and of same cluster (purple). (g) Average number of changes in phase relation for unidirectionally connected pairs from the second to the first (blue) and from the first to the second (yellow) type of nodes. (Online version in colour.)
Figure 5.
Figure 5.
Role of network motifs in catalysing local synchronization. Proportion of counts in which each motif (a) and each family of motifs (b) contributes to the total number of apex counts for rich (red), feeders (black) and peripheral nodes (blue). Average neighbour synchronization per motifs (c) and per family of motifs (d) for the cases of no-delayed connections (white), delayed connections (orange) and disconnected networks (black). (Online version in colour.)
Figure 6.
Figure 6.
The brain must cope with interconnected timescales: from fast perceptual to slow mood dynamics. Rapid exteroceptive perception is supported through fast, unstable dynamics in the topological periphery (left-hand side). Slow interoceptive perception arises from slow neuronal dynamics within the topological rich-club core of the brain (right-hand side). ANS, autonomic nervous system. Connectome image taken from Perry et al. [106]. (Online version in colour.)

References

    1. Brodmann K. 1909. Vergleichende Lokalisationslehre der Grosshirnrinde in ihren Prinzipien dargestellt auf Grund des Zellenbaues: Barth.
    1. Catani M, Thiebaut de Schotten M, Slater D, Dell'Acqua F. 2013. Connectomic approaches before the connectome. Neuroimage 80, 2–13. (10.1016/j.neuroimage.2013.05.109) - DOI - PubMed
    1. Zilles K, Amunts K. 2009. Receptor mapping: architecture of the human cerebral cortex. Curr. Opin. Neurol. 22, 331–339. (10.1097/WCO.0b013e32832d95db) - DOI - PubMed
    1. Kötter R, Stephan K, Palomero-Gallagher N, Geyer S, Schleicher A, Zilles K. 2001. Multimodal characterisation of cortical areas by multivariate analyses of receptor binding and connectivity data. Anat. Embryol. 204, 333–349. (10.1007/s004290100199) - DOI - PubMed
    1. Stephan KE, Zilles K, Kötter R. 2000. Coordinate-independent mapping of structural and functional data by objective relational transformation (ORT). Phil. Trans. R. Soc. Lond. B 355, 37–54. (10.1098/rstb.2000.0548) - DOI - PMC - PubMed

LinkOut - more resources