Review
. 2015 May 19;370(1668):20140172.
doi: 10.1098/rstb.2014.0172.

The restless brain: how intrinsic activity organizes brain function

Affiliations
Review

The restless brain: how intrinsic activity organizes brain function

Marcus E Raichle. Philos Trans R Soc Lond B Biol Sci. .

Abstract

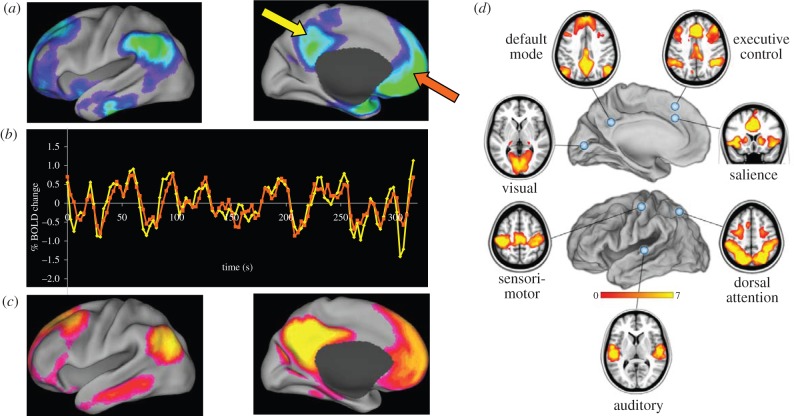
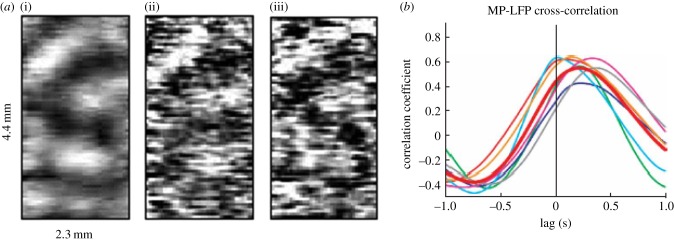
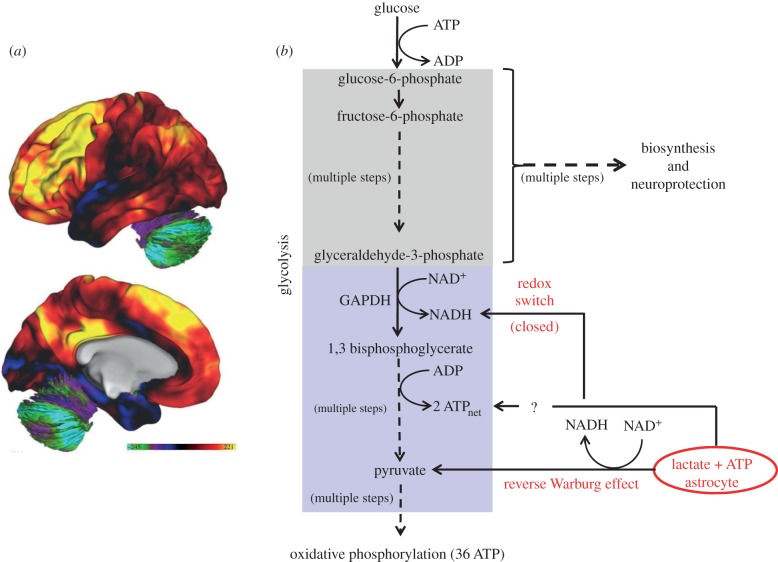
Traditionally studies of brain function have focused on task-evoked responses. By their very nature such experiments tacitly encourage a reflexive view of brain function. While such an approach has been remarkably productive at all levels of neuroscience, it ignores the alternative possibility that brain functions are mainly intrinsic and ongoing, involving information processing for interpreting, responding to and predicting environmental demands. I suggest that the latter view best captures the essence of brain function, a position that accords well with the allocation of the brain's energy resources, its limited access to sensory information and a dynamic, intrinsic functional organization. The nature of this intrinsic activity, which exhibits a surprising level of organization with dimensions of both space and time, is revealed in the ongoing activity of the brain and its metabolism. As we look to the future, understanding the nature of this intrinsic activity will require integrating knowledge from cognitive and systems neuroscience with cellular and molecular neuroscience where ion channels, receptors, components of signal transduction and metabolic pathways are all in a constant state of flux. The reward for doing so will be a much better understanding of human behaviour in health and disease.

Keywords: aerobic glycolysis; functional connectivity; local field potentials; neoteny; resting state; slow cortical potentials.


Figures

Figure 1.
Figure 1.
Performance of a wide variety of tasks has called attention to a group of brain areas (a) that decrease their activity during task performance. These areas are often referred to as the brain's default mode network (DMN). If one records the spontaneous fMRI BOLD signal activity in these areas in the resting state (arrows, a) what emerges is a remarkable similarity in the behaviour of the signals between areas (b). Using these fluctuations to analyse the network as a whole reveals a level of functional organization in the ongoing intrinsic activity of the brain (c) that parallels that seen in the task-related activity decreases (a). Analyses of other brain systems (d) reveal similar levels of functional organization that exist in concert with their subcortical connections (not shown). Elements of this figure were adapted from [36,37] with permission.
Figure 2.
Figure 2.
Measurements in laboratory animals provide a more detailed picture of intrinsic activity at the cellular level complementing nicely data from humans. (a) Voltage-sensitive dye imaging of spontaneous and evoked activity in the visual cortex of the anaesthetized cat: (i) an averaged orientation map using full-field gratings of vertical orientation; (ii) a map obtained in a single frame from a spontaneous recording session and (iii) a single frame from an evoked session. Spontaneous and evoked activities are remarkably similar as noted in figure 1 as well. Adapted from [76] with permission. (b) This graph from [84] provides a very nice demonstration of how the membrane potentials (i.e. UDS) of CA1 hippocampal interneurons are spontaneously phase-locked to the LFPs of parietal cortex neurons in the mouse, suggesting a mechanism by which a systems level organization (e.g. as in figure 1) might arise (used with permission). The latency shown in this figure (i.e. ± 1 s) is remarkably similar to that recently shown by us to exist within and among systems in the human brain [85].
Figure 3.
Figure 3.
Aerobic glycolysis refers to glycolysis in the presence of oxygen that exceeds that needed for oxidative phosphorylation. (a) A map of aerobic glycolysis here illustrated on the lateral and medial surfaces of the human brain in 33 normal young adults [106]. The colour bar is in units of a glycolytic index, a quantitative measure of glycolysis [106]. The levels of aerobic glycolysis vary significantly within the brain. Adapted from [103] with permission. (b) A very simplified depiction of glycolysis highlighting features discussed in detail in the text. Elements of glycolysis are highlighted by two coloured boxes to denote those elements involved in biosynthesis and neuroprotection (grey) and those involved in energy generation (blue). The diagram is also meant to highlight the symbiotic relationship between astrocytes and neurons which not only involves providing substrate (i.e. lactate) for energy generation via oxidative phosphorylation (reverse Warburg effect) but also, in so doing, how astrocyte lactate alters the redox potential of the neuron (redox switch) to divert neuronal glycolysis into biosynthesis and neuroprotection (i.e. management of reactive oxygen species). Astrocytes also have been shown to regulate UP states through a purinergically mediated mechanism [107]. Because astrocytes release ATP [108] along with lactate, it is attractive to posit regulation of UP states via KATP channels in the neuron.

References

    1. Berger H. 1929. Uber des Elektrenkephalogramm des Menschen. Arch. Psychiatr. Nervenkrankheiten 87, 527–580. ( 10.1007/BF01797193) - DOI
    1. Gloor P. 1969. Hans Berger on the electroencephalogram of man. The fourteen original reports on the human electroencephalogram. Electroencephalogr. Clin. Neurophysiol. 168(suppl. 28), 1–350. - PubMed
    1. Clarke DD, Sokoloff L. 1999. Circulation and energy metabolism of the brain. In Basic neurochemistry. Molecular, cellular and medical aspects (eds Agranoff BW, Siegel GJ.), pp. 637–670, 6th edn Philadelphia, PA: Lippincott-Raven.
    1. Mink JW, Blumenschine RJ, Adams DB. 1981. Ratio of central nervous system to body metabolism in vertebrates: its constancy and functional basis. Am. J. Physiol. 241, R203–R212. - PubMed
    1. Raichle ME, Mintun MA. 2006. Brain work and brain imaging. Annu. Rev. Neurosci. 29, 449–476. ( 10.1146/annurev.neuro.29.051605.112819) - DOI - PubMed

Publication types

LinkOut - more resources