. 2015 Apr 6;212(4):555-68.
doi: 10.1084/jem.20140857. Epub 2015 Mar 30.

T cell lipid peroxidation induces ferroptosis and prevents immunity to infection

Affiliations

T cell lipid peroxidation induces ferroptosis and prevents immunity to infection

Mai Matsushita et al. J Exp Med. .

Abstract

The selenoenzyme glutathione peroxidase 4 (Gpx4) is a major scavenger of phospholipid hydroperoxides. Although Gpx4 represents a key component of the reactive oxygen species-scavenging network, its relevance in the immune system is yet to be defined. Here, we investigated the importance of Gpx4 for physiological T cell responses by using T cell-specific Gpx4-deficient mice. Our results revealed that, despite normal thymic T cell development, CD8(+) T cells from T(ΔGpx4/ΔGpx4) mice had an intrinsic defect in maintaining homeostatic balance in the periphery. Moreover, both antigen-specific CD8(+) and CD4(+) T cells lacking Gpx4 failed to expand and to protect from acute lymphocytic choriomeningitis virus and Leishmania major parasite infections, which were rescued with diet supplementation of high dosage of vitamin E. Notably, depletion of the Gpx4 gene in the memory phase of viral infection did not affect T cell recall responses upon secondary infection. Ex vivo, Gpx4-deficient T cells rapidly accumulated membrane lipid peroxides and concomitantly underwent cell death driven by ferroptosis but not necroptosis. These studies unveil an essential role of Gpx4 for T cell immunity.


Figures

Figure 1.
Figure 1.
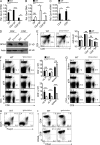
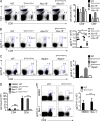
T specific deletion of Gpx4 leads to normal thymocyte development but defective CD8+ T cell homeostasis in the periphery. (A) Analysis of Gpx4 mRNA in DP, CD4+ SP, or CD8+ SP thymocytes. Results were normalized to G6pdx mRNA. (B) Analysis of genomic Gpx4 DNA in DP, CD4+ SP, or CD8+ SP thymocytes of WT and TΔGpx4/ΔGpx4 mice to determine the presence of the loxP-flanked neomycin resistance gene. Gapdh was used as the housekeeping gene. (C) Real-time PCR analysis of Gpx4 mRNA in peripheral CD4+ or CD8+ splenocytes. Results were normalized to G6pdx mRNA. (D) Western blot of GPX4 expression levels in peripheral CD4+ or CD8+ T cells. Actin was used as a loading control. (E) Representative FACS analysis (left) and absolute number (right) of thymocytes in WT littermate control and TΔGpx4/ΔGpx4 mice. There are no statistically significant differences in the absolute number of CD4CD8 double negative (DN), CD4+CD8+ DP, CD4+ SP, or CD8+ SP thymocytes (n = 4 mice per group of 6-wk-old mice). (F and G) Flow cytometry analysis of spleen, peripheral LN (pLN), and mesenteric LN (mLN) cells from 6-wk-old (F) and 20-wk-old (G) WT and TΔGpx4/ΔGpx4 mice (left), and absolute numbers (F, right) of CD4+ (top) or CD8+ (bottom) T cells in the spleen (n = 4–5 per group). (H) Analysis of CD4+CD25+Foxp3+ T regulatory cells (T reg cells) in the spleens of WT and TΔGpx4/ΔGpx4 mice (representative plot from n ≤ 4 per group). Flow cytometry plots are pregated on CD4+ subsets. (I) Expression of CD62L and CD44 on WT and TΔGpx4/ΔGpx4 mice splenic T cells. Plots are pregated on CD4+ (top) or CD8+ (bottom; representative plot from n = 3 per group of 6-wk-old mice). *, P ≤ 0.05; **, P ≤ 0.01; ***, P ≤ 0.001; ****, P ≤ 0.0001; ns, not significant (two-tailed Student’s t test). Data are representative of four independent experiments.
Figure 2.
Figure 2.
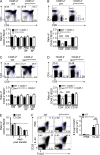
Both CD4+ and CD8+ T cells require Gpx4 for survival and sterile expansion upon transfer into lymphopenic mice. (A and B) Mixed BM chimeras were generated by transfer of a mixture (1:1) of BM stem cells from WT (CD45.1+) or TΔGpx4/ΔGpx4 (CD45.2+) mice into sublethally irradiated WT (CD45.1+CD45.2+) mice, followed by analysis at 7 wk after reconstitution. Percentages of reconstituted T cell subsets in the thymuses (A) and spleens (B) from WT and TΔGpx4/ΔGpx4 donors were normalized to B220+ BM frequencies (n ≥ 6 per group). ****, P ≤ 0.0001 (Student’s t test). (C and D) Flow cytometry (top) and ratio (bottom) of thymocytes (C) and splenocytes (D) from mixed BM chimeras generated by transfer of a mixture (1:1) of tamoxifen-treated BM stem cells from WT (CD45.1+) or tamΔGpx4/ΔGpx4 (CD45.2+) mice into sublethally irradiated WT (CD45.1+) mice. Analysis at 8 wk after reconstitution (n = 4 per group). **, P ≤ 0.01; ****, P ≤ 0.0001 (Student’s t test). (E) Ratios of surviving CD4+ and CD8+ T cells in the peripheral blood on days 1, 5 and 7 after adoptive transfer of equal numbers of WT (CD45.1+) and TΔGpx4/ΔGpx4 (CD45.2+) donor thymocytes into Rag-1-deficient mice (n ≥ 6 per group). (F) Flow cytometry (left) and absolute numbers (right) of splenic T reg cells at 5 d after in vivo expansion of T reg cells by intraperitoneal injection with PBS or interleukin-2 (IL-2) and anti-IL-2 antibody complex into WT or TΔGpx4/ΔGpx4 mice. Splenic cells were analyzed on 5 d after injection. Ns, not significant (Student’s t test). Data are representative of four (A and B), three (E), and two (C, D, and F) independent experiments.
Figure 3.
Figure 3.
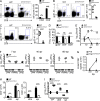
Gpx4-deficient T cells failed to expand following viral and parasite infection. WT and TΔGpx4/ΔGpx4 mice were infected with LCMV 200 plaque-forming units (pfu) WE i.v. and analyzed on 7 d after infection (dpi). (A) Flow cytometry of CD4+ and CD8+ T cells (left) and total numbers (right; n = 4 per group). (B and C) Flow cytometry (left) and absolute number (right) of gp61-80 tetramer positive CD4+ (B) and gp33-41 tetramer positive CD8+ (C) T cells (n ≥ 4 per group). (D) Frequency of LCMV infected splenocytes from mixed BM chimeras generated by transfer of equal mixture (1:1) of BM stem cells from WT (CD45.1+) and WT or tamΔGpx4/ΔGpx4 (CD45.2+) mice into sublethally irradiated WT (CD45.1+) mice. 8 wk after reconstitution, mice were treated with 2 mg of tamoxifen i.p. for 2 consecutive days, followed by infection with LCMV 200 pfu of WE strain, and analyzed at 10 dpi (n = 3 per group). (E) Viral titers in the blood of infected WT and TΔGpx4/ΔGpx4 mice over time. (F) Viral titers in the liver, lung, and kidney of infected WT and TΔGpx4/ΔGpx4 mice at 7 (left), 40 (middle), and 160 dpi (right; n = 4 per group). (G) Total number of Vα2+CD8+ T cells of WT (CD45.1+) and P14ΔGpx4/ΔGpx4 (CD45.2+) mice that were adoptively transferred into WT (CD45.1+CD45.2+) mice and infected with LCMV-WE (1000 pfu) 2 h after transfer. Mice were analyzed at 3 and 4 dpi (n = 5 per group). (H and I) WT and TΔGpx4/ΔGpx4 mice were inoculated with 2 × 10⁶ L. major stationary-phase promastigotes into the right hind footpad and analyzed at 10 wk after infection. Total number of CD4+ (left) and CD8+ (right) T cell in the draining LN (dLN), and spleen (spl; H). Parasite load in infected footpad (FP), dLN, and spleen were measured by limiting dilution analysis (I). Dotted line represents the limit of detection (DtL; n = 6 per group). Statistical significance is defined by Student’s t test (**, P ≤ 0.01; ***, P ≤ 0.001; ****, P ≤ 0.0001). Representative data are shown from four (A–C, E, and F), three (G), and two (D, H, and I) independent experiments.
Figure 4.
Figure 4.
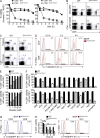
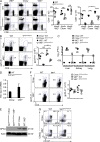
Gpx4-deficient T cells rapidly accumulate lipid peroxides and die by ferroptosis. (A) Frequencies of viability of CD4+ and CD8+ T cells from the LNs defined by Annexin V and 7AAD cells over time under stimulation with α-CD3 (5 µg/ml) and α-CD28 (2 µg/ml; left) or unstimulated (right) conditions (n = 3 per group). (B) Flow cytometry of viable CD4+ and CD8+ T cells LN cells distinguished by Annexin V7AAD (pregated) population after 4 h of culture at 37°C. Cells were stimulated with α-CD3 (5 µg/ml) and α-CD28 (2 µg/ml; top) or unstimulated (bottom) in the presence of IL-2 (20 ng/ml; n = 3 per group). (C) Flow cytometry of splenic CD4+ and CD8+ T cells cultured under normoxic (21% O2) or hypoxic (1% O2) conditions for 5 h at 37°C (n = 4 per group). (D) Accumulation of lipid peroxidation in CD4+ and CD8+ T cells determined by C11-BODIPY581/591 (2 µM) at 0.5, 2, and 4 h after incubation at 37°C (n = 3 per group). (E) Percent viability of stimulated CD4+ (left) and CD8+ (right) splenic T cells after 4 h at 37°C with various concentrations of ebselen (n = 3 per group). (F) Frequencies of viable (eFluor780) splenic CD4+- (left) and CD8+-stimulated (right) T cells treated with antioxidants or cell death pathway inhibitors for 24 h at 37°C (n = 4 per group). (G) C11-BODIPY581/591 (FL-1) accumulation in stimulated CD4+ and CD8+ T cells, treated with ferrostatin-1 (Fer-1; 10 µM) for 4 h (n = 3 per group). (H) Total number of splenic CD4+ T cells at 0, 2, 4, and 24 h after intravenous injection of α-CD3 antibody (1 µg; left) and lipid peroxidation assessed by C11-BODIPY581/591 at 4 and 24 h after injection (right; n = 3 per group). The data are representative of at least five (A, B, and F), three (D, E, and G), and two (H) independent experiments. Statistical significance is defined by Student’s t test (*, P ≤ 0.1; **, P ≤ 0.01).
Figure 5.
Figure 5.
12/15-lipoxygenase does not restore viability of Gpx4 deficient T cells. (A) Splenic CD4+ and CD8+ T cell population (left) and numbers (right) of WT, TΔGpx4/ΔGpx4, 12/15-lipoxygenase (Alox15−/−), and TΔGpx4/ΔGpx4 crossed with 12/15-lipoxygenase (TΔGpx4/ΔGpx4/Alox15−/−; n = 3 per group of 6 wk old mice). Flow cytometry (left) and total number (right) of gp33-41 tetramer specific CD8+ cells from LCMV-infected spleens of WT, TΔGpx4/ΔGpx4, Alox15−/−, and TΔGpx4/ΔGpx4/Alox15−/− (B; n ≥ 4 per group). WT, TΔGpx4/ΔGpx4, Ripk3−/−, and TΔGpx4/ΔGpx4/Ripk3−/− (C; n = 3 per group) at 7 dpi. (D and E) Necrostatin-1 (Nec-1; 1.65 mg/kg) was injected daily beginning from 2 d before infection with LCMV 200 pfu WE strain. Total number of splenic CD4+ and CD8+ T cells (D) and gp33-41 tetramer specific CD8+ T cells (E) at 7 dpi (n = 3 per group). Representative data are shown from two independent experiments. *, P ≤ 0.05; **, P ≤ 0.01; ***, P ≤ 0.001 (two-tailed Student’s t test).
Figure 6.
Figure 6.
Vitamin E rescues CD8+ T cell defect and restores viral clearance. Mice fed with vitamin E low (VitElow; <10 mg/kg), chow (50 mg/kg), or vitamin E high (VitEhi; 500 mg/kg) for 3 wk. (A) Flow cytometry (left) and absolute number of splenic CD4+ (middle) or CD8+ T cells (right) in WT and TΔGpx4/ΔGpx4 mice after 3 wk of diet supplementation (n = 3 per group of 6-wk-old mice). (B) Flow cytometry (left) and total number (right) of gp33-41 tetramer specific CD8+ T cells in the spleen (n = 3 per group) at 7 dpi with LCMV WE 200 pfu. (C) Viral titers of LCMV (WE 200 pfu) infected mice in the liver, lung, and kidney (n = 3 per group) at 7 dpi. (D and E) Quantification of Gpx4 mRNA levels in splenic MACS sorted CD8+ T cells. Expression was normalized to G6pdx mRNA levels. (E) Western blot of GPX4 expression withactin as loading control in splenic MACS sorted CD8+ T cells. (F) Flow cytometry of splenocytes infected with LCMV WE (200 pfu), followed by Gpx4 deletion with tamoxifen (2 mg for 2 d) and infection with L. monocytogenes expressing the LCMV gp33 epitope (LM-gp33; 5 × 10⁴ cfu) at 69 dpi. Mice were given vitamin E diet 1 wk before LM-gp33 infection. Analysis at 4 dpi with LM-gp33 (n ≥ 5 per group). (G) Expression of CD62L and CD127 from splenocytes as in (F). Representative data are shown from three (A–C) and two (D–G) independent experiments. *, P ≤ 0.05; **, P ≤ 0.01 (Student’s t test).

Similar articles

Cited by

References

    1. Angelini G., Gardella S., Ardy M., Ciriolo M.R., Filomeni G., Di Trapani G., Clarke F., Sitia R., and Rubartelli A.. 2002. Antigen-presenting dendritic cells provide the reducing extracellular microenvironment required for T lymphocyte activation. Proc. Natl. Acad. Sci. USA. 99:1491–1496 10.1073/pnas.022630299 - DOI - PMC - PubMed
    1. Ashkenazi A., and Dixit V.M.. 1998. Death receptors: signaling and modulation. Science. 281:1305–1308 10.1126/science.281.5381.1305 - DOI - PubMed
    1. Beck M.A., Williams-Toone D., and Levander O.A.. 2003. Coxsackievirus B3-resistant mice become susceptible in Se/vitamin E deficiency. Free Radic. Biol. Med. 34:1263–1270 10.1016/S0891-5849(03)00101-1 - DOI - PubMed
    1. Brownlee M.2001. Biochemistry and molecular cell biology of diabetic complications. Nature. 414:813–820 10.1038/414813a - DOI - PubMed
    1. Carr E.L., Kelman A., Wu G.S., Gopaul R., Senkevitch E., Aghvanyan A., Turay A.M., and Frauwirth K.A.. 2010. Glutamine uptake and metabolism are coordinately regulated by ERK/MAPK during T lymphocyte activation. J. Immunol. 185:1037–1044 10.4049/jimmunol.0903586 - DOI - PMC - PubMed

Publication types

MeSH terms