. 2015 Mar 31:6:6651.
doi: 10.1038/ncomms7651.

Glycosylation of immunoglobulin G determines osteoclast differentiation and bone loss

Affiliations

Glycosylation of immunoglobulin G determines osteoclast differentiation and bone loss

Ulrike Harre et al. Nat Commun. .

Abstract

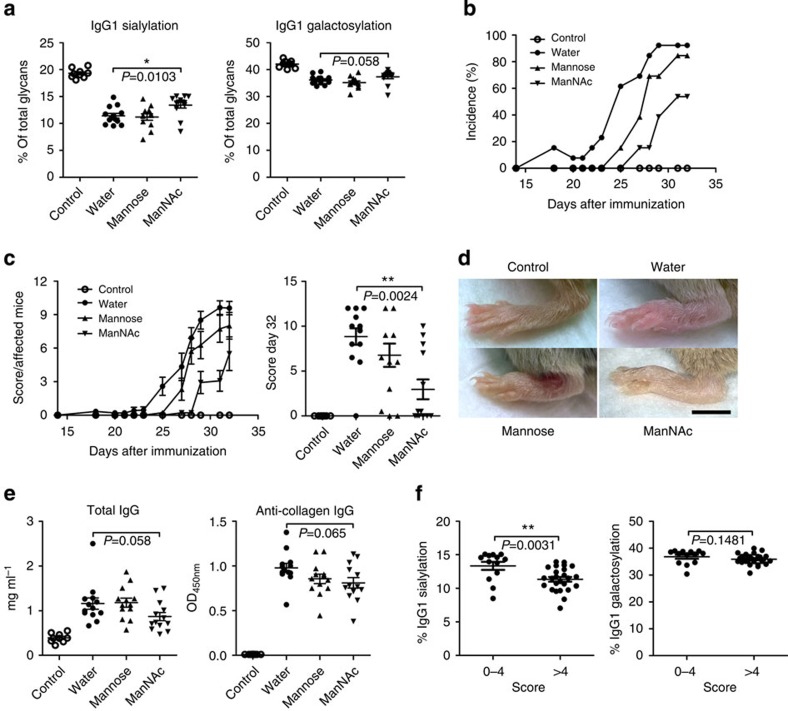
Immunglobulin G (IgG) sialylation represents a key checkpoint that determines the engagement of pro- or anti-inflammatory Fcγ receptors (FcγR) and the direction of the immune response. Whether IgG sialylation influences osteoclast differentiation and subsequently bone architecture has not been determined yet, but may represent an important link between immune activation and bone loss. Here we demonstrate that desialylated, but not sialylated, immune complexes enhance osteoclastogenesis in vitro and in vivo. Furthermore, we find that the Fc sialylation state of random IgG and specific IgG autoantibodies determines bone architecture in patients with rheumatoid arthritis. In accordance with these findings, mice treated with the sialic acid precursor N-acetylmannosamine (ManNAc), which results in increased IgG sialylation, are less susceptible to inflammatory bone loss. Taken together, our findings provide a novel mechanism by which immune responses influence the human skeleton and an innovative treatment approach to inhibit immune-mediated bone loss.


Figures

Figure 1
Figure 1. Fc-glycosylation determines the osteoclastogenic effects of human immune complexes.
(a) Fold change of osteoclast number and (b) nuclei per osteoclast after 24 h treatment of human preosteoclasts with 100 μg ml−1 of native, desialylated (ds) or deglycosylated (dg) monomeric (IgG) or complexed (IC) pooled human IgG. TRAP-positive cells with ≥3 nuclei were considered as osteoclasts. Bars show mean±s.e.m. of five independent experiments. (c) Representative micro images. Scale bar, 100 μm. (d) Fold change of the resorbed area after 24 h treatment of human preosteoclasts with 100 μg ml−1 of native or desialylated (ds) IgG complexes (IC) in calcium phosphate-coated wells. Bars show mean±s.e.m. of five independent experiments (e) Representative micro images. Scale bar, 500 μm. Statistical analysis was performed with Mann–Whitney U-test. **P<0.01.
Figure 2
Figure 2. FcγRII and III mediate the signal of non-sialylated immune complexes on preosteoclasts.
(a) Quantitative RT-PCR for relative mRNA levels of FcγR and adaptor proteins normalized on β2-microglobulin during osteoclastogenesis. Day 0 represents the stage of monocytes, day 6–8 the stage of late preosteoclasts and day 10 the stage of mature osteoclasts. Bars show mean±s.e.m. of three independent experiments. (b) Fluorescence microscopy images of FcγR expression on human preosteoclasts. FcγR are depicted in green, phalloidin staining for actin is depicted in red and DRAQ5 staining for the nuclei is depicted in blue. Scale bar, 25 μm (representative images of three independent experiments). (c) Fold change of osteoclast number after stimulation of preosteoclasts with 100 μg ml−1 of desialylated immune complexes (IC-ds) in the presence of 10 μg ml−1 of blocking antibodies against indicated FcγR. TRAP-positive cells with ≥3 nuclei were considered as osteoclasts. Bars show mean±s.e.m. of four independent experiments. Statistical analysis was performed with Mann–Whitney U-test. *P<0.5, **P<0.01, ***P<0.001.
Figure 3
Figure 3. Non-sialylated immune complexes stimulate osteoclastogenesis in vivo.
(a) Number of osteoclasts per bone perimeter (N.Oc/B.Pm) and (b) osteoclast surface per bone surface (Oc.S/BS) in tibial bone of C57BL/6 mice with intra-articular injection of the indicated amounts of native or desialylated (ds) murine immune complexes. Mice were injected at day 0 and day 4 with bone dissection at day 7. When indicated, 100 ng of TNFα was added to the first injection. Bars show mean±s.e.m. of ≥12 knee joints of three independent experiments. (c) Representative images of TRAP-stained tibial sections. Scale bar, 50 μm. (d) Inflammation score of haematoxylin-eosin stained joint sections with a score of 0 representing a healthy joint and a score of 4 representing a completely destroyed joint. Bars show mean±s.e.m. of ≥12 knee joints of three independent experiments. (e) Representative images of haematoxylin-eosin stained tibial sections. Scale bar, 500 μm. Statistical analysis was performed with Mann–Whitney U-test. *P<0.5, **P<0.01, ***P<0.001.
Figure 4
Figure 4. Sialylation status of IgG and ACPA control bone mass in rheumatoid arthritis patients.
(ac) Bone morphometric parameters including bone volume per tissue volume (BV/TV), trabecular number (Tb.N) and trabecular thickness (Tb.Th) of RA patients with low, medium or high levels of Fc (a) sialylation, (b) galactosylation or (c) fucosylation of total IgG and ACPA. Bars show mean±s.e.m. of10 patients in each tertile. Cutoffs for tertiles are as follows: IgG Fc sialylation (low: <14%, middle: 15–17.5%, high: >17.5%), ACPA Fc sialylation (<12%; 12–16%; >16%), IgG Fc galactosylation (<43.5%; 43.5–51%; >51%); ACPA Fc galactosylation (<44%; 44–54.5%; >54.5%); IgG Fc fucosylation (<85%; 85–87%; >87%); ACPA Fc fucosylation (<93%; 93–96%; >96%). (d) Two-dimensional (upper panel) and 3-dimensional (lower panels) reconstruction of the bone architecture of patients with low and high degree of Fc sialylation; (e) Fold change of osteoclast number after treatment of preosteoclasts for 72 h with 10 μg ml−1 of native, galactosylated (gal) or galactosylated and sialylated (sial) monoclonal ACPA (clone 109 and C7). TRAP-positive cells with ≥3 nuclei were considered as osteoclasts. Bars show mean±s.e.m. of three independent experiments. Statistical analysis was performed with Kruskal–Wallis test with Dunn’s correction (ac) and Mann–Whitney U-test (e). *P<0.5, **P<0.01.
Figure 5
Figure 5. Treatment with ManNAc increases sialylation of IgG1 and reduces susceptibility to CIA.
(a) Quantification of total serum IgG1 Fc sialylation and galactosylation at day 32 in non-induced control mice and mice induced for CIA receiving treatment with water, 10 g l−1 mannose or 10 g l−1 ManNAc. (b) Incidence of CIA. (c) Arthritis scores. (d) Representative images of hind paws at day 32. Scale bar, 5 mm. (e) Quantification of total serum IgG and collagen- specific IgG at day 32. Bars show mean±s.e.m. of combined data from two independent experiments (non-induced control group: n=9 mice; all other groups: n=13 mice). (f) Quantification of total serum IgG1 Fc sialylation and galactosylation at day 32 from mice that stayed healthy or developed mild arthritis (score 0–4) and from mice that developed severe arthritis (score >4). Bars show mean±s.e.m. of combined data from all mice subjected to CIA (score 0–4: n=13; score >4: n=25). Statistical analysis was performed with Mann–Whitney U-test. *P<0.5, **P<0.01.
Figure 6
Figure 6. Treatment with N-acetylmannosamine (ManNAc) inhibits arthritis-mediated bone loss.
(a,b) Representative 3-dimensional reconstructions of the bone architecture of hind paws (a) and tibial bones (b) of non-induced control mice and mice induced for collagen-induced arthritis (CIA) treated with water, 10 g l−1 mannose or 10 g l−1 ManNAc. (c) Bone morphometric parameters of the tibiae including trabecular and cortical bone volume per tissue volume (tBV/TV; cBV/TV) and trabecular and cortical bone mineral density (tBMD; cBMD). Bars show mean±s.e.m. from one representative experiment (non-induced control group: n=5 mice; water treated group: n=7 mice; all other groups n=6 mice). (d) Representative images of TRAP-stained paw sections. Scale bar, 200 μm. (e) Histological parameters of the hind paws including eroded area per tissue area (E.Ar/T.Ar) and osteoclast number per tissue area (N.Oc/T.Ar). Bars show mean±s.e.m. of combined data from two independent experiments (non-induced control group: n=9 mice; all other groups: n=13 mice). Statistical analysis was performed with Mann–Whitney U-test. **P<0.01.

Comment in

Similar articles

Cited by

References

    1. Arnold J. N., Wormald M. R., Sim R. B., Rudd P. M. & Dwek R. A. The impact of glycosylation on the biological function and structure of human immunoglobulins. Annu. Rev. Immunol. 25, 21–50 (2007) . - PubMed
    1. Anthony R. M. & Nimmerjahn F. The role of differential IgG glycosylation in the interaction of antibodies with FcgammaRs in vivo. Curr. Opin. Organ Transplant. 16, 7–14 (2011) . - PubMed
    1. Yamaguchi Y. et al.. Glycoform-dependent conformational alteration of the Fc region of human immunoglobulin G1 as revealed by NMR spectroscopy. Biochim. Biophys. Acta. 1760, 693–700 (2006) . - PubMed
    1. Anthony R. M. et al.. Recapitulation of IVIG anti-inflammatory activity with a recombinant IgG Fc. Science 320, 373–376 (2008) . - PMC - PubMed
    1. Bohm S., Schwab I., Lux A. & Nimmerjahn F. The role of sialic acid as a modulator of the anti-inflammatory activity of IgG. Semin. Immunopathol. 34, 443–453 (2012) . - PubMed

Publication types

MeSH terms