. 2015 Jun 15;197(12):1976-87.
doi: 10.1128/JB.00074-15. Epub 2015 Mar 30.

Oxygen-Dependent Cell-to-Cell Variability in the Output of the Escherichia coli Tor Phosphorelay

Affiliations

Oxygen-Dependent Cell-to-Cell Variability in the Output of the Escherichia coli Tor Phosphorelay

Manuela Roggiani et al. J Bacteriol. .

Abstract

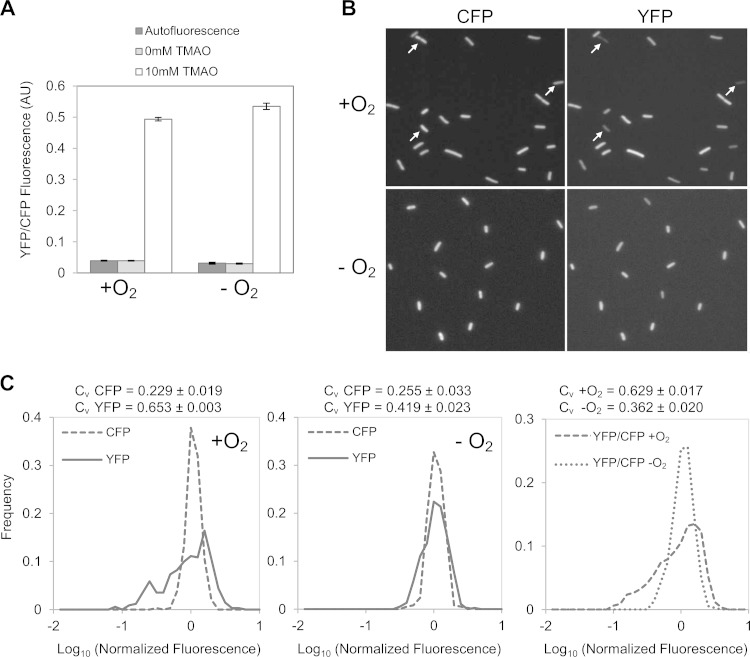
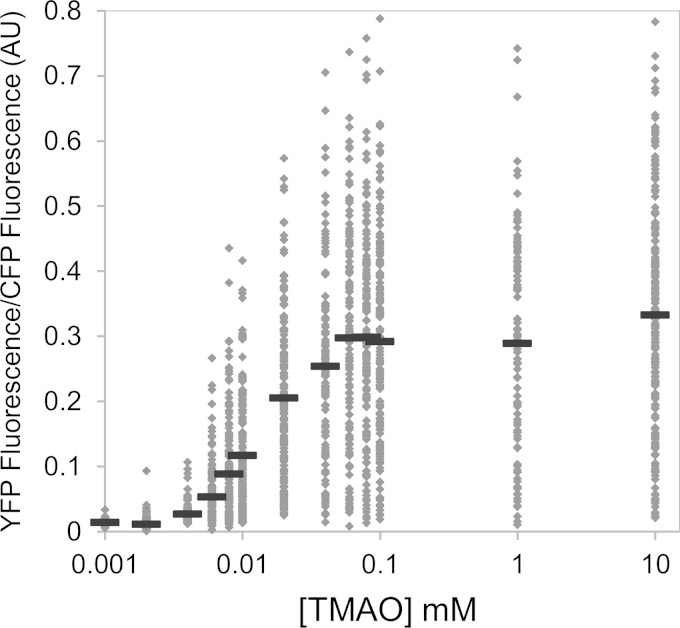
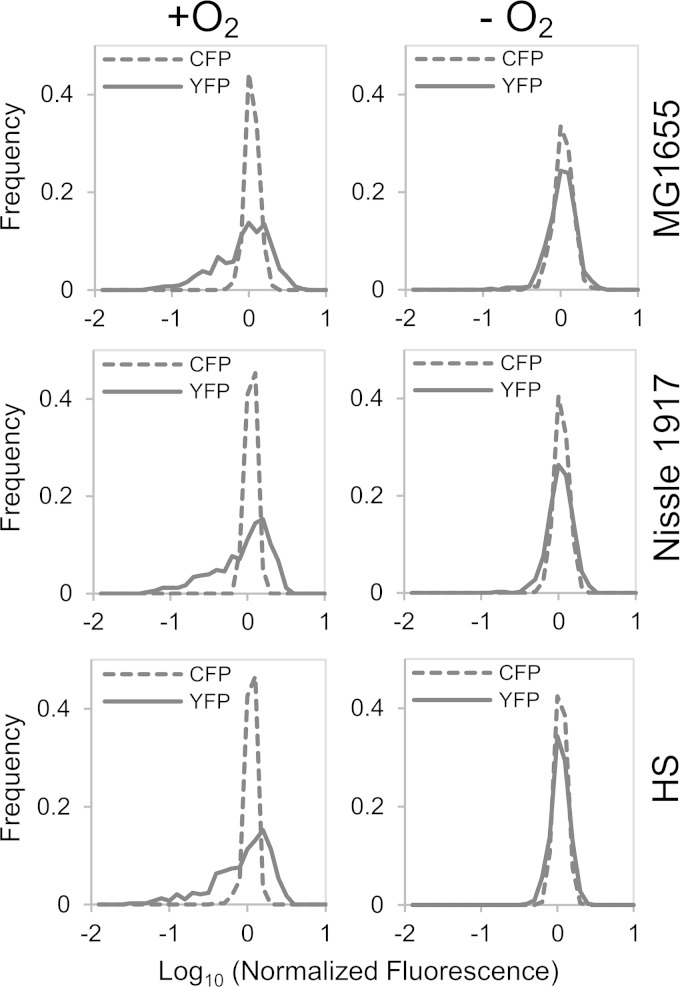
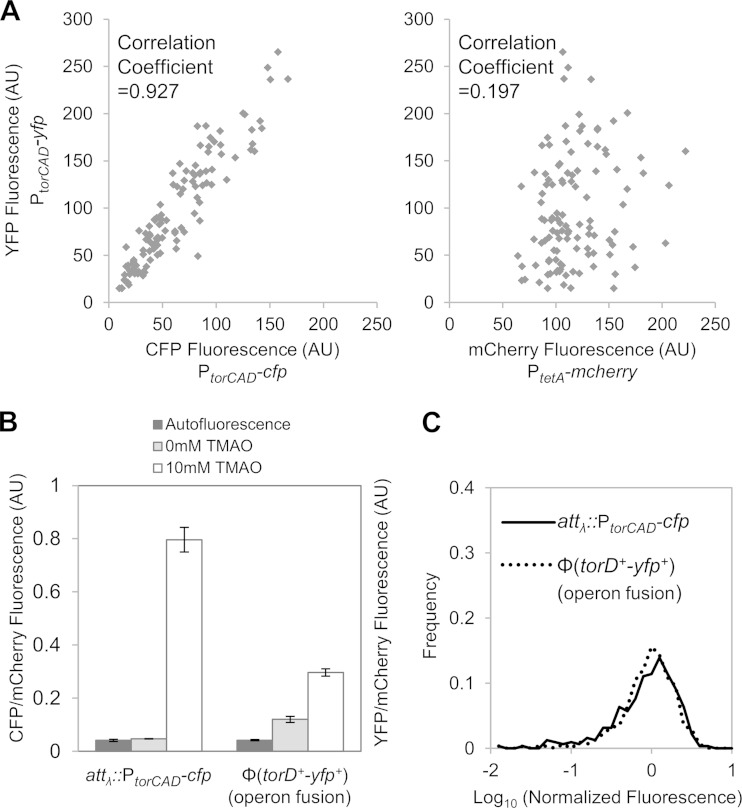
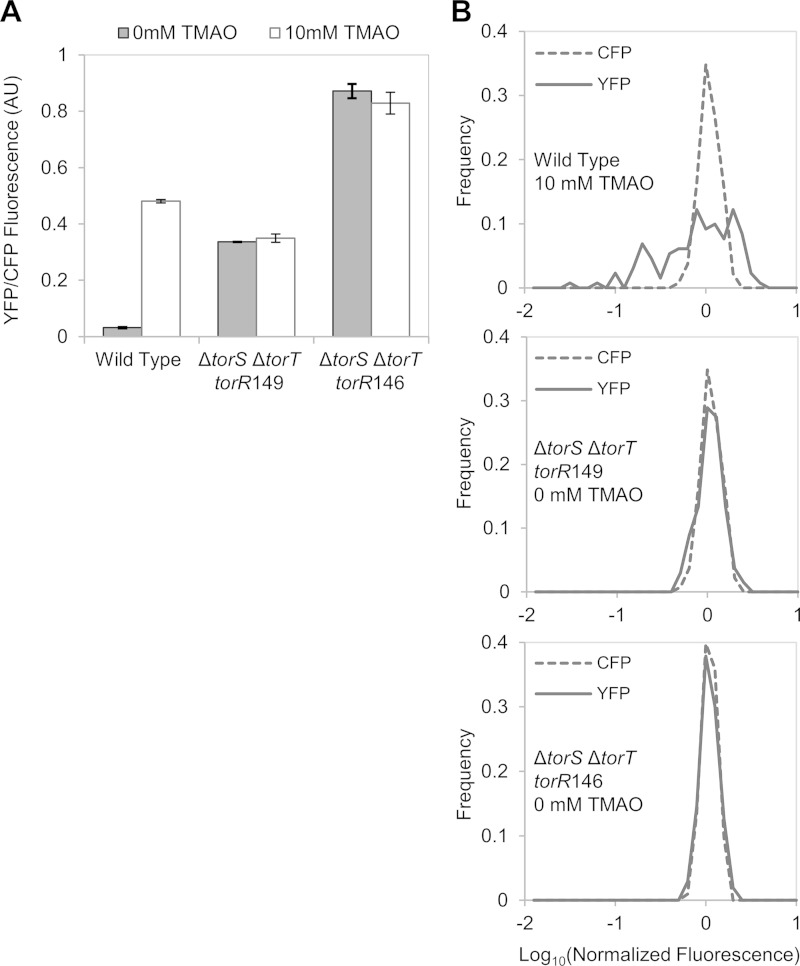
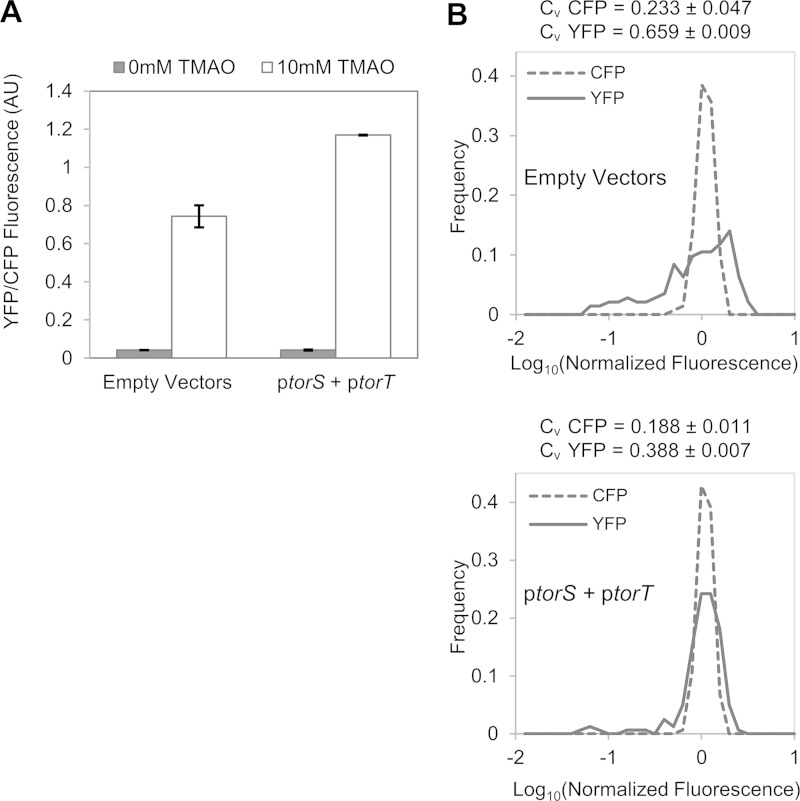
Escherichia coli senses and responds to trimethylamine-N-oxide (TMAO) in the environment through the TorT-TorS-TorR signal transduction system. The periplasmic protein TorT binds TMAO and stimulates the hybrid kinase TorS to phosphorylate the response regulator TorR through a phosphorelay. Phosphorylated TorR, in turn, activates transcription of the torCAD operon, which encodes the proteins required for anaerobic respiration via reduction of TMAO to trimethylamine. Interestingly, E. coli respires TMAO in both the presence and absence of oxygen, a behavior that is markedly different from the utilization of other alternative electron acceptors by this bacterium. Here we describe an unusual form of regulation by oxygen for this system. While the average level of torCAD transcription is the same for aerobic and anaerobic cultures containing TMAO, the behavior across the population of cells is strikingly different under the two growth conditions. Cellular levels of torCAD transcription in aerobic cultures are highly heterogeneous, in contrast to the relatively homogeneous distribution in anaerobic cultures. Thus, oxygen regulates the variance of the output but not the mean for the Tor system. We further show that this oxygen-dependent variability stems from the phosphorelay.

Importance: Trimethylamine-N-oxide (TMAO) is utilized by numerous bacteria as an electron acceptor for anaerobic respiration. In E. coli, expression of the proteins required for TMAO respiration is tightly regulated by a signal transduction system that is activated by TMAO. Curiously, although oxygen is the energetically preferred electron acceptor, TMAO is respired even in the presence of oxygen. Here we describe an interesting and unexpected form of regulation for this system in which oxygen produces highly variable expression of the TMAO utilization proteins across a population of cells without affecting the mean expression of these proteins. To our knowledge, this is the first reported example of a stimulus regulating the variance but not the mean output of a signaling system.


Figures

FIG 1
FIG 1
Fluorescence quantification of PtorCAD-yfp reporter expression in the presence or absence of oxygen. Cultures of strain MMR8 [PtorCAD-yfp Φ(ompA+-cfp+)] were grown in minimal medium with or without 10 mM TMAO and with or without aeration, as indicated, and analyzed by fluorescence microscopy as described in Materials and Methods. Autofluorescence in the YFP fluorescence channel was determined from cultures of the parent strain, EPB47 [Φ(ompA+-cfp+)], grown under the same conditions. (A) Average fluorescence from single cells. Values represent the means from two independent experiments; error bars represent the range. More than 300 single cells were analyzed for each condition in each experiment. AU, arbitrary units. (B) Representative fluorescence micrographs from aerobic (upper) and anaerobic (lower) cultures. The CFP [Φ(ompA+-cfp+)] and YFP (PtorCAD-yfp) fluorescence in each field is shown. Arrows highlight cells that are too dim to be easily visualized in the YFP fluorescence image. (C) Distribution of single-cell fluorescence in TMAO-treated cultures. The left and middle panels show the distribution of cellular YFP fluorescence compared to cellular CFP fluorescence in corresponding data sets in aerobic (left) and anaerobic (middle) cultures. The right panel shows a comparison of the distribution of YFP fluorescence normalized by the CFP internal standard in aerobic and anaerobic cultures. Values on the x axis are expressed as log10 fluorescence normalized by the mean value from the corresponding data set. The aerobic and anaerobic data sets consist of measurements of 341 and 379 cells, respectively. The distributions shown in panel C are taken from single experiments and are representative of seven independent experiments. The coefficient of variation (CV = standard deviation/mean) is the mean value from seven independent experiments ± the standard deviation.
FIG 2
FIG 2
Scatter plot of the TMAO dose responses of single cells. Cultures of strain MMR8 [PtorCAD-yfp Φ(ompA+-cfp+)] were grown aerobically in minimal medium in the presence of the TMAO concentrations indicated and analyzed by fluorescence microscopy as described in Materials and Methods. Each dot represents the fluorescence value of an individual cell. For each dose, measurements of at least 100 cells were made. Each solid horizontal line represents the mean value for each dose. AU, arbitrary units.
FIG 3
FIG 3
Fluorescence distributions of the PtorCAD-yfp reporter expression for three different E. coli strains in the presence or absence of oxygen. Cultures of strains MMR234 [Nissle 1917 PtorCAD-yfp Φ(ompA+-cfp+) ΔsulA::(FRT-kan-FRT)], MMR235 [HS PtorCAD-yfp Φ(ompA+-cfp+) ΔsulA::(FRT-kan-FRT)], and MMR233 [MG1655 PtorCAD-yfp Φ(ompA+-cfp+) ΔsulA::(FRT-kan-FRT)] were grown in minimal medium with or without 10 mM TMAO and with or without aeration, as indicated, and analyzed by fluorescence microscopy as described in Materials and Methods. The plots show the distribution of single-cell YFP and CFP fluorescence in TMAO-treated cultures of each strain (top, middle, and bottom panels) with oxygenation (left column) or without oxygenation (right column). Data sets consisted of more than 350 single-cell measurements that were combined from two independent experiments. Values on the x axis are expressed as log10 fluorescence normalized by the mean value of the data set.
FIG 4
FIG 4
Comparison of two torCAD reporters in the same cell. (A) Correlation between two promoter fusion reporters (PtorCAD-cfp and PtorCAD-yfp) at different chromosomal loci. Cultures of strain MMR72 (PtorCAD-cfp, PtorCAD-yfp, and PtetA-mcherry) were grown aerobically in minimal medium containing 10 mM TMAO and analyzed by fluorescence microscopy as described in Materials and Methods. Fluorescence values of YFP versus CFP (left panel) and YFP versus mCherry (right panel) are plotted for 113 cells; YFP values are the same in both plots. (B and C) Comparison of promoter and operon fusions in the same cells. Cultures of strain MMR141 [PtorCAD-cfp, Φ(torD+-yfp+), and PtetA-mcherry] were grown aerobically in medium with or without 10 mM TMAO, as indicated. The autofluorescence of cultures of the parent strain, MMR60, grown under the same conditions was determined in the YFP and CFP fluorescence channels. (B) Average fluorescence from the promoter and operon fusions, PtorCAD-cfp and Φ(torD+-yfp+), each normalized by the fluorescence of PtetA-mcherry. Shown are the mean values of two independent experiments, and error bars represent the range. In each experiment, the mean values of >100 cells were determined. (C) Distribution of fluorescence from single cells induced with 10 mM TMAO. For Φ(torD+-yfp+), the mean YFP fluorescence of noninduced cells was subtracted from the fluorescence of induced cells. Values on the x axis are expressed as log10 fluorescence normalized by the mean value of the corresponding data set. The distribution is based on measurements of >300 cells. AU, arbitrary units.
FIG 5
FIG 5
Time-lapse microscopy of two representative microcolonies. Cultures of strain MMR8 [PtorCAD-yfp Φ(ompA+-cfp+)] were grown aerobically in minimal medium with 10 mM TMAO. Cells were immobilized on 5-mm-thick agarose pads composed of 1% agarose dissolved in the same growth medium with TMAO and maintained on the microscope stage at 37°C with exposure to air. The images shown are of two representative colonies, each derived from a single cell, shortly after immobilization on agarose pads (T0) and then 3 h (T3) and 6 h (T6) after the starting time point (approximately four and eight divisions, respectively). The rows consist of phase-contrast images (top), CFP fluorescence images (middle), and YFP fluorescence images (bottom).
FIG 6
FIG 6
Comparison of PtorCAD-yfp expression in a strain expressing wild-type TorR and strains expressing constitutively active TorR mutants that bypass TorS. Cultures of MMR125 [PtorCAD-yfp Φ(ompA+-cfp+)], MMR138 [ΔtorS ΔtorT torR146 PtorCAD-yfp Φ(ompA+-cfp+)], and MMR140 [ΔtorS ΔtorT torR149 PtorCAD-yfp Φ(ompA+-cfp+)] were grown aerobically in minimal medium with or without 10 mM TMAO and analyzed by fluorescence microscopy as described in Materials and Methods. (A) Average fluorescence from single cells. Shown are the mean values of two independent experiments, and error bars represent the range. Sets of over 100 single cells were analyzed for each experiment. AU, arbitrary units. (B) Distributions of single-cell fluorescence in samples from wild-type (top panel, 131 cells), torR149 (middle panel, 135 cells), and torR146 (bottom panel, 103 cells.) Values on the x axis are expressed as log10 of fluorescence normalized by the mean value of the corresponding data set.
FIG 7
FIG 7
Effect of extra copies of torS and torT on PtorCAD-yfp reporter expression. Cultures of strains MMR130 [PtorCAD-yfp Φ(ompA+-cfp+)] with plasmids pMR29 and pMR26 (ptorS and ptorT) or with the parent vectors (pSMART and pDSW206) were grown aerobically in minimal medium containing 1 mM IPTG and in the presence or absence of 10 mM TMAO, and analyzed by fluorescence microscopy as described in Materials and Methods. (A) Average fluorescence from single cells. Values are the average fluorescence from two independent experiments, and error bars represent the range of the mean fluorescence from each experiment. Sets of >100 single cells for each condition were analyzed in each experiment. AU, arbitrary units. (B) Distributions of YFP and CFP fluorescence in single cells in samples treated with TMAO. The upper panel represents a strain with both empty vectors (164 cells). The lower panel represents a strain with ptorS and ptorT (164 cells). Values on the x axis are expressed as log10 fluorescence normalized by the mean value of the corresponding data set. The distributions shown in panel B are taken from single experiments and are representative of three independent experiments. Each coefficient of variation (CV = standard deviation/mean) is the mean value of three independent experiments ± the standard deviation.

Comment in

References

    1. Barrett EL, Kwan HS. 1985. Bacterial reduction of trimethylamine oxide. Annu Rev Microbiol 39:131–149. doi:10.1146/annurev.mi.39.100185.001023. - DOI - PubMed
    1. Yancey PH, Clark ME, Hand SC, Bowlus RD, Somero GN. 1982. Living with water stress: evolution of osmolyte systems. Science 217:1214–1222. doi:10.1126/science.7112124. - DOI - PubMed
    1. Zhang AQ, Mitchell SC, Smith RL. 1999. Dietary precursors of trimethylamine in man: a pilot study. Food Chem Toxicol 37:515–520. doi:10.1016/S0278-6915(99)00028-9. - DOI - PubMed
    1. Zeisel SH, daCosta KA, Youssef M, Hensey S. 1989. Conversion of dietary choline to trimethylamine and dimethylamine in rats: dose-response relationship. J Nutr 119:800–804. - PubMed
    1. Treacy EP, Akerman BR, Chow LM, Youil R, Bibeau C, Lin J, Bruce AG, Knight M, Danks DM, Cashman JR, Forrest SM. 1998. Mutations of the flavin-containing monooxygenase gene (FMO3) cause trimethylaminuria, a defect in detoxication. Hum Mol Genet 7:839–845. doi:10.1093/hmg/7.5.839. - DOI - PubMed

Publication types

MeSH terms

LinkOut - more resources