. 2015 Apr 14;112(15):E1936-45.
doi: 10.1073/pnas.1421480112. Epub 2015 Mar 30.

SOX2 primes the epigenetic landscape in neural precursors enabling proper gene activation during hippocampal neurogenesis

Affiliations

SOX2 primes the epigenetic landscape in neural precursors enabling proper gene activation during hippocampal neurogenesis

Alejandro Amador-Arjona et al. Proc Natl Acad Sci U S A. .

Abstract

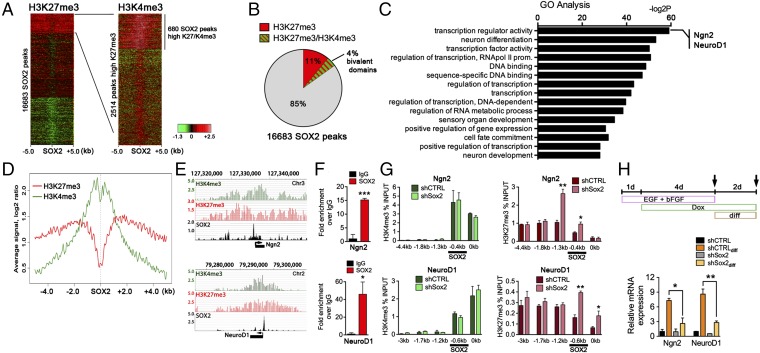
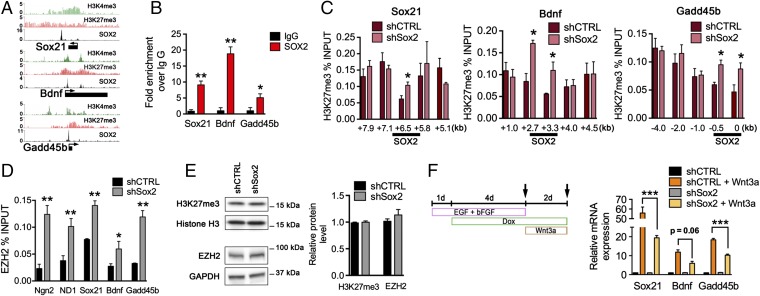
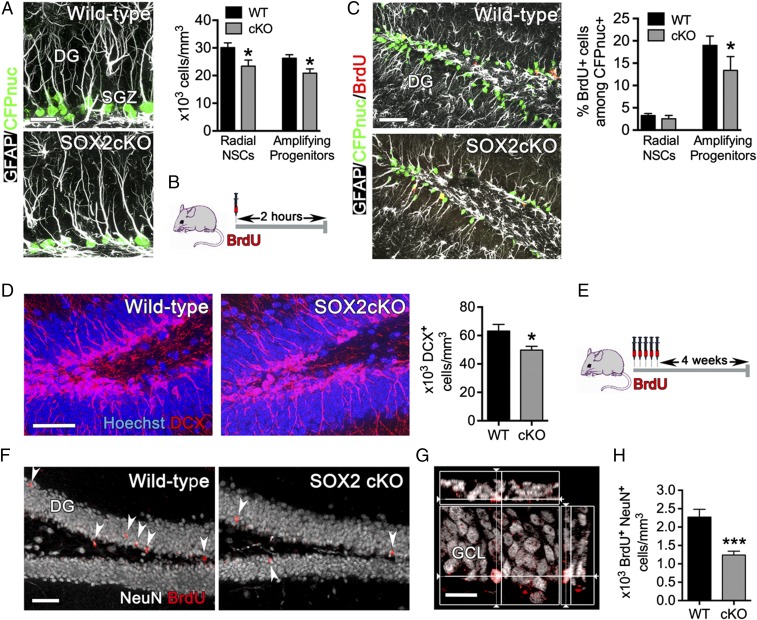
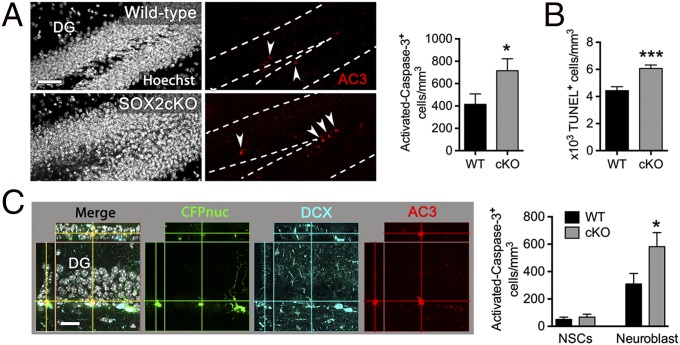
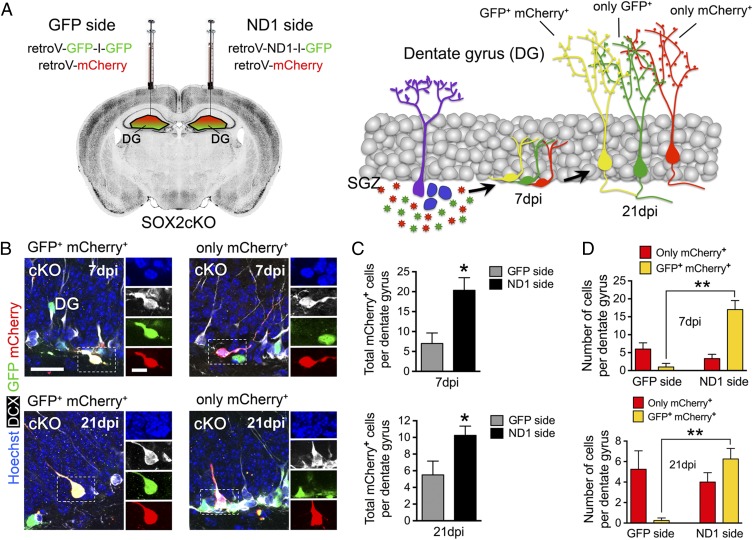
Newborn granule neurons generated from neural progenitor cells (NPCs) in the adult hippocampus play a key role in spatial learning and pattern separation. However, the molecular mechanisms that control activation of their neurogenic program remain poorly understood. Here, we report a novel function for the pluripotency factor sex-determining region Y (SRY)-related HMG box 2 (SOX2) in regulating the epigenetic landscape of poised genes activated at the onset of neuronal differentiation. We found that SOX2 binds to bivalently marked promoters of poised proneural genes [neurogenin 2 (Ngn2) and neurogenic differentiation 1 (NeuroD1)] and a subset of neurogenic genes [e.g., SRY-box 21 (Sox21), brain-derived neurotrophic factor (Bdnf), and growth arrest and DNA-damage-inducible, beta (Gadd45b)] where it functions to maintain the bivalent chromatin state by preventing excessive polycomb repressive complex 2 activity. Conditional ablation of SOX2 in adult hippocampal NPCs impaired the activation of proneural and neurogenic genes, resulting in increased neuroblast death and functionally aberrant newborn neurons. We propose that SOX2 sets a permissive epigenetic state in NPCs, thus enabling proper activation of the neuronal differentiation program under neurogenic cue.

Keywords: SOX2; epigenetics; neurogenesis.


Conflict of interest statement

The authors declare no conflict of interest.

Figures

Fig. 1.
Fig. 1.
SOX2-deficient NPCs show epigenetic repression at promoters of neurogenic genes. (A, Left) Heatmap showing H3K27me3 densities at all 16,683 unique SOX2-binding sites ± 5.0 kb clustered by H3K27m3 occupancy. (Right) Heatmap showing H3K4me3 densities at all 2,514 unique SOX2-binding sites with high density of H3K27me3. Signal is represented by the log2 ratio. Green color indicates a low level; red represents a high level of a mark. Data are from ChIP-seq experiments in mouse NPCs (see Experimental Procedures for details). (B) Percentage of SOX2-binding sites with bivalent chromatin marks (H3K27me3/H3K4me3) within the group with a high density of H3K27me3. (C) Gene Ontology analysis of genes with bivalent chromatin marks and SOX2 binding at their regulatory regions in mouse NPCs. (D) Density profile of H3K27me3 and H3K4me3 at SOX2-binding sites ± 5.0 kb at bivalent domains. (E) ChIP-seq plot of H3K4me3, H3K27me3, and SOX2 at Ngn2 (Upper) and NeuroD1 (Lower) loci in mouse NPCs. (F) SOX2 binding at Ngn2 and NeuroD1 loci in mouse adult hipNPCs. (G) H3K4me3 (Left) and H3K27me3 (Right) levels at regulatory regions of Ngn2 (Lower) and NeuroD1 (Upper) promoters in mouse adult hipNPCs induced with a scrambled shRNA (shCTRL) or an shRNA against Sox2 (shSox2). Highlighted is SOX2 binding at these promoters. (H, Upper) Schematic of a 7-d cell culture protocol used to differentiate SOX2-deficient hipNPCs under neurogenic signals (Wnt3a, 50 ng/mL). (Lower) qRT-PCR analysis of Ngn2 and NeuroD1 gene-expression changes in SOX2cKO and wild-type NPCs under self-renewal or exposure to neurogenic signals (Wnt3a). For all quantifications, data are plotted as the mean ± SEM (*P < 0.05, **P < 0.01, ***P < 0.001).
Fig. 2.
Fig. 2.
Loss of SOX2 Increases polycomb complex PRC2 activity at bivalent genes required for neuronal differentiation. (A) ChIP-seq plot of H3K4me3, H3K27me3, and SOX2 at Sox21, Bdnf, and Gadd45b loci in mouse NPCs. (B) SOX2 binding at Sox21, Bdnf, and Gadd45b loci in mouse adult hipNPCs. (C) H3K27me3 level at regulatory regions of Sox21 (Left), Bdnf (Center), and Gadd45b (Right) loci in mouse adult hipNPCs induced with shCTRL or shSox2. Highlighted is SOX2 binding at these promoters. (D) EZH2 binding in SOX2-binding sites of Ngn2, NeuroD1, Sox21, Bdnf, and Gadd45b loci in mouse hipNPCs. (E) Western blot showing H3K27me3 and EZH2 levels in SOX2-deficient and wild-type hipNPCs. (F, Left) Schematic of a 7-d cell-culture protocol used to differentiate SOX2-deficient hipNPCs under neurogenic signals (Wnt3a). (Right) Quantification of Sox21, Bdnf, and Gadd45b mRNA levels in adult hipNPCs under self-renewal or neurogenic signals (Wnt3a). For all quantifications, data are plotted as the mean ± SEM (*P < 0.05, **P < 0.01, ***P < 0.001).
Fig. 3.
Fig. 3.
Loss of SOX2 in adult hipNPCs reduces the expression of NGN2 and NEUROD1 in early neuroblasts. (A) Graphical representation of the expression of NGN2, NEUROD1, and PROX1 in adult hippocampal neuronal maturation. (B, Left) Sections from 2-mo-old mice were immunostained for NGN2. (Scale bar: 20 µm.) (Right) Quantification results are expressed as the average intensity of NGN2 staining in stem/progenitor (CFPnuc+) cells relative to mature granule neurons. (C, Left) Sections from 2-mo-old mice were immunostained for NEUROD1. (Scale bar: 50 µm.) (Right) Quantification results are expressed as the average intensity of NEUROD1 staining in neuroblasts (DCX+) cells relative to mature granule neurons. (D, Left) Confocal imaging showing colocalization of NEUROD1 in neuroblasts (DCX+) of wild-type and SOX2cKO mice. (Scale bar: 20 µm.) (Right) Quantification results are expressed as the average intensity of NEUROD1 staining in NPCs, early, mid, and late neuroblasts (NB) and neurons (NeuN). For all quantifications, data are plotted as the mean ± SEM (*P < 0.05, **P < 0.01, ***P < 0.001).
Fig. 4.
Fig. 4.
Reduced number of adult hipNPCs and adult newborn neurons in SOX2cKO mice. (A, Left) Sections of the SGZ of the DG from 2-mo-old mice (SOX2cKO and littermate controls) were stained for GFAP and CFPnuc. (Scale bar: 20 µm.) (Right) Quantification of the number of radial NPCs and amplifying progenitors in the SGZ of SOX2cKO and wild-type mice. (B) Protocol for BrdU (100 mg/kg body weight) injection used in 2-mo-old SOX2cKO and wild-type mice. Cells were examined 2 h after injection. (C, Left) Sections from BrdU-injected mice (as in B) were immunostained for BrdU, GFAP, and CFPnuc. (Scale bar: 50 µm.) (Right) The percentage of BrdU+ cells that are radial NPCs or amplifying progenitors was quantified among CFPnuc+ cells. (D, Left) Hippocampal DG sections from 2-mo-old mice (SOX2cKO and the littermate control) were stained for the neuroblast marker DCX. (Scale bar: 50 µm.) (Right) The number of neuroblasts (DCX+ cells) in the DG was analyzed in SOX2cKO and wild-type mice. (E) Protocol for BrdU injection (5 d of twice-daily injections given 12 h apart, at 50 mg/kg body weight) used in 2-mo-old SOX2cKO and wild-type mice. BrdU-labeled cells were examined 4 wk after the last injection. (F) Sections from BrdU-injected mice (as in E) were immunostained for BrdU and NeuN. (Scale bar: 50 µm.) (G) Confocal imaging showing colocalization of a BrdU+ NeuN+ neuron in the GCL. (Scale bar: 20 µm.) (H) Quantification of BrdU+ NeuN+ cells showing reduced neurogenesis in the GCL of the DG in SOX2cKO mice. For all quantifications, data are plotted as the mean ± SEM (*P < 0.05, ***P < 0.001).
Fig. 5.
Fig. 5.
Increase in programmed cell death in SOX2cKO mice. (A, Left) Sections from 2-mo-old mice were immunostained for the apoptotic cell marker AC3. (Scale bar: 50 µm.) The number of apoptotic cells was increased in the SGZ of SOX2cKO mice. (Right) Results are expressed as the number of AC3+ cells within the total volume of the DG. (B) Quantification of TUNEL+ cells in the DG of 2-mo-old mice revealed an increase in the number of apoptotic cells in SOX2cKO mice. (C, Left) Confocal imaging showing an apoptotic neuroblast (colocalization of AC3 and DCX staining). (Scale bar: 25 µm.) (Right) The number of apoptotic neuroblasts is higher in SOX2cKO mice than in wild-type mice. Results are expressed as the number of AC3+ cells within the total volume of the DG. For all quantifications, data are plotted as the mean ± SEM (*P < 0.05, ***P < 0.001).
Fig. 6.
Fig. 6.
NeuroD1 transduction recovers neurogenesis in SOX2cKO mice. (A, Left) Retroviral injections were performed in hippocampal DG of 2-mo-old SOX2cKO mice. One side was injected with a mixture of GFP-IRES-GFP–encoding retrovirus and mCherry-encoding control retrovirus. The other side was injected with a mixture of ND1-IRES-GFP–expressing retrovirus and mCherry-encoding control retrovirus. The same amount of control virus was injected into both sides. (Right) The resulting infected newborn neurons at 7 and 21 dpi. (B) Confocal imaging showing transduced neuroblasts (DCX+) with GFP and mCherry retroviruses (Left) or with only mCherry retrovirus (Right) at 7 and 21 dpi. (Scale bars: 25 µm for merged images and 10 µm for single channels.) (C) Quantification of total mCherry+ (GFP+ mCherry+) and only mCherry+ cells per DG at 7 (Upper) and 21 (Lower) dpi. (D) Quantification of GFP+ mCherry+ and only mCherry+ cells in the GFP and ND1 sides at 7 (Upper) and 21 (Lower) dpi. For all quantifications, data are plotted as the mean ± SEM (*P < 0.05, **P < 0.01).
Fig. 7.
Fig. 7.
SOX2 deficiency leads to abnormal newborn granule neuron maturation. (A) Sample projected confocal images of newborn neurons in the DG at 28 dpi of a retrovirus encoding GFP. (Scale bar: 50 µm.) (B) Quantification of total dendritic length and branching points of GFP+ newborn neurons at 28 dpi. (C) Sample-projected confocal images of dendritic spines of newborn neurons at 28 dpi of a retrovirus expressing mCherry. (Scale bar: 2 µm.) (D) Quantification of the number of spines and the number of mushroom spines of mCherry+ newborn neurons at 28 dpi. (E, Left) Plot of spontaneous excitatory postsynaptic currents (sEPSC) in GFP+ newborn neurons at 42 dpi. (Scale bars: 20 pA and 5 s.) (Right) Quantification results. For all quantifications, data are plotted as the mean ± SEM (*P < 0.05, ***P < 0.001).

References

    1. Deisseroth K, et al. Excitation-neurogenesis coupling in adult neural stem/progenitor cells. Neuron. 2004;42(4):535–552. - PubMed
    1. Ge S, et al. GABA regulates synaptic integration of newly generated neurons in the adult brain. Nature. 2006;439(7076):589–593. - PMC - PubMed
    1. Lai K, Kaspar BK, Gage FH, Schaffer DV. Sonic hedgehog regulates adult neural progenitor proliferation in vitro and in vivo. Nat Neurosci. 2003;6(1):21–27. - PubMed
    1. Jakovcevski M, Akbarian S. Epigenetic mechanisms in neurological disease. Nat Med. 2012;18(8):1194–1204. - PMC - PubMed
    1. Numata S, et al. DNA methylation signatures in development and aging of the human prefrontal cortex. Am J Hum Genet. 2012;90(2):260–272. - PMC - PubMed

Publication types

MeSH terms

Substances

LinkOut - more resources