. 2015 Apr 14;112(15):E1916-25.
doi: 10.1073/pnas.1504576112. Epub 2015 Mar 30.

The circadian oscillator in Synechococcus elongatus controls metabolite partitioning during diurnal growth

Affiliations

The circadian oscillator in Synechococcus elongatus controls metabolite partitioning during diurnal growth

Spencer Diamond et al. Proc Natl Acad Sci U S A. .

Abstract

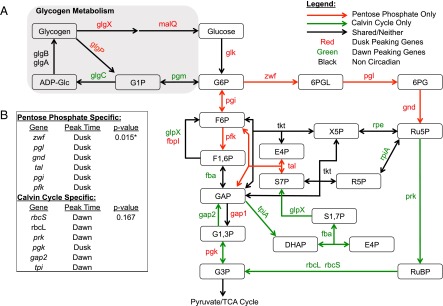
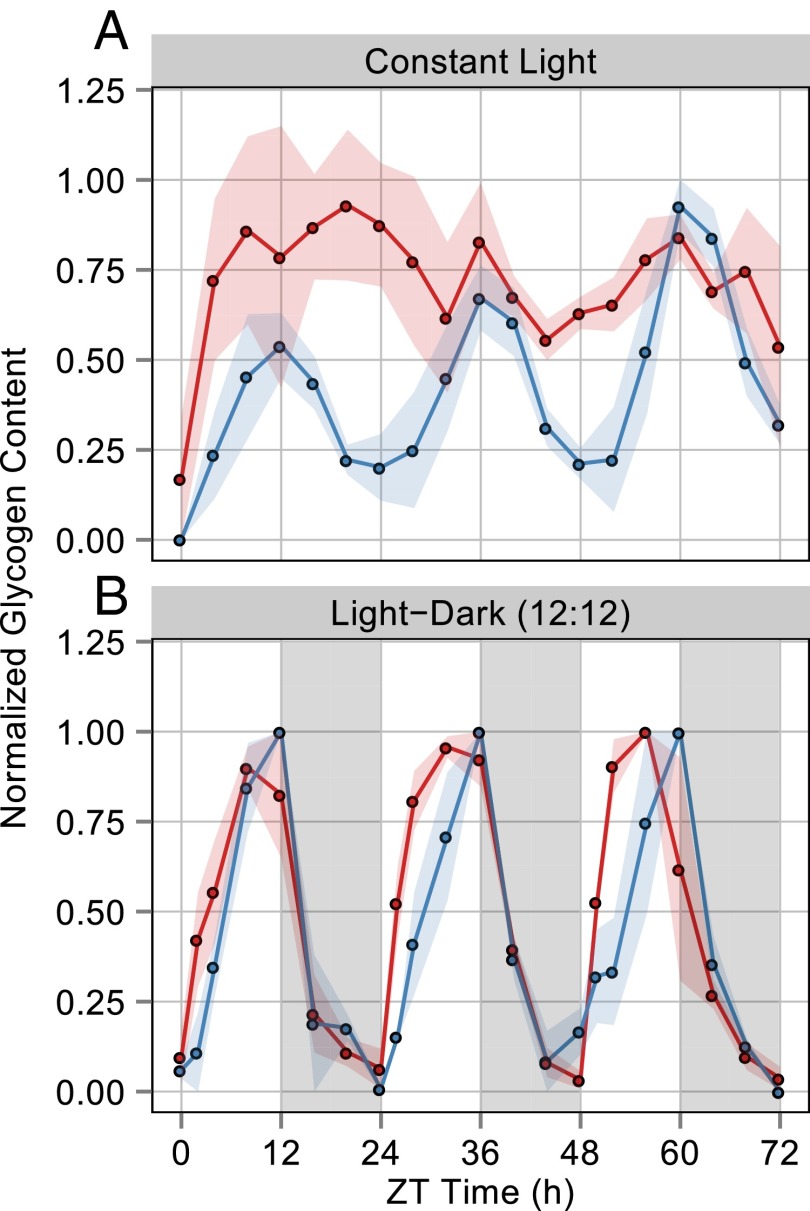
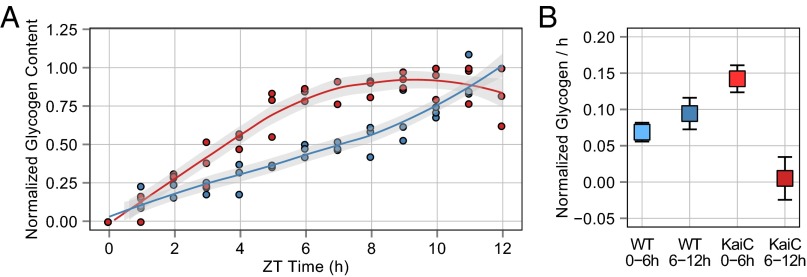
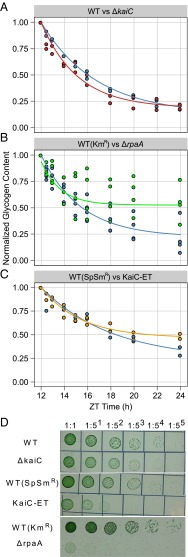
Synechococcus elongatus PCC 7942 is a genetically tractable model cyanobacterium that has been engineered to produce industrially relevant biomolecules and is the best-studied model for a prokaryotic circadian clock. However, the organism is commonly grown in continuous light in the laboratory, and data on metabolic processes under diurnal conditions are lacking. Moreover, the influence of the circadian clock on diurnal metabolism has been investigated only briefly. Here, we demonstrate that the circadian oscillator influences rhythms of metabolism during diurnal growth, even though light-dark cycles can drive metabolic rhythms independently. Moreover, the phenotype associated with loss of the core oscillator protein, KaiC, is distinct from that caused by absence of the circadian output transcriptional regulator, RpaA (regulator of phycobilisome-associated A). Although RpaA activity is important for carbon degradation at night, KaiC is dispensable for those processes. Untargeted metabolomics analysis and glycogen kinetics suggest that functional KaiC is important for metabolite partitioning in the morning. Additionally, output from the oscillator functions to inhibit RpaA activity in the morning, and kaiC-null strains expressing a mutant KaiC phosphomimetic, KaiC-pST, in which the oscillator is locked in the most active output state, phenocopies a ΔrpaA strain. Inhibition of RpaA by the oscillator in the morning suppresses metabolic processes that normally are active at night, and kaiC-null strains show indications of oxidative pentose phosphate pathway activation as well as increased abundance of primary metabolites. Inhibitory clock output may serve to allow secondary metabolite biosynthesis in the morning, and some metabolites resulting from these processes may feed back to reinforce clock timing.

Keywords: circadian clock; cyanobacteria; diurnal; metabolism; metabolomics.


Conflict of interest statement

The authors declare no conflict of interest.

Figures

Fig. 1.
Fig. 1.
Overview of shared metabolic pathways among glycolysis, the OPPP, and the Calvin cycle, as well as the circadian patterns of genes for their enzymatic steps. (A) A diagram of the metabolic pathway which includes overlapping reactions from glycolysis, the OPPP, and the Calvin cycle and overlays the timing of circadian gene expression onto each pathway. Genes exclusively part of the OPPP generally peak at dusk (red), whereas genes exclusively part of the Calvin cycle generally peak at dawn (green). Additionally, glycogen metabolism (gray box) shows a similar pattern in which anabolic genes peak at dawn and catabolic genes peak at dusk. (B) The table indicates the probability of observing the set of coincident peak times strictly by chance. P values were calculated using Fisher’s exact test. 6PG, 6-phosphogluconate; 6PGL, 6-phosphogluconolactone; ADP-Glc, ADP-glucose; DHAP, dihydroxyacetone phosphate; E4P, erythrose-4-phosphate; F1,6P, fructose-1,6-bisphosphate; F6P, fructose-6-phosphate; G1,3P, 1,3-bisphosphoglycerate; G1P, glucose-1-phosphate; G3P, 3-phosphoglycerate; G6P, glucose-6-phosphate; GAP, glyceraldehyde-3-phosphate; R5P, ribose-5-phosphate; Ru5P, ribulose-5-phosphate; RuBP, ribulose-1,5-bisphosphate; S1,7P, sedoheptulose-1,7-bisphosphate; S7P, sedoheptulose-7-phosphate; X5P, xylose-5-phosphate.
Fig. 2.
Fig. 2.
Average of normalized glycogen content in WT (blue) and ΔkaiC (red) strains of S. elongatus over a 72-h period under both LL and LD growth conditions. The area of shaded color around the solid lines represents SEM. ZT0 represents subjective dawn after circadian entrainment (Materials and Methods). (A) Glycogen sampling every 4 h from cells grown in LL for 72 h. The WT strain shows a 24-h rhythm of glycogen content, whereas ΔkaiC has arrhythmic fluctuations. Glycogen was normalized for each biological replicate to the maximum value in that replicate’s 72-h period; the solid line is the average of these values. The experiment was performed in triplicate for each strain. (B) Glycogen sampling every 4 h from cells grown in alternating periods of 12 h light and 12 h darkness; darkness is indicated by the gray bars. Both WT and ΔkaiC strains display a 24-h rhythm of glycogen content. Glycogen was normalized for each biological replicate to the maximum value in that replicate’s 24 h period; the solid line is the average of these values. The experiment was performed in duplicate for WT cells and in triplicate for ΔkaiC.
Fig. 3.
Fig. 3.
Summary of glycogen accumulation data over a 12-h light period collected from WT and ΔkaiC cells growing in a 12:12 LD cycle. (A) Normalized glycogen content from WT (blue circles) and ΔkaiC (red circles) cells collected at 1-h intervals after cells were released into the light. Glycogen content for each replicate was normalized to the maximum value in the 12-h period. The data indicate that ΔkaiC accumulates glycogen more rapidly than WT early in the day. Best-fit curves were calculated for WT (blue line) and ΔkaiC (red line) cells using LOESS regression; the gray shaded area indicates the 95% CI for the regression line. Sampling for each strain was conducted in triplicate. (B) Slope calculated using liner regression of normalized glycogen content for the given time intervals. The glycogen accumulation rate for WT does not significantly differ over the time course, whereas ΔkaiC displays significantly different rates of glycogen accumulation in the first and last 6 h of the day period. The ΔkaiC strain also shows significantly more rapid accumulation than WT in the first 6 h. Error bars indicate the 95% CI of the slope estimate. Each slope was calculated from 18 data points.
Fig. 4.
Fig. 4.
Summary of glycogen degradation data and LD growth phenotypes for WT, ΔkaiC, ΔrpaA, and KaiC-ET strains. Samples for all glycogen degradation rate experiments were collected at 0, 0.5-, 1-, 2-, 3-, 4-, 6-, 8-, and 12-h time points after cells entered a dark period during a 12:12 LD diurnal cycle. Glycogen content for each replicate was normalized to the glycogen value at 12 h after lights on. The best fit for each set of data was modeled using first-order decay and is indicated by a solid line; coefficients are given in the text. (A) Normalized glycogen content from WT (blue circles) and ΔkaiC (red circles). First-order decay model for WT (blue line) and ΔkaiC (red line) indicates that glycogen degradation is similar in these strains. The experiment was performed in duplicate for both strains. (B) Normalized glycogen content from WT (blue circles) and ΔrpaA (green circles). The first-order decay model for WT (blue line) and ΔrpaA (green line) indicates that glycogen degradation is severely attenuated in the ΔrpaA strain. The experiment performed in quadruplicate because of the known high variability in the ΔrpaA strain. (C) Normalized glycogen content from WT (blue circles) and KaiC-ET (orange circles). The first-order decay model for WT (blue line) and KaiC- ET (green line) indicates that glycogen degradation is attenuated in the KaiC-ET strain. The experiment was performed in duplicate. (D) Dilution series of strains grown on solid BG-11 medium for 5–7 d in a 12:12 LD cycle. (Top) WT and ΔkaiC have similar growth kinetics under these conditions. However, KaiC-ET (Middle) and ΔrpaA (Bottom) have severely attenuated growth when grown in a diel cycle. Images are representative of multiple experiments.
Fig. 5.
Fig. 5.
Summary of dimension reduction performed on metabolomics data from WT and ΔkaiC cells grown in a 12:12 LD cycle at the 0-h and 4-h time points after entering light. (A) Plot of PLS-DA components 1 and 2 for all metabolomics samples. Components 1 and 2 account for 55.5% of the variance in the dataset, and, based on these components, all samples show good clustering with biological replicates. The plot indicates that component 1 describes genotype-derived variability, whereas component 2 describes sampling time-derived variability. Ellipses indicate the 95% CI of each grouping of samples on the plot. “W” indicates a WT sample while “K” indicates a ΔkaiC mutant. The letters A, B, and C represent the three biological replicates taken for each sample time point. (B) Loading plot derived from PLS-DA components 1 and 2 indicating the importance of each metabolite to the variability of a given component. Points in red are compounds for which one of the loadings was at least ±0.1. Points in gray are compounds for which no loading was greater than ±0.1. The plot shows that many unknown compounds drive variability in component 1 whereas known and unknown compounds drive variability in component 2.
Fig. 6.
Fig. 6.
Summary of metabolites that differ significantly in the WT and ΔkaiC strains. (A) Scatter plot of metabolites that show a significant change in abundance from 0 h to 4 h in WT, ΔkaiC, or both strains. A significant change of a compound in a strain is indicated by the dot color. The log2 fold change from 0 h to 4 h after entering light is indicated on the x axis for WT and on y axis for ΔkaiC strains. (B) Plot of all metabolites that differ in abundance between WT and ΔkaiC at the 4-h sampling time point. Metabolite bars in red are significantly elevated and metabolite bars in blue are significantly reduced in ΔkaiC relative to WT. Although many primary metabolites are relatively elevated in ΔkaiC strains, all the metabolites in which ΔkaiC is reduced relative to WT are unknown compounds. Some of the unknowns are >100-fold less abundant in ΔkaiC strains. (C) Pathway diagram detailing the interconnections of the OPPP to glycolysis/glycogen metabolism, the Shikimate pathway, and nucleotide metabolism and indicating compounds that were significantly elevated in ΔkaiC relative to WT at the 4-h time point (red). Many of the elevated metabolites share the OPPP as a precursor hub; the monomers of many elevated sugar polymers were elevated also.
Fig. 7.
Fig. 7.
Heatmap of the correlation between the groupings of metabolites identified by ANOVA to have some significant change (TCs) and a filtered set of all detected known compounds (MCs). More intense red color indicates the abundance patterns between two compounds in all collected samples are more positively correlated; more intense blue color indicates a negatively correlated abundance pattern. TC1 and TC2 have similar patterns of correlations across all known compounds, whereas TC3 displays a unique pattern of correlation. Almost all the unknown compounds that are highly abundant in WT and significantly reduced in ΔkaiC can be found in TC3. Thus, TC3 may give metabolic context to the possible placement of these unknown compounds in metabolism.

Similar articles

Cited by

References

    1. Deng MD, Coleman JR. Ethanol synthesis by genetic engineering in cyanobacteria. Appl Environ Microbiol. 1999;65(2):523–528. - PMC - PubMed
    1. Atsumi S, Higashide W, Liao JC. Direct photosynthetic recycling of carbon dioxide to isobutyraldehyde. Nat Biotechnol. 2009;27(12):1177–1180. - PubMed
    1. Schirmer A, Rude MA, Li X, Popova E, del Cardayre SB. Microbial biosynthesis of alkanes. Science. 2010;329(5991):559–562. - PubMed
    1. Kruse O, Hankamer B. Microalgal hydrogen production. Curr Opin Biotechnol. 2010;21(3):238–243. - PubMed
    1. Wijffels RH, Kruse O, Hellingwerf KJ. Potential of industrial biotechnology with cyanobacteria and eukaryotic microalgae. Curr Opin Biotechnol. 2013;24(3):405–413. - PubMed

Publication types

MeSH terms

LinkOut - more resources