. 2015 Apr 14;112(15):4690-5.
doi: 10.1073/pnas.1420068112. Epub 2015 Mar 30.

Revealing the hidden networks of interaction in mobile animal groups allows prediction of complex behavioral contagion

Affiliations

Revealing the hidden networks of interaction in mobile animal groups allows prediction of complex behavioral contagion

Sara Brin Rosenthal et al. Proc Natl Acad Sci U S A. .

Abstract

Coordination among social animals requires rapid and efficient transfer of information among individuals, which may depend crucially on the underlying structure of the communication network. Establishing the decision-making circuits and networks that give rise to individual behavior has been a central goal of neuroscience. However, the analogous problem of determining the structure of the communication network among organisms that gives rise to coordinated collective behavior, such as is exhibited by schooling fish and flocking birds, has remained almost entirely neglected. Here, we study collective evasion maneuvers, manifested through rapid waves, or cascades, of behavioral change (a ubiquitous behavior among taxa) in schooling fish (Notemigonus crysoleucas). We automatically track the positions and body postures, calculate visual fields of all individuals in schools of ∼150 fish, and determine the functional mapping between socially generated sensory input and motor response during collective evasion. We find that individuals use simple, robust measures to assess behavioral changes in neighbors, and that the resulting networks by which behavior propagates throughout groups are complex, being weighted, directed, and heterogeneous. By studying these interaction networks, we reveal the (complex, fractional) nature of social contagion and establish that individuals with relatively few, but strongly connected, neighbors are both most socially influential and most susceptible to social influence. Furthermore, we demonstrate that we can predict complex cascades of behavioral change at their moment of initiation, before they actually occur. Consequently, despite the intrinsic stochasticity of individual behavior, establishing the hidden communication networks in large self-organized groups facilitates a quantitative understanding of behavioral contagion.

Keywords: alarm; behavioral epidemic; escape waves; social influence; swarm.


Conflict of interest statement

The authors declare no conflict of interest.

Figures

Fig. 1.
Fig. 1.
Collective evasion. (A) Six sequential frames 167 ms apart of an escape response cascade in schooling fish, with a school size of 154 fish; color indicates the time of startle initiation, with lines showing the trajectory of startled individuals. (B) Distribution of observed cascade sizes on a log–log scale. (C) Spatial extent of behavioral cascades: the average distance between initiator position and the position of individuals that responded time t after initiation. (D) Average speed of cascade wave propagation, calculated as the change in the spatial extent of the cascade per second, averaged over all cascade events. Data points in C and D show the mean, with error bars for ± the SE.
Fig. 2.
Fig. 2.
Sensory basis of social contagion. (A) Illustration of the angular position relative to heading (θ) and angular area (AA) estimation for a neighboring fish. (B) Metric distance (MD), topological distance (TD), and ranked angular area for two neighboring fish. (C) Probability of an individual’s response as a function of the top predictor, log(metric distance), holding ranked angular area constant. (D) Probability of an individual’s response as a function of the second predictor, ranked angular area, holding log(metric distance) constant. In C and D, the solid blue line is the fit of the model with the top two feature variables to the first responder data, whereas the shaded blue area represents 95% confidence intervals. Histograms above are distributions of first responders in the data, whereas histograms below are distributions of nonresponders.
Fig. 3.
Fig. 3.
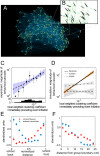
Local weighted clustering coefficient in interaction networks predicts the magnitude of behavioral cascades. (A) Interaction network, where link weights are determined as a function of the log metric distance and ranked angular area. (B) Directedness of the network. Although many links are reciprocal (green), there also exist connections that are much stronger in one direction than the other (yellow/blue). (C) Relationship between weighted directed clustering coefficient of the initiator at the time of cascade initiation and the magnitude of the behavioral cascade, where the black dots show the mean value of all cascade sizes falling in each bin and the error bars show the SE. Data are divided into eight logarithmically spaced bins. The dotted line and blue-shaded region represent the best generalized linear model fit to the data with a log link function and the 95% confidence interval. The histogram below is the distribution of initiator-weighted directed clustering coefficients. (D) Relationship between simulated cascade size and local weighted clustering coefficient for three contagion models (fractional, solid line; numerical, dashed-dotted line; simple, dashed line). Solid and dotted lines are regression fits to the simulated data, whereas shaded regions are 95% confidence intervals. Here, we use the best-fit parameters from each model and simulate behavioral cascades on all nodes in 20 different fish configurations. Model details are provided in SI Appendix. (E) Social influence (red triangles, approximated by weighted directed clustering coefficient) and visual field that extends outside the group (blue squares), plotted against normalized distance from school back to school front, in polarized fish groups (SI Appendix). (F) Same as in E, plotted against distance from group boundary, again calculated for polarized groups. Units in E and F are standardized such that the mean is 0 and SD is 1.

References

    1. Procaccini A, et al. Propagating waves in starling, Sturnus vulgaris, flocks under predation. Anim Behav. 2011;82(4):759–765.
    1. Handegard NO, et al. The dynamics of coordinated group hunting and collective information transfer among schooling prey. Curr Biol. 2012;22(13):1213–1217. - PubMed
    1. Selous E. Thought-Transference (or What?) in Birds. Constable and Company; London: 1931.
    1. Radakov DV. Schooling in the Ecology of Fish. Wiley; New York: 1973.
    1. Treherne JE, Foster WA. Group transmission of predator avoidance behaviour in a marine insect: The Trafalgar effect. Anim Behav. 1981;29(3):911–917.

Publication types

LinkOut - more resources