. 2015 Apr 30;6(12):10102-15.
doi: 10.18632/oncotarget.3546.

Co-activation of PIK3CA and Yap promotes development of hepatocellular and cholangiocellular tumors in mouse and human liver

Affiliations

Co-activation of PIK3CA and Yap promotes development of hepatocellular and cholangiocellular tumors in mouse and human liver

Xiaolei Li et al. Oncotarget. .

Abstract

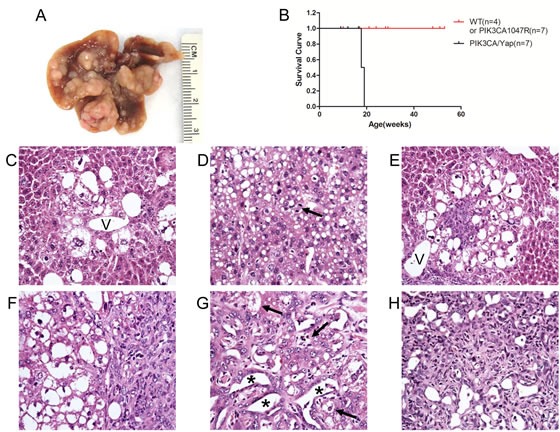
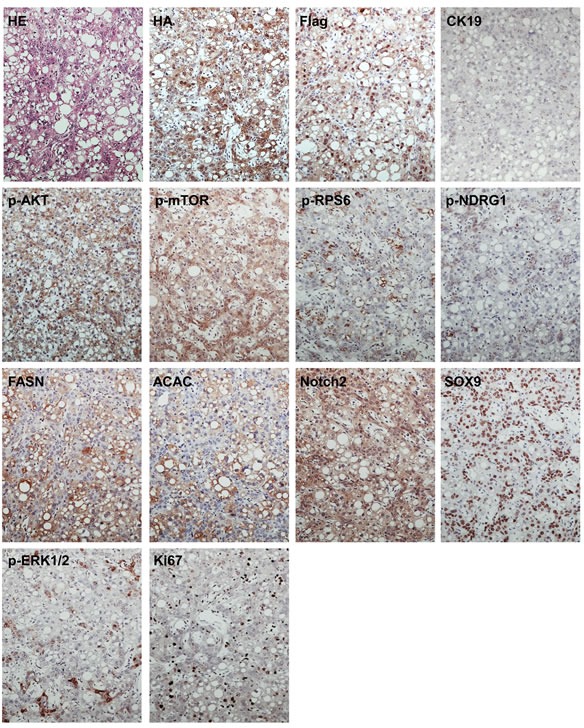
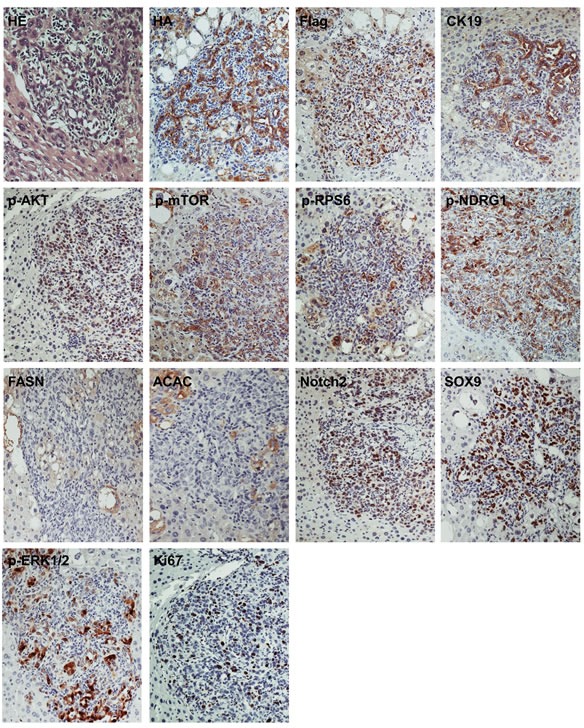
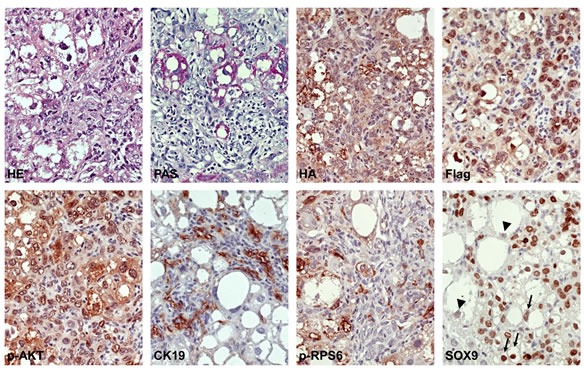
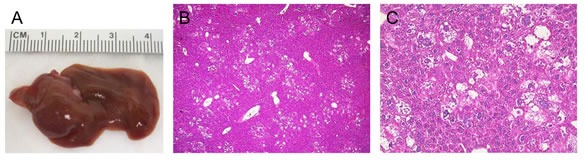
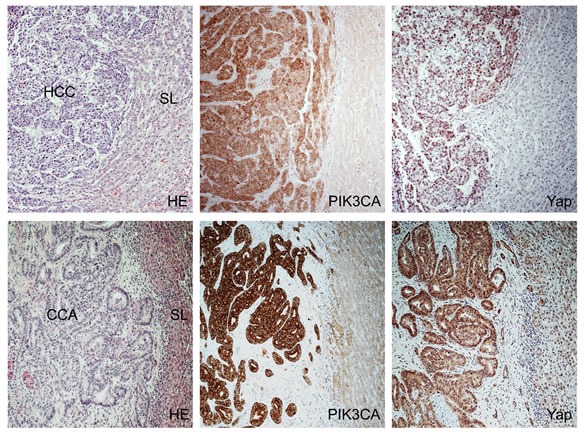
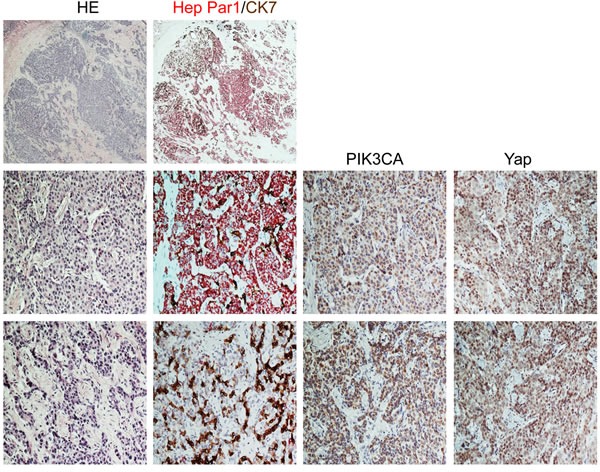
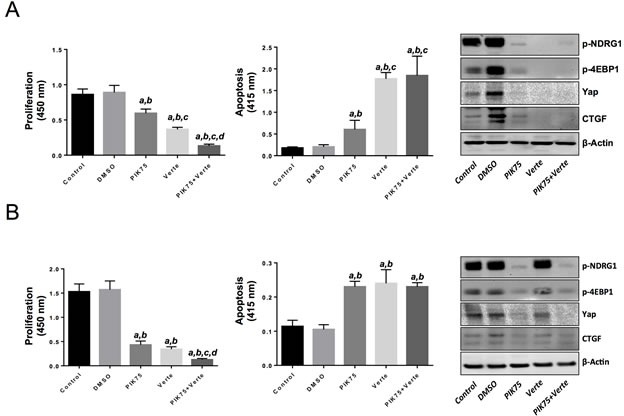
Activation of the PI3K and Yes-associated protein (Yap) signaling pathways has been independently reported in human hepatocellular carcinoma (HCC). However, the oncogenic interactions between these two cascades in hepatocarcinogenesis remain undetermined. To assess the consequences of the crosstalk between the PI3K and Yap pathways along liver carcinogenesis, we generated a mouse model characterized by combined overexpression of activated mutant forms of PIK3CA (PIK3CAH1047R) and Yap (YapS127A) in the mouse liver using hydrodynamic transfection (PIK3CA/Yap). In addition, suppression of PI3K and Yap pathways was conducted in human HCC and cholangiocarcinoma (CCA) cell lines. We found that concomitant activation of PI3K and Yap pathways triggered rapid liver tumor development in mice. Histologically, tumors were pure HCC, CCA, or mixed HCC/CCA. At the molecular level, PIK3CA/Yap tumors were characterized by activation of the mTORC1/2, ERK/MAPK, and Notch pathways. Simultaneous activation of PI3K and Yap pathways frequently occurred in human liver tumor specimens and their combined suppression was highly detrimental for the growth of HCC and CCA cell lines. In conclusion, our study demonstrates the oncogenic cooperation between PI3K and Yap pathways along liver carcinogenesis. The PIK3CA/Yap mouse represents an important preclinical liver tumor model for the development of novel therapeutics against this malignancy.

Keywords: HCC; Hippo; PI3K; cholangiocarcinoma; liver tumor.


Conflict of interest statement

Conflict of interest

The authors have declared that no competing interests exist.

Figures

Figure 1
Figure 1. Histologic features of liver tumors developed in PIK3CA/Yap mice as assessed by H&E staining
(A) Macroscopic appearance of livers from mice injected wih PIK3CAH1047R and YapS127A (PIK3CA/Yap) mice. (B) Kaplan Meier survival curve of wild-type (WT), PIK3CA1047R and PIK3CA/Yap mouse cohort. (C) Preneoplastic lesion consisting of lipid-rich ballooned hepatocytes located around a hepatic vein (V). (D) Pure hepatocellular carcinoma (HCC) characterized by solid and trabecular growth of mildly atypical lipid-rich neoplastic hepatocytes. The arrow indicates a mitosis. (E) Small mixed tumor consisting of both hepatocellular and cholangiocellular components. The hepatocellular part of the tumor consists of large, lipid-rich cells, mainly situated in the outer part of the tumor. Smaller cells with a high nuclear:cytoplasmic ratio, located in the core of the lesion, constitute the cholangiocellular part of the tumor. (F) Mixed HCC/cholangiocarcinoma (CCA) tumor displaying the presence of the hepatocellular component (left part of the picture) that is adjacent to the cholangiocellular component (right part of the picture). (G) Mixed HCC/CCA tumor with hepatocellular and cholangiocellular constituents intermingled with each other, showing moderate cellular atypia and a limited stroma component. The cholangiocellular component forms duct-like structures (asterisks), whereas the hepatocellular component consists of altered, lipid-rich hepatocytes (indicated by arrows). (H) Pure CCA showing significant cellular atypia. Original magnification: 400X.
Figure 2
Figure 2. Molecular characterization of hepatocellular tumors developed in PIK3CA/Yap mice
These tumors are homogeneously immunoreactive for HA-tagged PIK3CAH1047R (HA) and Flag-tagged Yap (Flag), implying their origin from doubly-transfected cells. The low/absent immunoreactivity for CK19 confirms their hepatocellular nature. These tumors exhibit strong activation of PI3K/AKT/mTOR pathway, as indicated by levels of phosphorylated/activated (p-AKT) and its downstream effectors, including phosphorylated/activated mTOR (p-mTOR), fatty acid synthase (FASN), acetyl-CoA carboxylase (ACAC), and phosphorylated/activated ribosomal protein S6 (p-RPS6), whereas immunolabeling for phosphorylated N-Myc downregulated gene 1 (p-NDGR1), a surrogate marker of mTORC2 activation, is weak. Hepatocellular tumors also displayed a remarkable, homogeneous activation of the Notch cascade, as indicated by the strong immunoreactivity for Notch2 and its downstream effector, SOX9. In addition, these tumors showed activation of Ras/MAPK pathway, as underscored by spotty immunolabeling for phosphorylated/activated ERK1/2 (p-ERK1/2) proteins. The moderate proliferative activity of these lesions is indicated by positive immunolabeling for Ki67. Serial sections of a hepatocellular tumor are shown as an example in the present figure. Original magnification: 100X Abbreviation: HE, hematoxylin and eosin staining.
Figure 3
Figure 3. Molecular characterization of cholangiocellular tumors developed in PIK3CA/Yap mice
Similar to pure hepatocellular carcinomas (HCC) developed in these mice, cholangiocellular tumors are homogeneously immunoreactive for HA-tagged PIK3CAH1047R (HA) and Flag-tagged Yap (Flag), implying their origin from doubly-transfected cells. The strong immunoreactivity for CK19 confirms their cholangiocellular differentiation. These tumors exhibit strong activation of PI3K/AKT/mTOR pathway, as indicated by elevated levels of phosphorylated/activated (p-AKT) and its downstream effectors, including phosphorylated/activated mTOR (p-mTOR) and phosphorylated N-Myc downregulated gene 1 (p-NDGR1), a surrogate marker of mTORC2 activation, whereas immunoreactivity for fatty acid synthase (FASN), acetyl-CoA carboxylase (ACAC), and phosphorylated/activated ribosomal protein S6 (p-RPS6) is limited. These tumors also displayed a marked activation of the Notch cascade, as indicated by the strong immunolabeling for Notch2 and its downstream effector, SOX9. The activation of the Ras/MAPK pathway is underscored by the immunoreactivity for phosphorylated/activated ERK1/2 (p-ERK1/2) proteins, while the proliferative activity of these lesions is indicated by the positive immunolabeling for Ki67. Serial sections of a cholangiocellular tumor are shown as an example in the present figure. Original magnification: 200X. Abbreviation: HE, hematoxylin and eosin staining.
Figure 4
Figure 4. Molecular features of mixed hepatocellular/cholangiocellular tumors developed in PIK3CA/Yap mice
The hepatocellular and cholangiocellular components are depicted in the left and right part of the pictures, respectively. Note that the hepatocellular component is rich in glycogen, as indicated by the PAS reaction, whereas the cholangiocellular counterpart is depleted of glycogen. These tumors are homogeneously immunoreactive for HA-tagged PIK3CA1047R (HA) and Flag-tagged Yap (Flag), indicating their origin from doubly-transfected cells. As expected, CK19 immunolabeling was detected only in the cholangiocellular fraction of the mixed tumor. Of note, levels of phosphorylated/activated ribosomal protein S6 (p-RPS6) were elevated only in the hepatocellular component, whereas immunoreactivity for SOX9 (a marker of Notch cascade activation) was evident both in the hepatocellular and cholangiocellular component. While the malignant cells with cholangiocellular features were homogeneously positive for SOX9, the hepatocellular neoplastic component consisted of cells with moderate to strong immunoreactivity (arrows) and others with weak immunolabeling (arrowheads) for this protein. Original magnification: 400X Abbreviation: HE, hematoxylin and eosin staining; PAS, periodic acid-Schiff reaction.
Figure 5
Figure 5. Combined injection of PIK3CAH1047R and a mutant form of Yap that does not bind TEAD transcription factors (YapS127AS94A) abolishes tumor development in mice
(A) Macroscopic appearance of livers from PIK3CA/YapS127AS94A mice 13 weeks post hydrodynamic injection. (B and C) Lower (B) and higher (C) magnification of PIK3CAH1047R/YapS127AS94A mouse liver showing the absence of tumors, as assessed by Hematoxylin and eosin staining. At higher magnification, the presence of lipid-rich hepatocytes resembling those occurring in mice injected only with PIK3CAH1047R is appreciable. Original magnification: 40X in B; 200X in C.
Figure 6
Figure 6. Immunohistochemical patterns of PIK3CA and Yap in human hepatocellular carcinoma (HCC) and cholangiocarcinoma (CCA)
Upper panel: stronger immunoreactivity for PIK3CA as well as upregulation of Yap and its increased nuclear accumulation in a HCC (left part of the picture) with a pseudoglandular phenotype when compared to the non-neoplastic surrounding liver (SL; right part of the picture). Lower panel, upregulation of PIK3CA and total and nuclear levels of Yap in a CCA (left part of the figure) when compared with the non-tumorous counterpart (right part of the picture). Abbreviations: CCA, cholangiocarcinoma; HCC, hepatocellular carcinoma; HE, hematoxylin and eosin staining; SL, surrounding liver. Original magnification: 100X.
Figure 7
Figure 7. Immunohistochemical patterns of PIK3CA and Yap in a mixed human hepatocellular carcinoma (HCC)/cholangiocarcinoma (CCA)
Upper panel: the tumor exhibits areas with strong immunoreactivity for Hep Par1 (a hepatocellular marker, stained in red) intermingled with other areas positive for CK7 (a cholangiocellular marker, stained in brown) immunohistochemistry. Middle panel: Area of the mixed human HCC/CCA with mainly hepatocellular differentiation (as indicated by the large prevalence of Hep Par1 positive cells over those displaying CK7 immunoreactivity) shows strong immunolabeling for both PIK3CA and Yap proteins, with the latter mainly localized in the nucleus of malignant cells. Lower panel: Area of the same tumor with predominant cholangiocellular featues (as demonstrated by the strong CK7 staining) exhibiting a homogeneous and pronounced immunoreactivity for PIK3CA and Yap proteins. Abbreviations: CCA, cholangiocarcinoma; HCC, hepatocellular carcinoma; HE, hematoxylin and eosin staining. Original magnification: 20X in upper panel; 200X in middle and lower panel.
Figure 8
Figure 8. Suppression of PIK3CA and Yap activity via specific inhibitors is highly detrimental for the growth of human HLF hepatocellular carcinoma (HCC) cell line and the human EGI1 cholangiocarcinoma (CCA) cell line
(A) Treatment with the PIK3CA inhibitor, PIK75 (1 μM), or the Yap/TEAD disruptor, Verteporfin (Verte; 2 μM) decreased proliferation (left panel) and induced apoptosis (center panel) in the HLF HCC cell line when compared with control (untreated) and DMSO (solvent) treated cells. Of note, combined administration of PIK75 and Verteporfin further decreased the proliferation rate of HLF cells without further augmenting apoptosis. The effects of PIK75 and Verteporfin treatment on PIK3CA targets (phosphorylated-NDRG1 and phosphorylated/inactivated 4EBP1) as wells as on Yap and its effector, CTGF, in HLF cells were assessed by Western blot analysis (right panel). (B) A similar growth restraint patterns as those described in (A) was also detected when the EGI1 CCA cell line was subjected to the administration of the two inhibitors, either alone or in combination. Once again, the additive effects of the two drugs affected only the proliferation rate but not the apoptosis activity in EGI1 cells. The effects of PIK75 and Verteporfin treatment on PIK3CA targets (phosphorylated-NDRG1 and phosphorylated/inactivated 4EBP1) as wells as on Yap and its effector, CTGF, in EGI1 cells were assessed by Western blot analysis (right panel). Each bar represent mean ± SD of three independent experiments conducted in triplicate. Tukey-Kramer's test: P at least < 0.001 a, versus control (untreated cells); b, versus DMSO (solvent); c, versus PIK75; d, versus Verteporfin. Abbreviation: Verte, Verteporfin.

References

    1. Siegel RL, Miller KD, Jemal A. Cancer statistics, 2015. CA Cancer J Clin. 2015 - PubMed
    1. Rizvi S, Gores GJ. Pathogenesis, diagnosis, and management of cholangiocarcinoma. Gastroenterology. 2013;145:1215–1229. - PMC - PubMed
    1. Bosch FX, Ribes J, Diaz M, Cleries R. Primary liver cancer: worldwide incidence and trends. Gastroenterology. 2004;127(5) Suppl 1:S5–S16. - PubMed
    1. Mo JS, Park HW, Guan KL. The Hippo signaling pathway in stem cell biology and cancer. EMBO Rep. 2014;15:642–656. - PMC - PubMed
    1. Pan D. The hippo signaling pathway in development and cancer. Dev Cell. 2010;19:491–505. - PMC - PubMed

Publication types

MeSH terms