. 2015 May 10;6(13):11009-22.
doi: 10.18632/oncotarget.3557.

Leucine-rich α-2-glycoprotein promotes TGFβ1-mediated growth suppression in the Lewis lung carcinoma cell lines

Affiliations

Leucine-rich α-2-glycoprotein promotes TGFβ1-mediated growth suppression in the Lewis lung carcinoma cell lines

Norihiko Takemoto et al. Oncotarget. .

Abstract

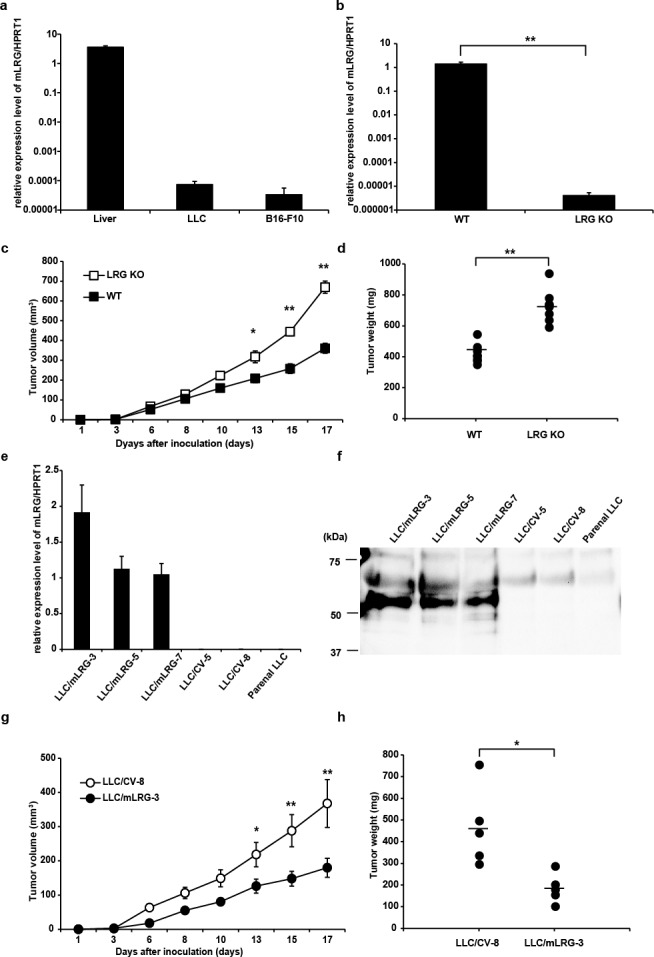
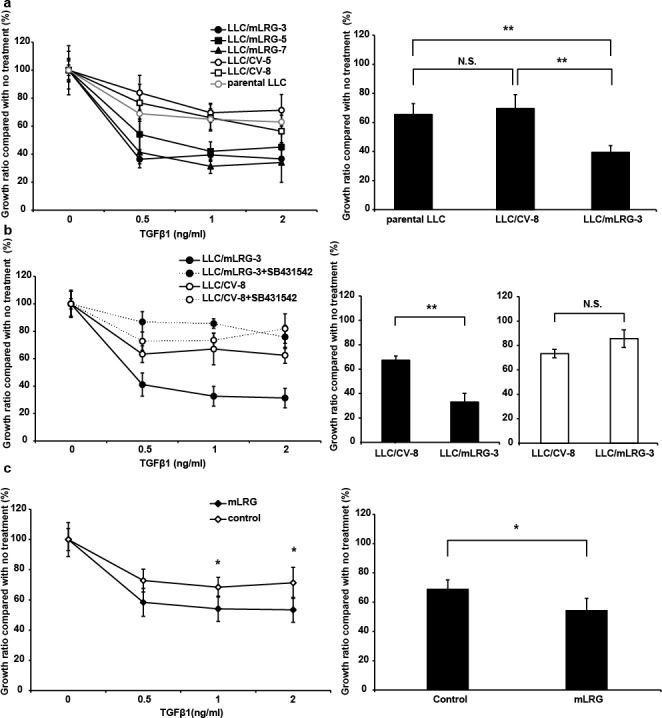
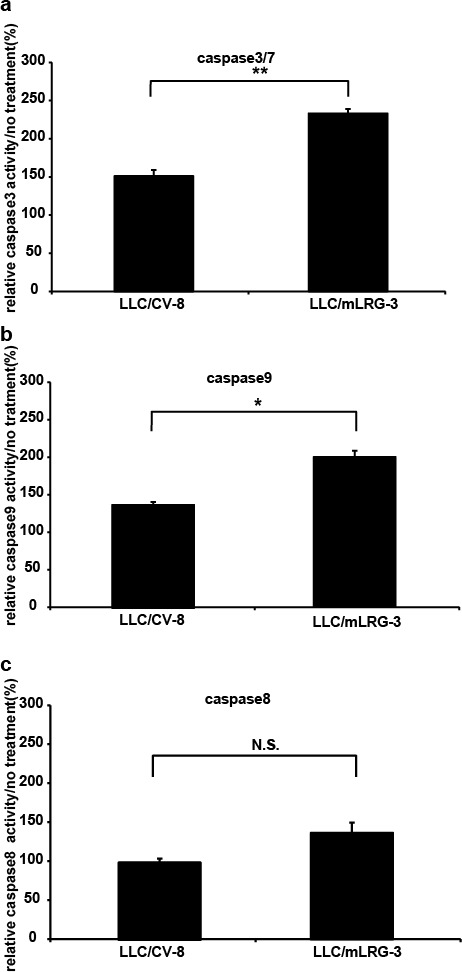
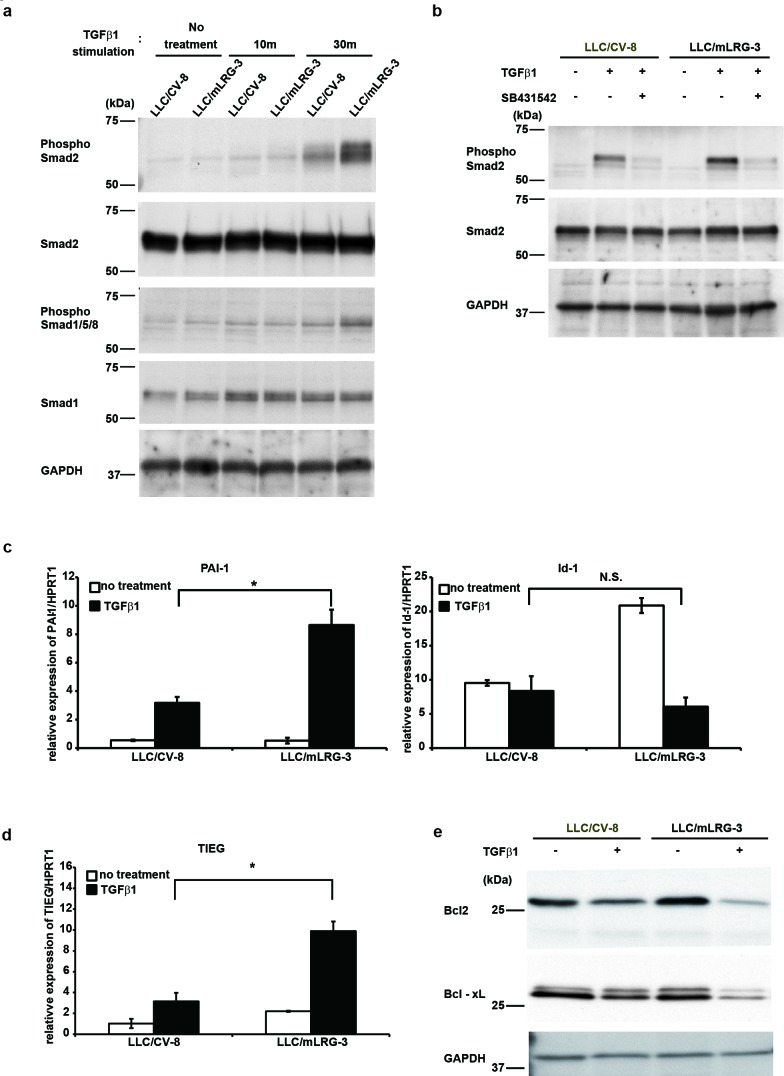
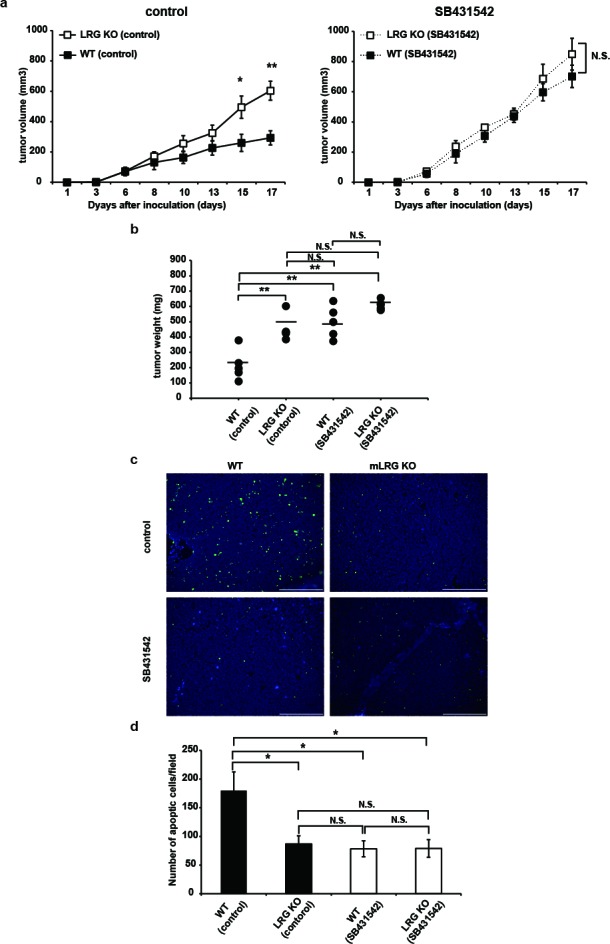
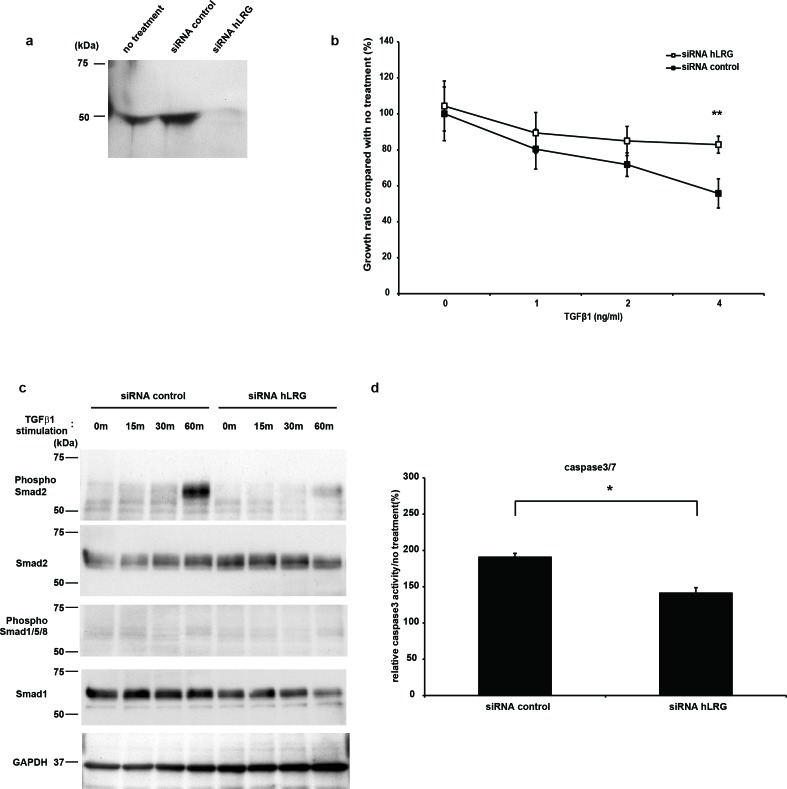
Leucine-rich α2-glycoprotein (LRG) is an approximately 50-kDa glycoprotein that has been found to be elevated in the sera of patients with several types of cancer. LRG directly binds to transforming growth factor beta 1 (TGFβ1) and modulates TGFβ1 signaling in endothelial cells; however, the precise function of LRG in cancer remains unclear. This study aimed to investigate the role of LRG in cancer. Lewis lung carcinoma (LLC) cells hardly expressed LRG. The growth of LLC tumors allografted in the LRG knockout (KO) mice was significantly increased compared with wild-type (WT) mice. Conversely, overexpression of LRG significantly inhibited the growth of LLC tumors in WT mice. In the presence of LRG, TGFβ1 significantly inhibited the proliferation of LLC cells and human hepatocellular carcinoma Hep3B cells in vitro by inducing apoptosis via the potent activation of smad2 and its downstream signaling pathway. Furthermore, administration of a TGFβR1 inhibitor (SB431542) significantly enhanced the growth of LLC tumors in WT mice compared with LRG KO mice via inhibition of apoptosis. We propose that LRG potentiates the effect of TGFβ1 in cancer cells whose growth is suppressed in the presence of TGFβ1.

Keywords: Lewis lung carcinoma; TGFβ; apoptosis; leucine-rich α-2-glycoprotein; smad signal transduction.


Conflict of interest statement

Conflict of Interest

The authors declare no conflicts of interest regarding the contents of this manuscript.

This work was supported by the Health and Labour Sciences Research Grants for Research on Development of New Drugs from the Ministry of Health, Labour and Welfare of Japan (H24-bio-ippan-002).

Figures

Figure 1
Figure 1. Tumor growth of LLC cells was inhibited in the presence of LRG in vivo
a. Quantitative real-time PCR analysis of mLRG mRNA expression in mouse liver, LLC cells, and B16-F10 cells. Quantitative real-time PCR threshold values for target genes were normalized against the level of HPRT1. b. Quantitative real-time PCR analysis of mLRG mRNA expression in the LLC tissue of WT and LRG KO mice. Quantitative real-time PCR threshold values for target genes were normalized against the level of HPRT1. Each value is the average ± standard deviation. c. Tumor growth curves of LLC cells on subcutaneous injection into LRG KO mice or WT C57BL/6J mice (n = 8 for each group). d. Tumor weight on day 17 after implantation of LLC cells (n = 8). Data are presented as mean ± standard error of the mean. e,f. Western blot analysis of mLRG expression in the supernatant and quantitative real-time PCR analysis of mLRG mRNA levels in mLRG-overexpressing LLC clones (LLC/mLRG-3,5,7), control vector LLC clones (LLC/CV-5,8) and parental LLC cells. Quantitative real-time PCR threshold values for target genes were normalized against the level of HPRT1. Each value is the average ± standard deviation. g. Growth curves of control vector LLC (LLC/CV-8) and mLRG-overexpressing LLC (LLC/mLRG-3) cells implanted in WT C57BL/6J mice (n = 5 for each group). h. Tumor weight on day 17 after implantation of LLC/mLRG-3 and LLC/CV-8 cells (n = 5). Data are presented as mean ± standard error of the mean. * P < 0.05, **P < 0.01.
Figure 2
Figure 2. TGFβ1 inhibited the proliferation of mLRG-overexpressing LLC cells more effectively than that of control vector LLC cells
a. The left panel shows the growth curves of mLRG-overexpressing LLC (LLC/mLRG-3,5,7), control vector LLC (LLC/CV-5,8), and parental LLC cells treated with TGFβ1. Cells were cultivated in the presence of TGFβ1 (0–2 ng/mL). After culture for 72 h, viable cell numbers were counted using the WST-8 assay. The right panel shows the viability of LLC/mLRG-3, LLC/CV-8, and parental LLC cells after treatment with 1.0 ng/mL of TGFβ1 for 72 h. b. The left panel shows the growth curves of mLRG-overexpressing LLC (LLC/mLRG-3) and control vector LLC (LLC/CV-8) cells treated with TGFβ1 and TGFβR1 inhibitor. Cells were cultured in the presence of TGFβ1 (0–2 ng/mL) with DMSO or a TGFβR1 inhibitor, SB431542 (10 μM). After culture for 72 h, viable cell numbers were counted using the WST-8 assay. The right panel shows the viability of LLC/mLRG-3 and LLC/CV-8 cells after treatment with 1.0 ng/mL of TGFβ1 with (black bar) or without (white bar) SB431542 (10 μM) for 72 h. c. The left panel shows the growth curves of parental LLC cells treated with TGFβ1 (0–2 ng/mL) combined with recombinant mLRG (10 μg/mL) from LLC/mLRG-3 cells or purified products from LLC/CV-8 cells. After culture for 72 h, viable cell numbers were counted using the WST-8 assay. Each value is the average ± standard deviation. The right panel shows the viability of parental LLC cells after treatment with 1.0 ng/mL of TGFβ1 for 72 h. Each value is the average ± standard deviation. * P < 0.05, **P < 0.01.
Figure 3
Figure 3. Stimulation with TGFβ1 induced apoptosis more strongly in mLRG-overexpressing LLC cells than in control vector LLC cells
Caspase-3/7, caspase-8, and caspase-9 activities in LLC/mLRG-3 and LLC/CV-8 cells after treatment with TGFβ1. (a,b,c) Cells were cultivated in 96-well plates and treated with TGFβ1 (1.0 ng/mL) for 24 h. Caspase-3/7 activity was measured with a caspase-3/7 luminescent assay kit (Casapase-GloTM). Similarly, caspase-8 and caspase-9 activities were measured using a caspase-8 and caspase-9 luminescent assay kit (Casapase-GloTM). Each relative value (TGFβ1 treatment/no treatment) is the average ± standard deviation. * P < 0.05, **P < 0.01.
Figure 4
Figure 4. TGFβ1 enhanced the smad2 signaling pathway in mLRG-overexpressing LLC
a. Western blot analysis shows the phosphorylation of smad2 and smad1/5/8 in LLC/mLRG-3 and LLC/CV-8 cells treated with TGFβ1. After 6 h of serum starvation, cells were treated with or without TGFβ1 (1.0 ng/mL) for 10 or 30 min. b. Western blot analysis shows the phosphorylation of smad2 in LLC/mLRG-3 and LLC/CV-8 cells treated with or without SB431542 (10 μM) and TGFβ1. Cells were treated with SB431542 (10 μM) or DMSO (vehicle) for 3 h and with TGFβ1 (1.0 ng/mL) for 30 min. c. Quantitative real-time PCR analysis shows PAI-1 gene and Id-1 gene expression with or without stimulation with TGFβ1 (1.0 ng/mL) for 3 h in LLC/mLRG-3 and LLC/CV-8 cells after 6 h of serum starvation. Quantitative real-time PCR threshold values for the target genes were normalized against the level of HPRT1. d. Quantitative real-time PCR analysis shows TIEG gene expression with or without stimulation with TGFβ1 (1.0 ng/mL) for 3 h in LLC/mLRG-3 and LLC/CV-8 cells after 6 h of serum starvation. Quantitative real-time PCR threshold values for the target genes were normalized against the level of HPRT1. e. Western blot analysis shows Bcl-2 and Bcl-xL protein in LLC/mLRG-3 and LLC/CV-8 cells treated with TGFβ1. Cells were cultured in 6-well plates with or without stimulation with TGFβ1 (1.0 ng/mL). After culture for 24 h, cell lysates were collected. Each value is the average ± standard deviation. *P < 0.01.
Figure 5
Figure 5. TGFβR1 inhibitor abrogated tumor growth inhibition in WT mice more effectively than that in LRG KO mice
a. growth curves of LLC cells on subcutaneous injection into LRG KO mice or WT mice treated with SB431542 (10 mg/kg/week three times intraperitoneally) or vehicle control (n = 5 for each group). Solid lines represent control vehicle-treated groups and dashed lines represent SB431542-treated groups. b. Tumor weight of each group on day 17 after LLC cell inoculation (n = 5). c. TUNEL staining in LLC tumor sections from LRG KO or WT mice treated with SB431542 or vehicle control. Scale bar = 200 μm. d. Quantitative evaluation of TUNEL-positive cells in LLC tumors (five random fields of five independent tumor sections). Data are presented as mean ± standard error of the mean *P < 0.05, **P < 0.01.
Figure 6
Figure 6. LRG was expressed in the supernatant of Hep3B, and TGFβ1-induced apoptosis was decreased in the absence of LRG
a. Western blot analysis of hLRG expression in the supernatant of Hep3B. The supernatant was recovered from Hep3B cells transfected with hLRG siRNA or control siRNA for 24 h and expression of hLRG was assessed by western blot analysis. b. The growth curves of Hep3B with control siRNA and hLRG siRNA by stimulation with TGFβ1. After siRNA transfection, cells were cultivated in the presence of TGFβ1 (0–4 ng/mL). After culture for 72 h, viable cell numbers were counted using the WST-8 assay. c. Western blot analysis shows the phosphorylation of smad2 and smad1/5/8 in control siRNA or hLRG siRNA-transfected Hep3B cells treated with TGFβ1. After 4 h of transfection, cells were treated with TGFβ1 (4.0 ng/mL) for 0, 15, 30, or 60 min. d. Caspase-3/7 activity in control siRNA or hLRG siRNA-transfected Hep3B cells after treatment with TGFβ1. Cells were transfected with control siRNA or hLRG siRNA and subsequently treated with TGFβ1 (4.0 ng/mL) for 24 h in 96-well plates. Caspase-3/7 activity was measured using the caspase-3/7 luminescent assay kit (Casapase-GloTM). Each relative value (TGFβ1 treatment/no treatment) is the average ± standard deviation. **P < 0.01.

References

    1. Haupt H, Baudner S. [Isolation and characterization of an unknown, leucine-rich 3. 1-S-alpha2-glycoprotein from human serum (author's transl)] Hoppe Seylers Z Physiol Chem. 1977;358:639–646. - PubMed
    1. Takahashi N, Takahashi Y, Putnam FW. Periodicity of leucine and tandem repetition of a 24-amino acid segment in the primary structure of leucine-rich alpha 2-glycoprotein of human serum. Proc Natl Acad Sci U S A. 1985;82:1906–1910. - PMC - PubMed
    1. Kobe B, Kajava AV. The leucine-rich repeat as a protein recognition motif. Curr Opin Struct Biol. 2001;11:725–732. - PubMed
    1. O'Donnell LC, Druhan LJ, Avalos BR. Molecular characterization and expression analysis of leucine-rich alpha2-glycoprotein, a novel marker of granulocytic differentiation. J Leukoc Biol. 2002;72:478–485. - PubMed
    1. Shirai R, Hirano F, Ohkura N, Ikeda K, Inoue S. Up-regulation of the expression of leucine-rich alpha(2)-glycoprotein in hepatocytes by the mediators of acute-phase response. Biochem Biophys Res Commun. 2009;382:776–779. - PMC - PubMed

Publication types

MeSH terms