

The attenuated hepatocellular carcinoma-specific Listeria vaccine Lmdd-MPFG prevents tumor occurrence through immune regulation of dendritic cells
- PMID: 25826093
- PMCID: PMC4496186
- DOI: 10.18632/oncotarget.3558
The attenuated hepatocellular carcinoma-specific Listeria vaccine Lmdd-MPFG prevents tumor occurrence through immune regulation of dendritic cells
Erratum in
-
Correction: The attenuated hepatocellular carcinoma-specific Listeria vaccine Lmdd-MPFG prevents tumor occurrence through immune regulation of dendritic cells.Oncotarget. 2022 Jan 31;13:271-272. doi: 10.18632/oncotarget.28154. eCollection 2022. Oncotarget. 2022. PMID: 35111282 Free PMC article.
Abstract
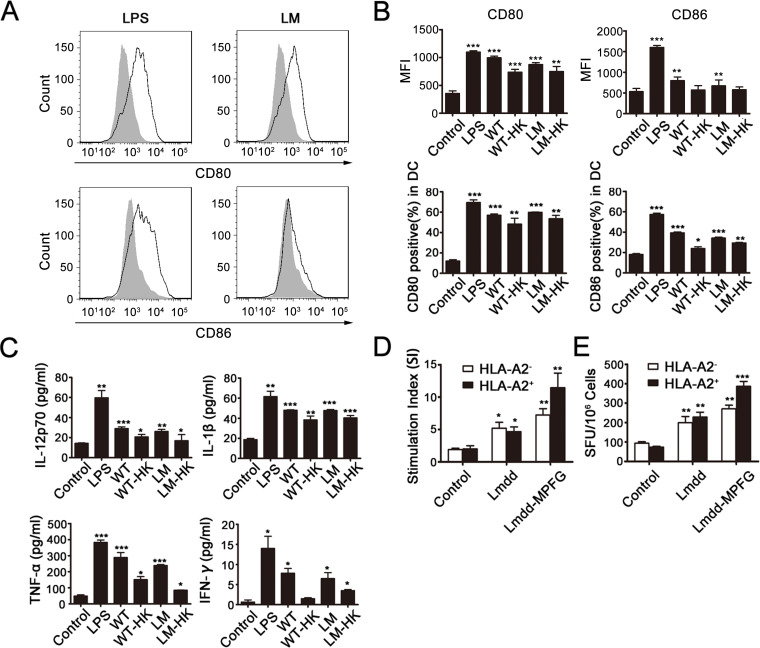
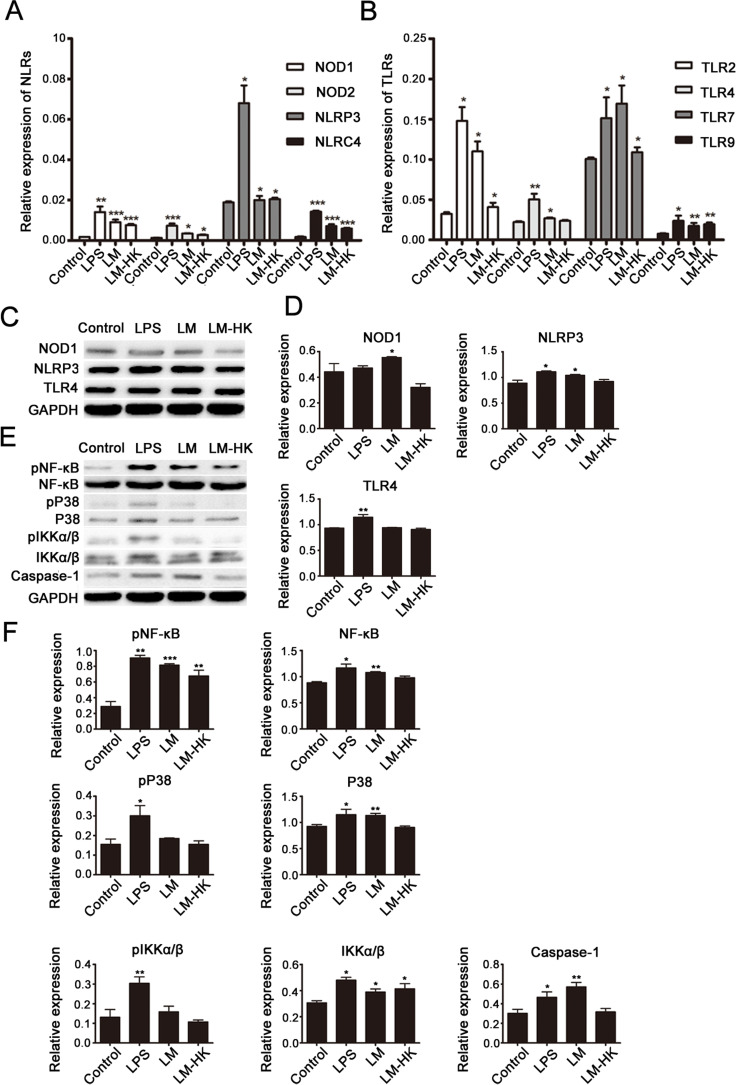
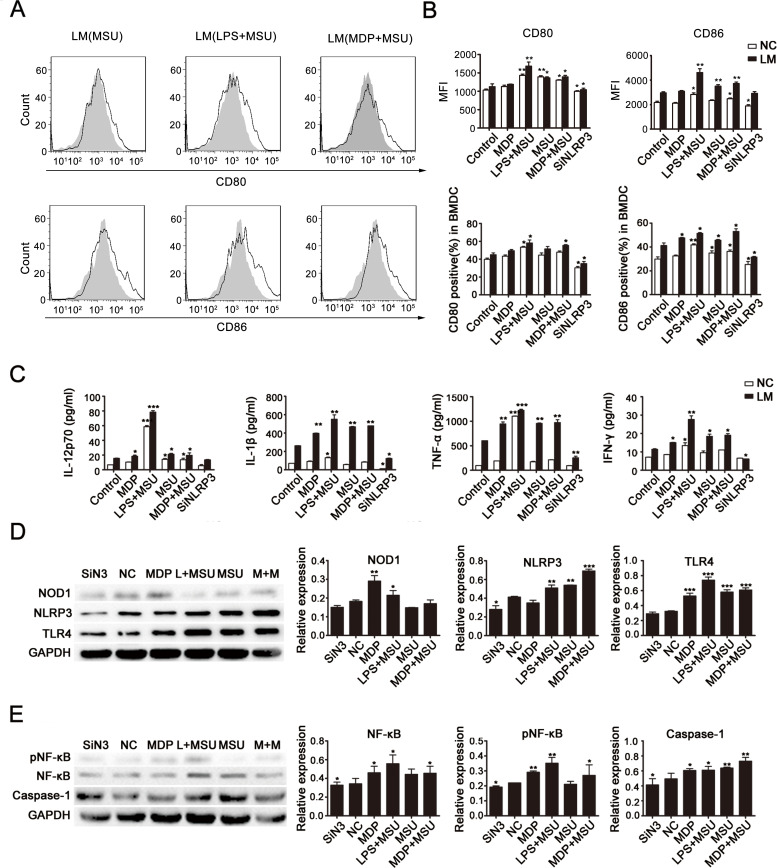
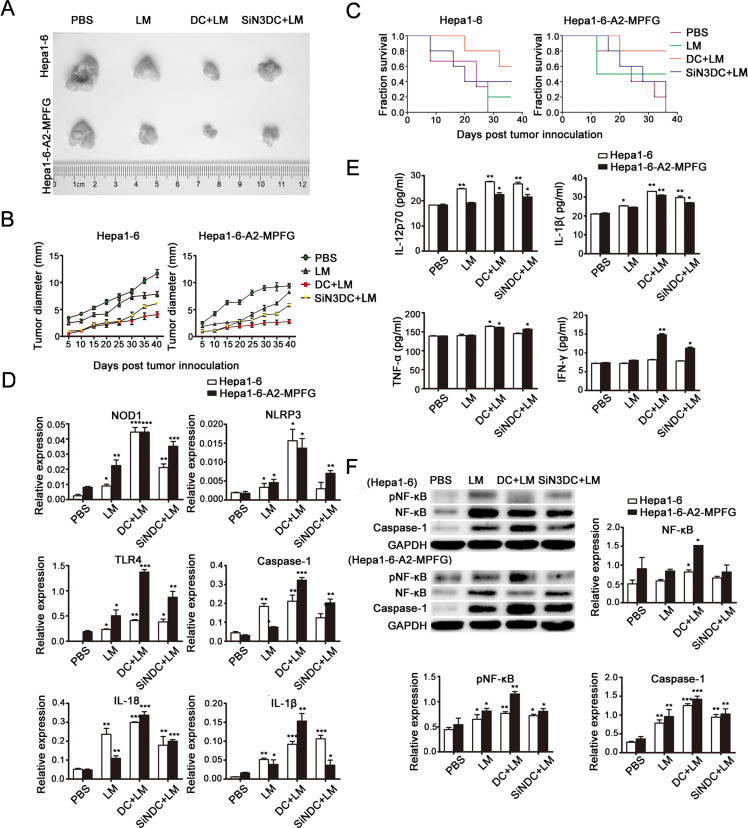
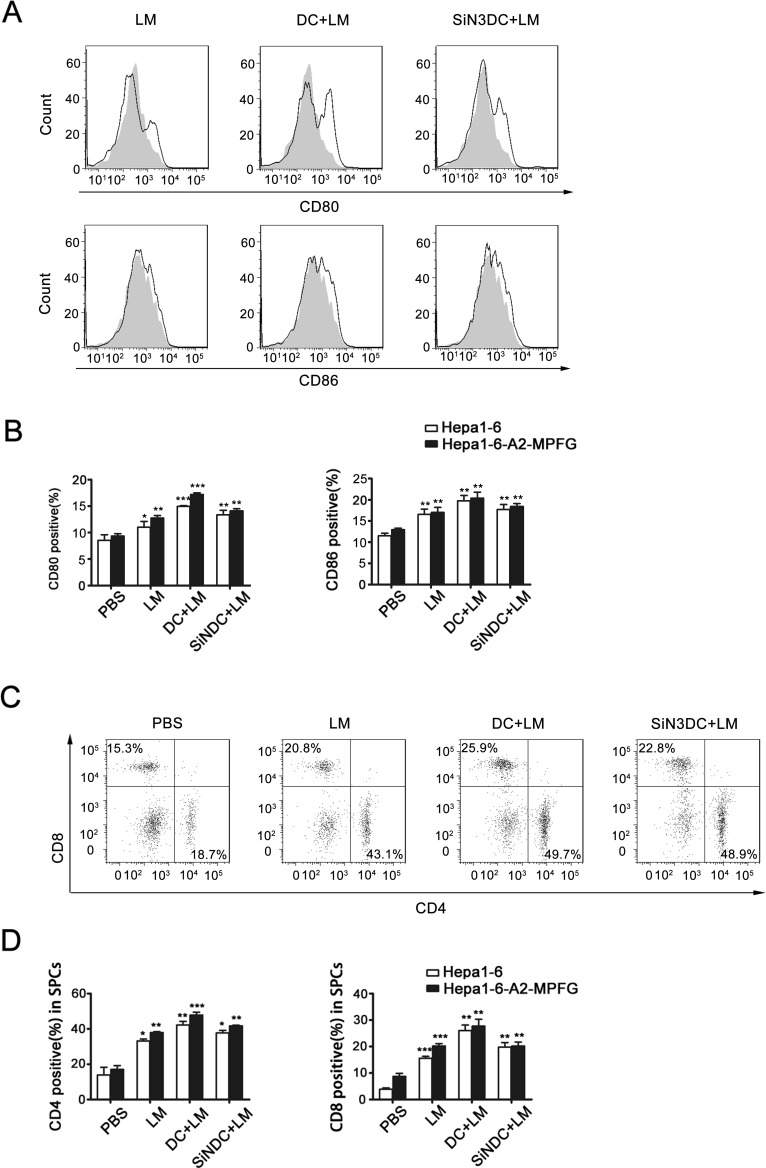
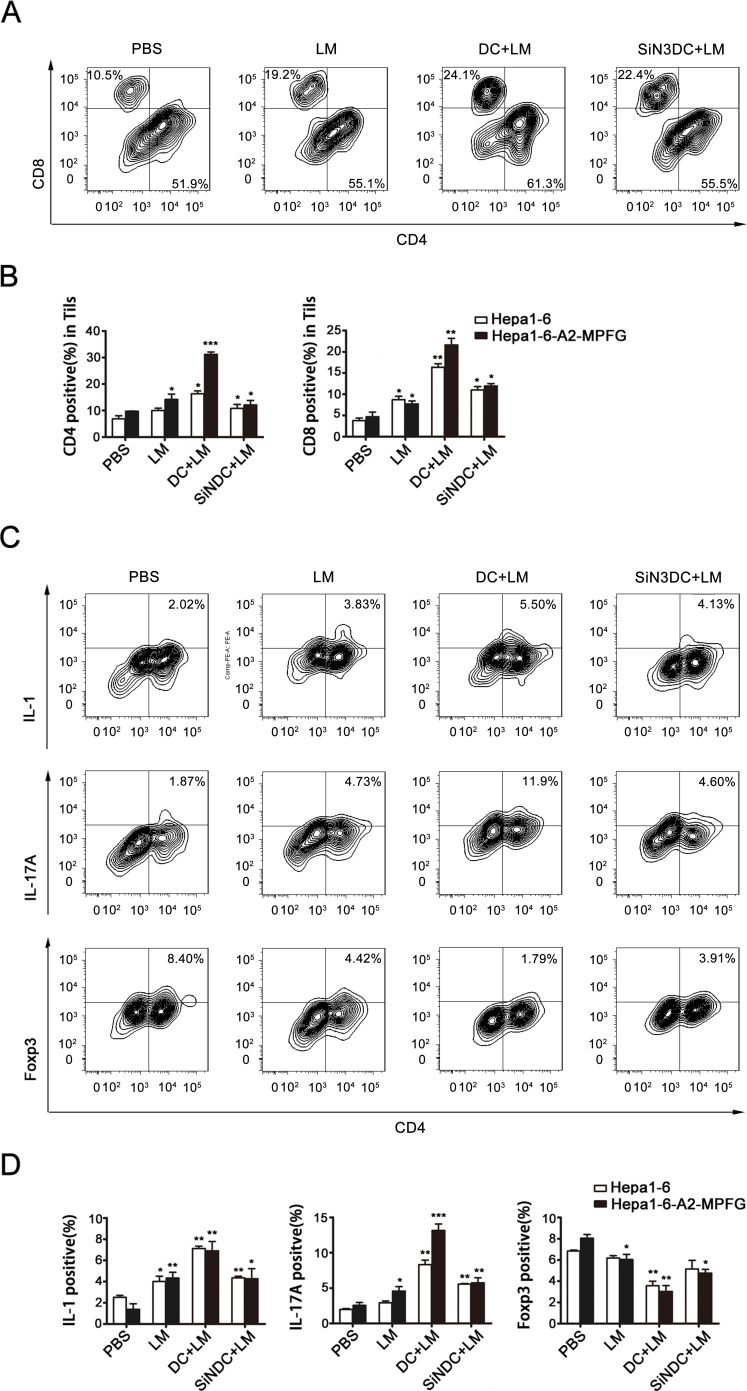
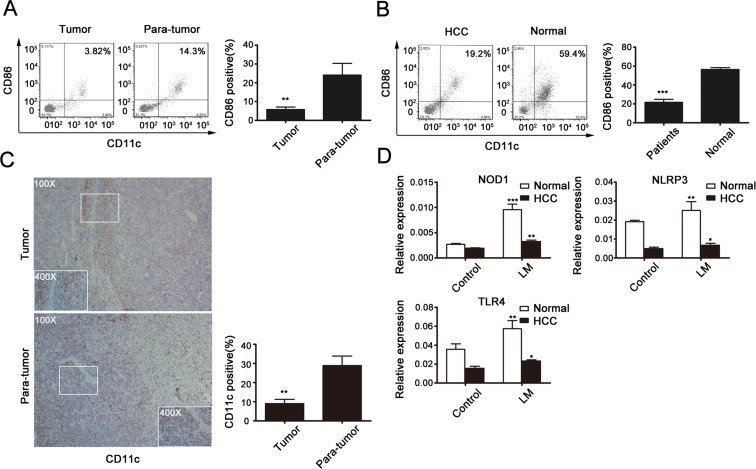
Immunotherapy is a promising treatment for liver cancer. Here, we tested the ability of the attenuated hepatocellular carcinoma-specific Listeria vaccine (Lmdd-MPFG) to treat hepatocellular carcinoma (HCC) in a mouse model. Immunization with the vaccine caused a strong anti-tumor response, especially in mice reinfused with dendritic cells (DCs). In mice that were also administered DCs, tumor suppression was accompanied by the strongest cytotoxic T lymphocyte response of all treatment groups and by induced differentiation of CD4+ T cells, especially Th17 cells. Additionally, the Lmdd-MPFG vaccine caused maturation of DCs in vitro. We demonstrated the synergistic effect of TLR4 and NLRP3 or NOD1 signaling pathways in LM-induced DC activation. These results suggest that the Lmdd-MPFG vaccine is a feasible strategy for preventing HCC.
Keywords: Lmdd-MPFG; PRRs; dendritic cells; hepatocellular carcinoma.
Conflict of interest statement
The authors declare no conflict of interest.
Figures
Similar articles
-
Development of a Listeria monocytogenes-based vaccine against hepatocellular carcinoma.Oncogene. 2012 Apr 26;31(17):2140-52. doi: 10.1038/onc.2011.395. Epub 2011 Sep 19. Oncogene. 2012. PMID: 21927025
-
Attenuated Listeria monocytogenes as a cancer vaccine vector for the delivery of CD24, a biomarker for hepatic cancer stem cells.Cell Mol Immunol. 2014 Mar;11(2):184-96. doi: 10.1038/cmi.2013.64. Epub 2014 Feb 3. Cell Mol Immunol. 2014. PMID: 24488178 Free PMC article.
-
Dendritic cell-derived exosomes elicit tumor regression in autochthonous hepatocellular carcinoma mouse models.J Hepatol. 2017 Oct;67(4):739-748. doi: 10.1016/j.jhep.2017.05.019. Epub 2017 May 24. J Hepatol. 2017. PMID: 28549917
-
Dendritic cell-based vaccines: clinical applications in breast cancer.Immunotherapy. 2014;6(3):349-60. doi: 10.2217/imt.13.169. Immunotherapy. 2014. PMID: 24762078 Review.
-
Dendritic cell-based vaccines for the therapy of experimental tumors.Immunotherapy. 2010 Mar;2(2):257-68. doi: 10.2217/imt.10.7. Immunotherapy. 2010. PMID: 20635932 Review.
Cited by
-
Cancer vaccines and immunotherapeutic approaches in hepatobiliary and pancreatic cancers.Hum Vaccin Immunother. 2017 Dec 2;13(12):2931-2952. doi: 10.1080/21645515.2017.1359362. Epub 2017 Nov 7. Hum Vaccin Immunother. 2017. PMID: 29112462 Free PMC article. Review.
-
The Role of TLR4 in the Immunotherapy of Hepatocellular Carcinoma: Can We Teach an Old Dog New Tricks?Cancers (Basel). 2023 May 17;15(10):2795. doi: 10.3390/cancers15102795. Cancers (Basel). 2023. PMID: 37345131 Free PMC article. Review.
-
[Listeria Balanced Lethal Systems Expressing Cervical Cancer Antigen Genes: Construction and Basic Biological Characteristics].Sichuan Da Xue Xue Bao Yi Xue Ban. 2023 Nov 20;54(6):1159-1166. doi: 10.12182/20231160210. Sichuan Da Xue Xue Bao Yi Xue Ban. 2023. PMID: 38162066 Free PMC article. Chinese.
-
A Genetically Modified attenuated Listeria Vaccine Expressing HPV16 E7 Kill Tumor Cells in Direct and Antigen-Specific Manner.Front Cell Infect Microbiol. 2017 Jun 29;7:279. doi: 10.3389/fcimb.2017.00279. eCollection 2017. Front Cell Infect Microbiol. 2017. PMID: 28706878 Free PMC article.
-
Emergence of immunotherapy as a novel way to treat hepatocellular carcinoma.World J Gastroenterol. 2018 May 7;24(17):1839-1858. doi: 10.3748/wjg.v24.i17.1839. World J Gastroenterol. 2018. PMID: 29740200 Free PMC article. Review.
References
-
- Torresi J, Johnson D, Wedemeyer H. Progress in the development of preventive and therapeutic vaccines for hepatitis C virus. J Hepatol. 2011;54(6):1273–1285. - PubMed
-
- Pang RWC, Poon RTP. From Molecular Biology to Targeted Therapies for Hepatocellular Carcinoma: The Future Is Now. Oncology-Basel. 2007;72(1):30–44. - PubMed
-
- Ouml W, Rns MA, Weinmann A, Schuchmann M, Galle PR. Systemic Therapies in Hepatocellular Carcinoma. Digest Dis. 2009;27(2):175–188. - PubMed
-
- Breous E, Thimme R. Potential of immunotherapy for hepatocellular carcinoma. J Hepatol. 2011;54(4):830–834. - PubMed
-
- Singh R, Wallecha A. Cancer immunotherapy using recombinant Listeria monocytogenes: Transition from bench to clinic. Human Vaccines. 2011;7(5):497–505. - PubMed
Publication types
MeSH terms
Substances
LinkOut - more resources
Full Text Sources
Other Literature Sources
Research Materials
