. 2015 Mar 31;10(3):e0121003.
doi: 10.1371/journal.pone.0121003. eCollection 2015.

The invadopodia scaffold protein Tks5 is required for the growth of human breast cancer cells in vitro and in vivo

Affiliations

The invadopodia scaffold protein Tks5 is required for the growth of human breast cancer cells in vitro and in vivo

Barbara Blouw et al. PLoS One. .

Abstract

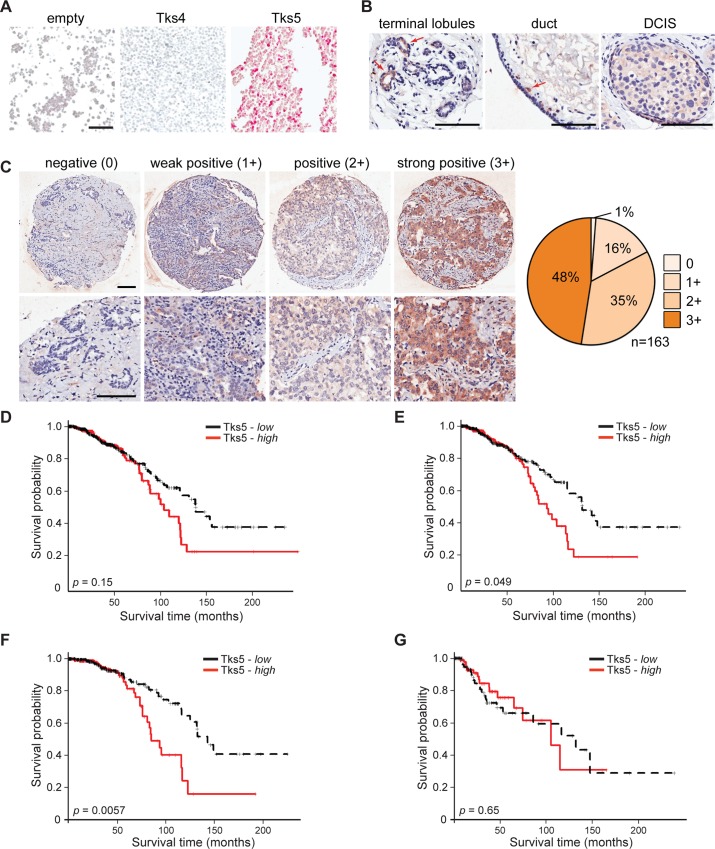
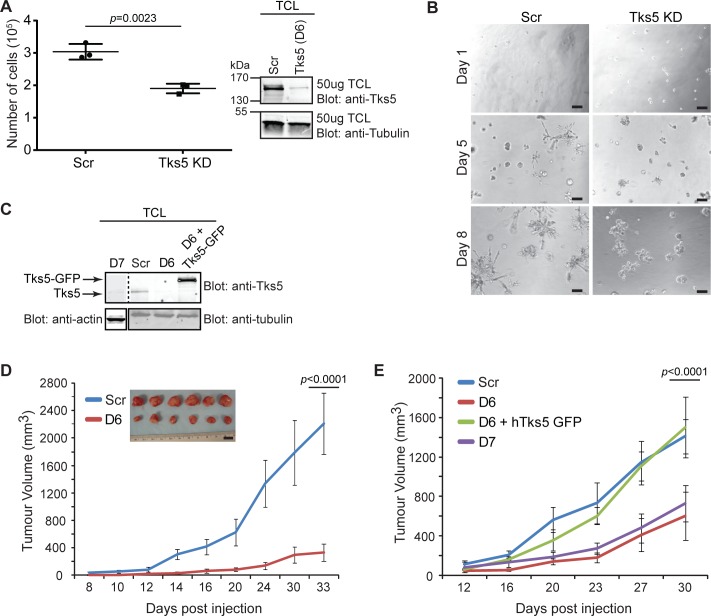
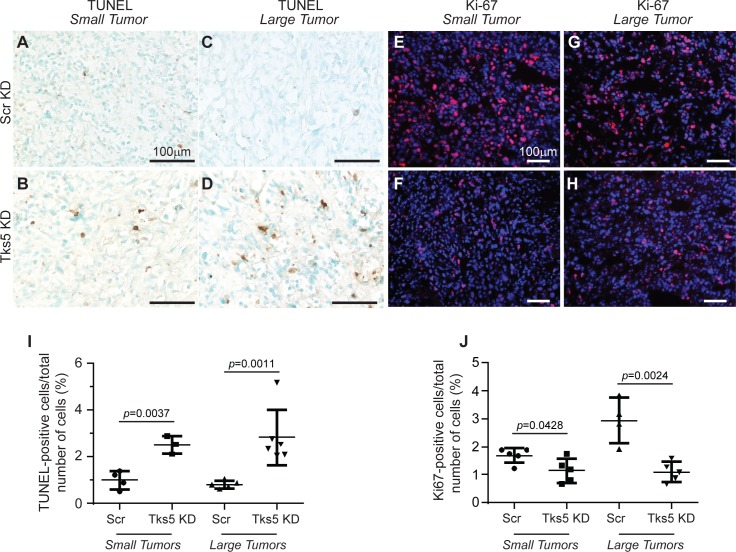
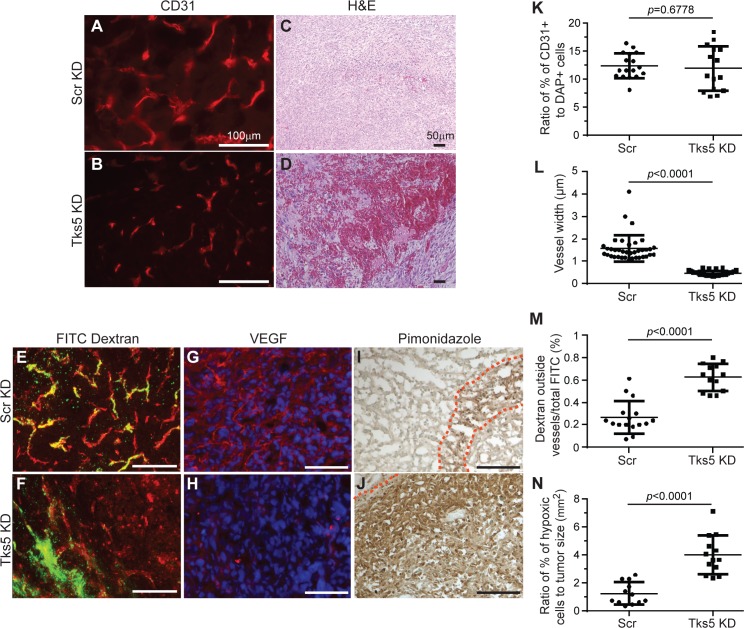
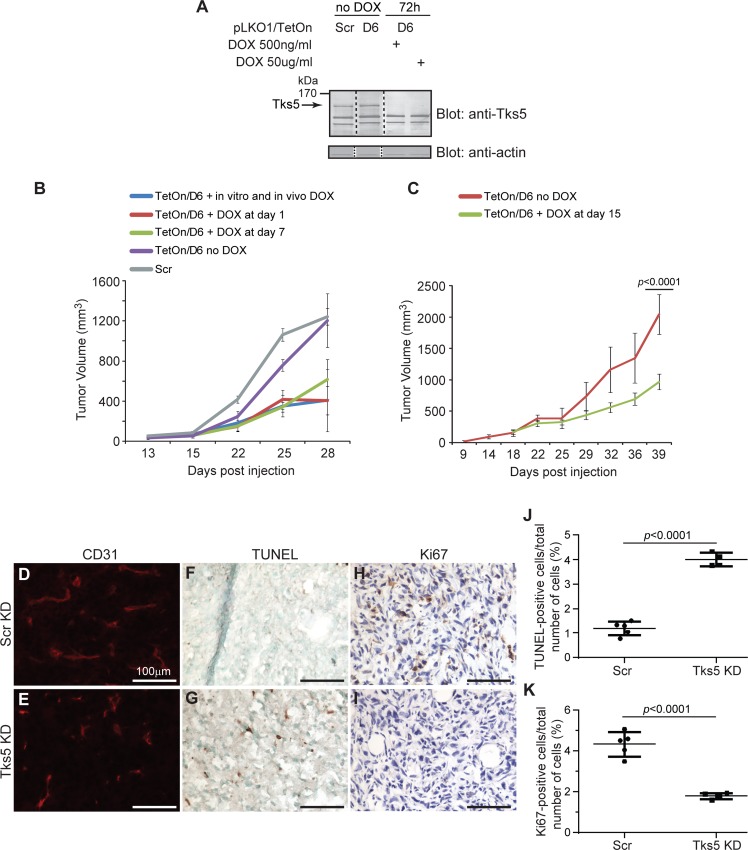
The ability of cancer cells to invade underlies metastatic progression. One mechanism by which cancer cells can become invasive is through the formation of structures called invadopodia, which are dynamic, actin-rich membrane protrusions that are sites of focal extracellular matrix degradation. While there is a growing consensus that invadopodia are instrumental in tumor metastasis, less is known about whether they are involved in tumor growth, particularly in vivo. The adaptor protein Tks5 is an obligate component of invadopodia, and is linked molecularly to both actin-remodeling proteins and pericellular proteases. Tks5 appears to localize exclusively to invadopodia in cancer cells, and in vitro studies have demonstrated its critical requirement for the invasive nature of these cells, making it an ideal surrogate to investigate the role of invadopodia in vivo. In this study, we examined how Tks5 contributes to human breast cancer progression. We used immunohistochemistry and RNA sequencing data to evaluate Tks5 expression in clinical samples, and we characterized the role of Tks5 in breast cancer progression using RNA interference and orthotopic implantation in SCID-Beige mice. We found that Tks5 is expressed to high levels in approximately 50% of primary invasive breast cancers. Furthermore, high expression was correlated with poor outcome, particularly in those patients with late relapse of stage I/II disease. Knockdown of Tks5 expression in breast cancer cells resulted in decreased growth, both in 3D in vitro cultures and in vivo. Moreover, our data also suggest that Tks5 is important for the integrity and permeability of the tumor vasculature. Together, this work establishes an important role for Tks5 in tumor growth in vivo, and suggests that invadopodia may play broad roles in tumor progression.


Conflict of interest statement

Competing Interests: The authors have declared that no competing interests exist.

Figures

Fig 1
Fig 1. Tks5 expression in breast tissue and breast cancer.
A) 293 cells were transfected with empty vector, or vectors expressing Tks4 or Tks5. Cells were pelleted, fixed, embedded in paraffin and processed for immunohistochemistry with an anti-Tks5 antibody. B) Representative images of normal breast lobules and duct, and ductal carcinoma in situ, stained with anti-Tks5 antibodies. Red arrows indicate areas with intense Tks5 staining. Scale bar represents 100μm. C) Representative images of primary invasive breast cancer specimens, at low and high magnification, to illustrate the range of Tks5 expression observed. Scale bars represent 100μm. Quantification of 163 specimens is shown on the right. D) Kaplan-Meier survival curves for patients with high (red) and low (black) Tks5α mRNA levels. E) Kaplan-Meier survival curves for stage I/II patients with high (red) and low (black) Tks5α mRNA levels. F) Kaplan-Meier survival curves for stage III/IV patients with high (red) and low (black) Tks5α mRNA levels.
Fig 2
Fig 2. Reduced expression of Tks5 leads to decreased growth of tumor cells in vitro and in vivo.
A) MDA-MB-231-Luc infected with either a scrambled (Scr) or Tks5 (D6) shRNA via lentivirus were subjected to growth assays in 3D conditions for 7–10 days. Immunoblot shows shRNA Tks5 knockdown (KD) compared to scrambled control in the cells used to evaluate growth. D6 = Tks5 knockdown clone. Experiments were performed in triplicate. B) Representative images of day 1, 5, and 8 MDA-MB-232-Luc [Scr and Tks5 KD (D6)] acini in 3D matrigel assays. Shown are low magnification phase-contrast images. Experiment was performed in triplicate. Scale bar: 100μm. C) Immunoblot: D6 and D7 represent different shRNAs tested for effective Tks5 knockdown in MDA-MB-231-Luc cells. These cell lines, as well as Scr and rescue (D6+hTks5-GFP) lines, were used for orthotopic injections in Fig 1D and 1E. D) Control (Scr) and Tks5 (D6) KD clones were inoculated in the mammary fat pad of SCID-Beige mice. Tumor volumes were measured every 2–3 days as described in Materials and Methods and tumors were allowed to grow to a final volume of approximately 2cm3. n = 20 mice per tumor type. Experiments were performed in triplicate (at least). Inset: Photographs of 6 tumors per group at the day of dissection (endpoint of experiment). Scale bar: 1cm. Tumor images are representative for all experiments performed. E) Control (Scr), Tks5 (D6 and D7) KD clones, and a Tks5 rescue clone (D6+ hTks5-GFP) were inoculated in the mammary fat pad of SCID-Beige mice. Tumor volumes were measured as in Fig 1D. n = 5 mice per tumor type. Experiments were performed in triplicate (at least). Data are expressed as mean ± SD. One-way ANOVA or a Student’s t test was used to calculate p values.
Fig 3
Fig 3. Tumor proliferation and apoptosis is affected by Tks5 knockdown.
Tumors from Scr KD and Tks5 KD MDA-MB-231-Luc-orthotopic mouse models in Fig 2 were analyzed via immunohistochemistry and immunofluorescence, using size-matched tumors. A-D) TUNEL staining was used to visualize cell death in small (panels A-B) and large (panels C-D) tumors from Scr (panels A, C) and Tks5 (panels B, D) KD mice. Scale bar: 100μm. E-H) Ki-67 staining (nuclear protein marker) was used to visualize cell proliferation in small (panels E-F) and large (panels G-H) tumors from Scr (panels E, G) and Tks5 (panels F, H) KD mice. Scale bar: 50μm. Images are representative for all experiments performed. I-J) Quantification of positive immunohistochemical and immunofluorescence staining. Graphs show immune-positive cells for apoptosis (TUNEL) (panel I) and proliferative cells (Ki67) (panel J) at the day of dissection (endpoint of experiment). Data are expressed as mean ± SD. One-way ANOVA or a Student’s t test was used to calculate p values.
Fig 4
Fig 4. Reduction of Tks5 expression in tumor cells is associated with decreased angiogenesis.
Tumors from Scr KD and Tks5 KD MDA-MB-231-Luc-orthotopic mouse models in Fig 2 were analyzed via immunohistochemistry and immunofluorescence in size-matched tumors. A-B) Vessel morphology and density was examined by staining tumor samples with CD31 (quantification panels K and L). C-D) Hematoxylin and eosin staining revealed altered vessel morphology and hemorrhaging in Tks5 KD tumors as compared to Scr KD tumors. Tumors were also analyzed for FITC-Dextran leakage (panels E-F, red = CD31; Green = FITC-dextran; quantification panel M), VEGF expression (red; panels G-H), and hypoxic areas (pimonidazole staining in panel I-J, quantification panel N). Red dashed lines delineate borders for areas of hypoxia. Scale bar: 100 μm, except panels C and D where scale bar: 50μm. Images are representative for all experiments performed. Data were expressed as mean ± SD. One-way ANOVA or a Student’s t test was used to calculate p values.
Fig 5
Fig 5. Tks5 is required for tumor progression.
MDA-MB-231-Luc cells were infected to stably express an inducible TetOn lentivirus where the levels of the Tks5 shRNA are under the control of the tetracycline promoter (see Materials and methods for the experimental procedure). A) Immunoblot demonstrating Tks5 expression reduction in the MDA-MB-231-Luc cell line in dose- and time-dependent fashion in response to doxycycline exposure. B) TetOn/D6 were injected orthotopically (blue, red, and green lines) compared to SCR and no doxycycline controls (grey and purple lines, respectively) under three conditions: when Tks5 was already reduced by in vitro exposure of the cells to doxycycline for 10 days (DOX A) (blue line), when unexposed cells were injected into the animal and the animal received doxycycline starting at the day of injection (DOX B) (red line), as well as when the animals received doxycycline in the drinking water for the first time after the tumor has been growing for 7 days (DOX C) (green line). C) Animals were given doxycycline 15 days after tumor cell injection and after randomization of the mice. TetOn/D6 mice were divided up in 3 groups where 2 groups received doxycycline in the drinking water at different time points and 1 group received doxycycline-free drinking water. Tumor volumes were measured at different time points as described in Materials and methods, and tumors were allowed to grow to a final volume of approximately 2cm3. N = 4 mice per tumor type. Experiments were performed in duplicate. D-I) Tumors from Fig 4C were analyzed for vascularization by CD31 (panel D-E), for apoptosis by TUNEL (panel F-G) and for proliferation using Ki-67 (panel H-I) immunofluorescence staining. Scale bar: 100μm. Images are representative for all experiments performed. J-K) Quantification of positive immunohistochemical and immunofluorescence staining. Graphs show immunopositive cells for apoptosis (TUNEL) (panel J) and proliferative (Ki67) (panel K) markers at the day of dissection (endpoint of experiment). Data were expressed as mean ± SD. One-way ANOVA or a Student’s t test was used to calculate p values.

References

    1. Lu P, Weaver VM, Werb Z (2012) The extracellular matrix: a dynamic niche in cancer progression. J Cell Biol 196: 395–406. 10.1083/jcb.201102147 - DOI - PMC - PubMed
    1. Murphy DA, Courtneidge SA (2011) The 'ins' and 'outs' of podosomes and invadopodia: characteristics, formation and function. Nat Rev Mol Cell Biol 12: 413–426. 10.1038/nrm3141 - DOI - PMC - PubMed
    1. Linder S, Wiesner C, Himmel M (2011) Degrading devices: invadosomes in proteolytic cell invasion. Annu Rev Cell Dev Biol 27: 185–211. 10.1146/annurev-cellbio-092910-154216 - DOI - PubMed
    1. Bravo-Cordero JJ, Hodgson L, Condeelis J (2012) Directed cell invasion and migration during metastasis. Curr Opin Cell Biol 24: 277–283. 10.1016/j.ceb.2011.12.004 - DOI - PMC - PubMed
    1. Hoshino D, Branch KM, Weaver AM (2013) Signaling inputs to invadopodia and podosomes. J Cell Sci 126: 2979–2989. 10.1242/jcs.079475 - DOI - PMC - PubMed

Publication types

Substances