. 2015 Jul;33(7):2343-50.
doi: 10.1002/stem.2015. Epub 2015 May 13.

Brief Report: Oxidative Stress Mediates Cardiomyocyte Apoptosis in a Human Model of Danon Disease and Heart Failure

Affiliations

Brief Report: Oxidative Stress Mediates Cardiomyocyte Apoptosis in a Human Model of Danon Disease and Heart Failure

Sherin I Hashem et al. Stem Cells. 2015 Jul.

Abstract

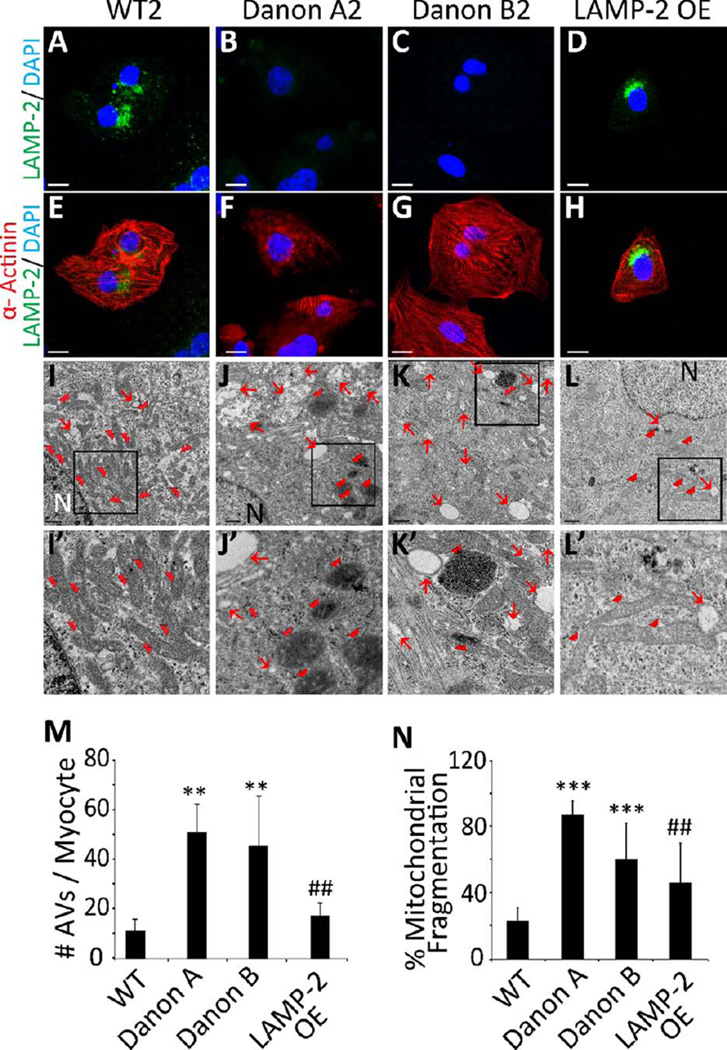
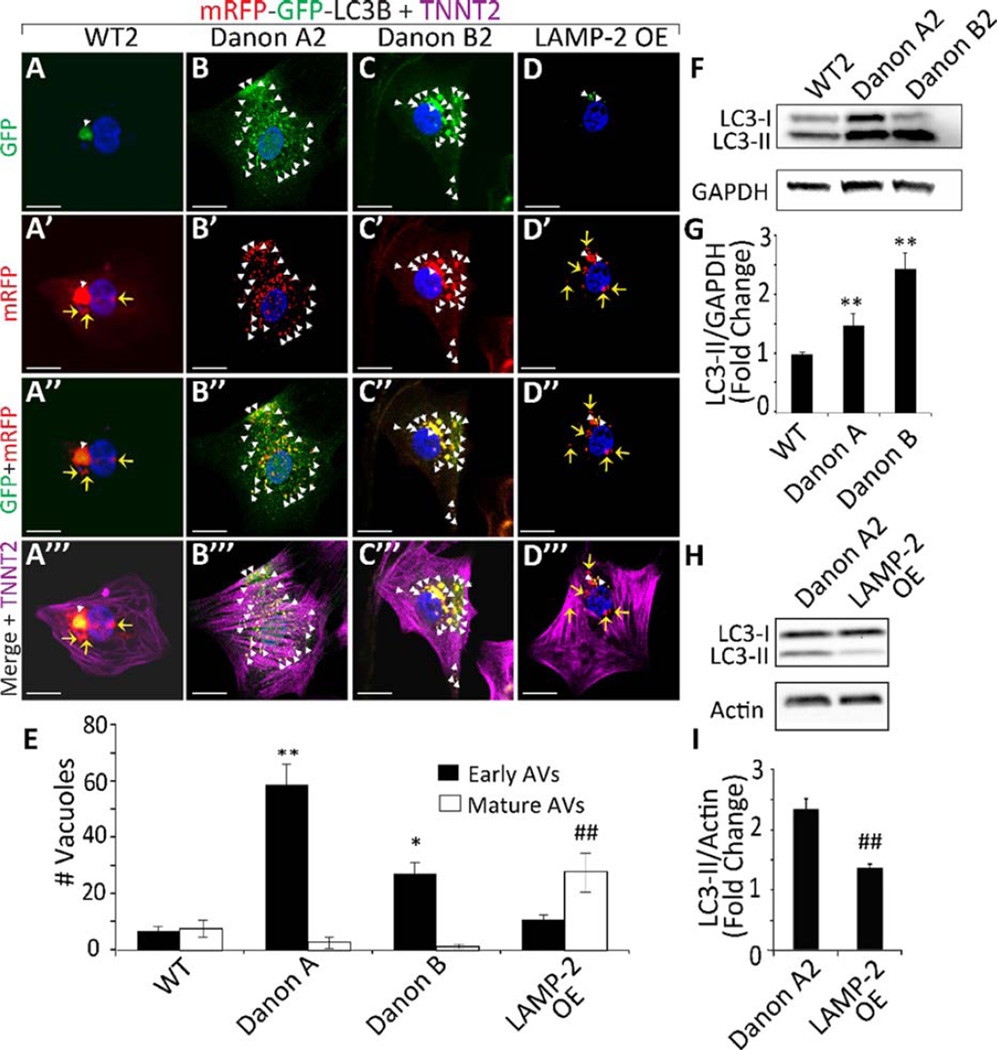
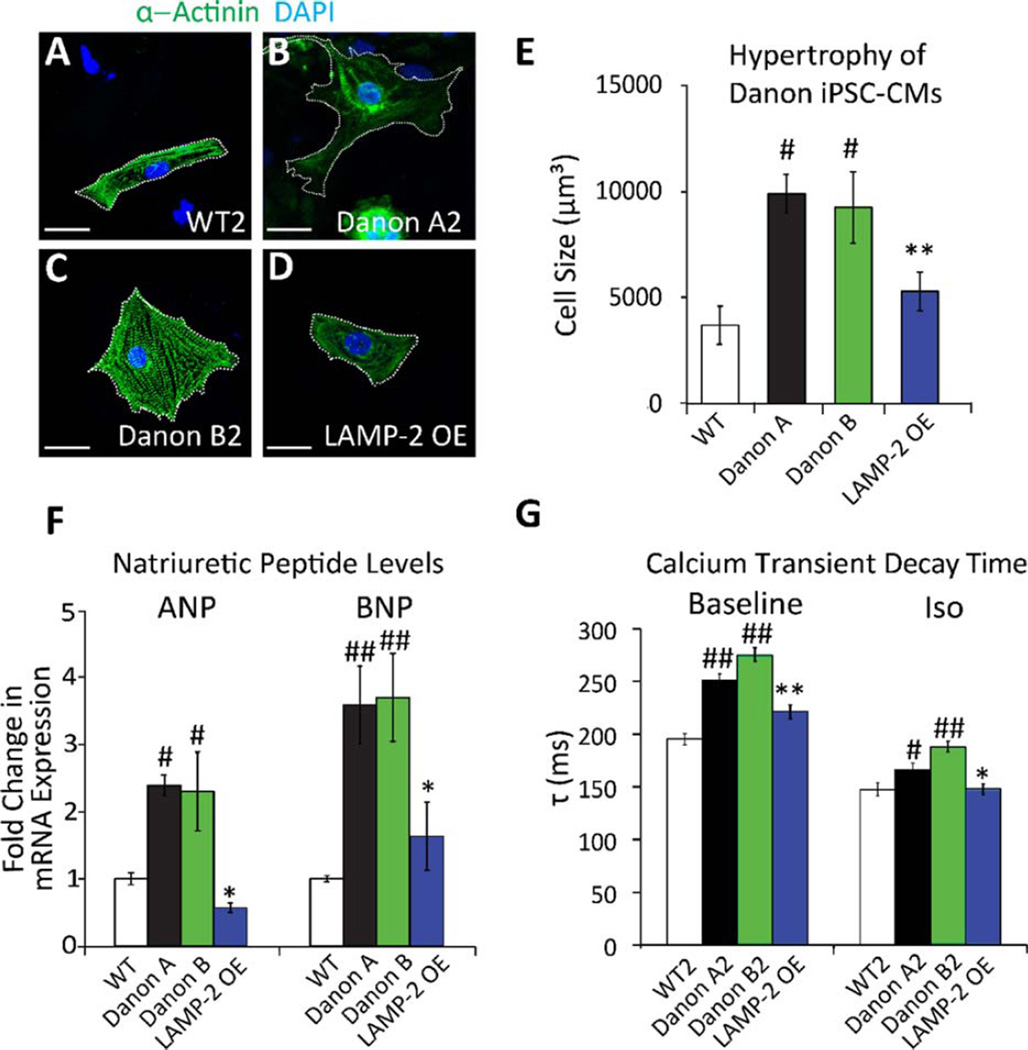
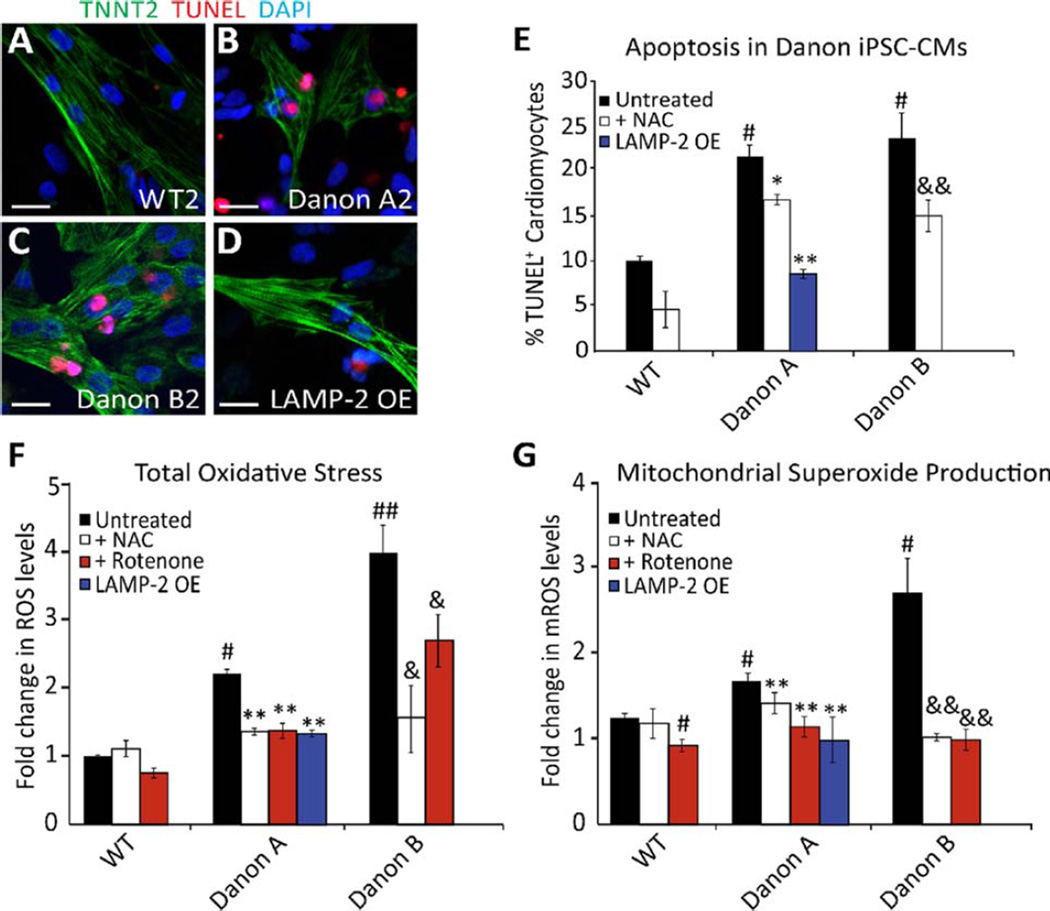
Danon disease is a familial cardiomyopathy associated with impaired autophagy due to mutations in the gene encoding lysosomal-associated membrane protein type 2 (LAMP-2). Emerging evidence has highlighted the importance of autophagy in regulating cardiomyocyte bioenergetics, function, and survival. However, the mechanisms responsible for cellular dysfunction and death in cardiomyocytes with impaired autophagic flux remain unclear. To investigate the molecular mechanisms responsible for Danon disease, we created induced pluripotent stem cells (iPSCs) from two patients with different LAMP-2 mutations. Danon iPSC-derived cardiomyocytes (iPSC-CMs) exhibited impaired autophagic flux and key features of heart failure such as increased cell size, increased expression of natriuretic peptides, and abnormal calcium handling compared to control iPSC-CMs. Additionally, Danon iPSC-CMs demonstrated excessive amounts of mitochondrial oxidative stress and apoptosis. Using the sulfhydryl antioxidant N-acetylcysteine to scavenge free radicals resulted in a significant reduction in apoptotic cell death in Danon iPSC-CMs. In summary, we have modeled Danon disease using human iPSC-CMs from patients with mutations in LAMP-2, allowing us to gain mechanistic insight into the pathogenesis of this disease. We demonstrate that LAMP-2 deficiency leads to an impairment in autophagic flux, which results in excessive oxidative stress, and subsequent cardiomyocyte apoptosis. Scavenging excessive free radicals with antioxidants may be beneficial for patients with Danon disease. In vivo studies will be necessary to validate this new treatment strategy.

Keywords: Apoptosis; Autophagy; Danon disease; Induced pluripotent stem cells; Oxidative stress.


Conflict of interest statement

Disclosure of Potential Conflicts of Interest

The authors indicate no potential conflicts of interest.

Figures

Figure 1
Figure 1
LAMP-2 deficient induced pluripotent stem cell-derived cardiomyocytes (iPSC-CMs) exhibit accumulation of AVs and mitochondrial fragmentation. (A–H): Representative confocal images of iPSC-CMs from (A,E) WT2, (B,F) Danon A2, (C,G) Danon B2, and (D,H) LAMP-2 OE lines immunostained for LAMP-2 (green) and sarcomeric α-actinin (red) reveal no visible LAMP-2 in Danon iPSC-CMs. LAMP-2 OE iPSC-CMs show LAMP-2 protein expression. DAPI (blue) was used for nuclear counterstaining. Scale bar = 10 µm. (I–L): Electron microscopy (EM) of iPSC-CMs from (I) WT2, (J) Danon A2, (K) Danon B2, and (L) LAMP-2 OE lines reveals significant accumulation of intracytoplasmic vacuoles (red arrows) and presence of round fragmented mitochondria (red double arrowheads) in Danon iPSC-CMs. A reduction in the number of intracytoplasmic vacuoles and the presence of elongated mitochondria are noted in LAMP-2 OE compared to Danon A2 iPSC-CMs. N: nucleus. Scale bar = 0.5 µm. (I′–L′): Enlarged image of the boxed area in I–L. (M): Quantification of AVs visualized by EM reveals the accumulation of more AVs in the Danon A1–3 (45.9±9.9 AVs/CM) and Danon B1–2 (40.15±17.6 AVs/CM) iPSC-CM lines compared to WT1–2 (10.3±3.4 AVs/CM) and LAMP-2 OE (18.6±3.5 AVs/CM) iPSC-CM lines. **, p<.01 vs. WT; ##, p<.01 vs. Danon A, Student’s t test, n = 3. (N): Quantification of mitochondrial fragmentation visualized by EM reveals the presence of a high percentage of fragmented mitochondria in Danon A and Danon B compared to WT and LAMP-2 OE iPSC-CM lines (% mitochondrial fragmentation is 87.4±8.5 for Danon A1–3, 60.6±22.1 for Danon B1–2, vs. 23.5±7.8 for WT1–2, and 46.5±23.9 for LAMP-2 OE iPSC-CMs). ***, p<.001 vs. WT; ##, p<.01 vs. Danon A, Student’s t test, n = 3. Data are the means±SD. Abbreviations: AVs, autophagic vacuoles; DAPI, 4′,6-diamidino-2-phenylindole; EM, electron microscopy; LAMP-2, lysosomal-associated membrane protein type 2; WT, wild-type
Figure 2
Figure 2
LAMP-2 deficient induced pluripotent stem cell-derived cardiomyocytes (iPSC-CMs) exhibit impaired autophagic flux. (A–D′′ ′): Confocal images of iPSC-CMs from (A–A′′ ′) WT2, (B–B′′′) Danon A2, (C–C′′ ′) Danon B2, and (D–D′′ ′) LAMP-2 OE lines expressing tandem fluorescent mRFP-GFP-LC3B (tf-LC3B). GFP is quenched upon autophagosome–lysosome fusion, whereas mRFP remains stable. Early autophagic vacuoles (AVs, white arrowheads) express both mRFP and GFP signals, whereas mature AVs (yellow arrows) express the mRFP signal only. (A–D): Images show GFP signal, that is, early AVs. (A′ –D′): Images show mRFP signal, that is, early and mature AVs. (A′′ –D′′): Images show colocalization of GFP and mRFP signals of the tf–LC3B. (A′′ ′–D′′ ′): Images show cardiac troponin T (TNNT2: magenta) immunostaining of the cells expressing tf-LC3B. DAPI (blue) was used to counterstain nuclei. Scale bar = 10 µm. (E): Quantification of early and mature AVs in WT, Danon A, Danon B, and LAMP-2 OE iPSC-CMs expressing tfLC3B reveals that Danon iPSC-CMs exhibit an increase in early AVs (59±13.1 for Danon A1–3, 29.5±6.8 for Danon B1–2 vs. 7±2.3 for WT1–2 iPSC-CM lines) and a reduction in mature AVs compared to WT lines (3.0±2.3 for Danon A1–3, 1.4±0.8 for Danon B1–2 vs. 7.8±3 for WT1–2 iPSC-CM lines). LAMP-2 OE iPSC-CMs show restored AV maturation (mature AVs 28.7±7). *, p<.05 vs. WT, **, p<.01 vs. WT; ##, p<.01 vs. Danon A, Student’s t test, n = 3. (F): Western blot of LC3-I and -II expression in WT2, Danon A2, and Danon B2 iPSC-CMs. GAPDH loading control is shown. (G): Western blot quantification demonstrates significantly more LC3-II in Danon A1–3 and Danon B1–2 iPSC-CMs compared to WT1–2 lines. Results for each group are pooled from experiments performed on all clones. **, p<.01 vs. WT, Student’s t test, n = 4. (H): Western blot of LC3-I and -II expression in Danon A2 and LAMP-2 OE iPSC-CMs. Actin loading control is shown. (I): Western blot quantification demonstrates significantly less LC3-II in LAMP-2 OE iPSC-CMs compared to Danon A2 line. ##, p<.01 vs. Danon A2, Student’s t test, n = 4. Data are the means±SD. Abbreviations: AVs, autophagic vacuoles; GADPH, glyceraldehyde 3-phosphate dehydrogenase; GFP, green fluorescent protein; LAMP-2, lysosomal-associated membrane protein type 2; LC3, Microtubule-associated protein 1 light chain 3; mRFP, monomeric red fluorescent protein
Figure 3
Figure 3
Danon induced pluripotent stem cell-derived cardiomyocytes (IPSC-CMs) demonstrate increased cell size, altered gene expression, and impaired calcium reuptake. (A–D): Representative confocal images of iPSC-CMs from (A) WT2, (B) Danon A2, (C) Danon B2, and (D) LAMP-2 OE lines immunostained for sarcomeric α-actinin (green). The cell perimeter is outlined by a white dotted line. Nuclei are counterstained with DAPI (blue). Scale bar = 20 µm. (E): Danon A and B iPSC-CMs are significantly larger than WT and LAMP-2 OE iPSC-CMs (9,879±904 µm3 for Danon A1–3 lines, 9,231.9±1,670 µm3 for Danon B1–2 lines vs. 3,694±894 µm3 for WT1–2 lines, and 5,281±783 µm3 for LAMP-2 OE line). #, p<.05 vs. WT; **, p<.01 vs. Danon A, Student’s t test, n = 4. (F): ANP and BNP mRNA expression levels in iPSC-CMs. Danon A1–3 and B1–2 lines express significantly more ANP and BNP than WT1–2 lines and LAMP-2 OE line (2.4±0.1- and 3.5±0.6-fold increase in ANP and BNP, respectively, for Danon A1–3 lines; 2.3±0.6- and 3.7±0.7-fold for Danon B1–2 lines; 0.6±0.01- and 1.6±0.5-fold for LAMP-2 OE line compared to WT1–2 lines). #, p<.05 vs. WT; ##, p<.01 vs. WT; *, p<.05 vs. Danon A, Student’s t test, n = 3. (G): Calcium transients were recorded in contracting cultures at baseline and after treatment with isoproterenol (Iso, 1 µM), and τ was measured. Addition of isoproterenol shortened τ compared to baseline in all lines. Danon A2 and B2 iPSC-CMs exhibit a significantly longer τ than WT2 and LAMP-2 OE lines, reflecting a slower Ca2+ decay rate under all conditions examined (251±6.2 ms in Danon A2 and 274.9±7.2 ms in Danon B2 vs. 195.3±5.2 ms in WT2 and 221.8±6 ms in LAMP-2 OE at baseline; 166.1±6.7 ms in Danon A2 and 187.8±5.8 ms in Danon B2 vs. 147.5±6.3 ms in WT2 and 148.3±4.9 ms in LAMP-2 OE following Iso treatment). #, p<.05 vs. WT, ##, p<.01 vs. WT, *, p<.05 vs. Danon A, *, p<.01 vs. Danon A, Student’s t test, n = 60. Data are expressed as means±SD, or±SEM for calcium imaging. Abbreviations: ANP, atrial natriuretic peptide; BNP, brain natriuretic peptide; DAPI, 4′,6-diamidino-2-phenylindole; LAMP-2, lysosomal-associated membrane protein type 2; WT, wild-type
Figure 4
Figure 4
LAMP-2 deficiency leads to increased cell death and mitochondrial oxidative stress (mROS). (A–D): Representative confocal images of iPSC-CMs from (A) WT2, (B) Danon A2, (C) Danon B2, and (D) LAMP-2 OE lines immunostained for TNNT2 (green) and TUNEL (red). Nuclei are counterstained with DAPI (blue). Scale bar = 20 µm. (E): Danon lines display significantly more TUNEL positive iPSCCMs than WT lines and LAMP-2 OE line (% TUNEL+ cardiomyocytes is 21.95±1.3 for Danon A1–3 lines, 24±2.82 for Danon B1–2 lines vs. 10.15±0.57 for WT1–2 lines and 8.7±0.5 for LAMP-2 OE line). NAC treatment significantly reduces the number of TUNEL positive Danon iPSC-CMs (17.07 ± 0.59 for Danon A1–3 +NAC, and 15.25 ± 1.75 for Danon B1–2 +NAC). #, p<.05 vs. WT, *, p<.05 vs. Danon A, **, p<.01 vs. Danon A, &, p<.01 vs. Danon B, Student’s t test, n = 3. (F): iPSC-CMs from Danon A and B lines display increased levels of total ROS compared to WT and LAMP-2 OE lines, as measured using DCFDA (2.2±0.1-fold change for Danon A1–3 lines, 3.97±0.7-fold for Danon B1–2 lines, and 1.33±0.1-fold for LAMP2-OE line compared to WT1–2 lines). #, p<.05 vs. WT, ##, p<.01 vs. WT, **, p<.01 vs. Danon A, &, p<.05 vs. Danon B, Student’s t test, n = 3. (G): iPSC-CMs from Danon A and B lines show increased levels of mROS compared to WT and LAMP-2 OE lines, as measured using mitoSOX (1.8±0.1-fold change for Danon A1–3 lines, 2.83±0.6-fold for Danon B1–2 lines, and 1.1±0.3-fold for LAMP2-OE line compared to WT1–2 lines). #, p<.05 vs. WT, **, p<.01 vs. Danon A, &, p<.01 vs. Danon B, Student’s t test, n = 3. Data are expressed as means±SD. Abbreviations: DAPI, 4′,6-diamidino-2-phenylindole; iPSC-CMs, induced pluripotent stem cell-derived cardiomyocytes; LAMP-2, lysosomal-associated membrane protein type 2; mROS, mitochondrial oxidative stress; NAC, N-acetylcysteine; ROS, reactive oxygen species; TUNEL, terminal deoxynucleotidyl transferase dUTP nick end labeling; WT, wild-type

References

    1. He C, Klionsky DJ. Regulation mechanisms and signaling pathways of autophagy. Annu Rev Genet. 2009;43:67–93. - PMC - PubMed
    1. Singh R, Cuervo AM. Autophagy in the cellular energetic balance. Cell Metab. 2011;13:495–504. - PMC - PubMed
    1. Gonzalez CD, Lee MS, Marchetti P, et al. The emerging role of autophagy in the pathophysiology of diabetes mellitus. Autophagy. 2011;7:2–11. - PMC - PubMed
    1. Choi AM, Ryter SW, Levine B. Autophagy in human health and disease. N Engl J Med. 2013;368:651–662. - PubMed
    1. Gustafsson AB, Gottlieb RA. Autophagy in ischemic heart disease. Circ Res. 2009;104:150–158. - PMC - PubMed

Publication types