. 2015 Jun 11;125(24):3805-14.
doi: 10.1182/blood-2014-07-589283. Epub 2015 Mar 31.

Circulating cell membrane microparticles transfer heme to endothelial cells and trigger vasoocclusions in sickle cell disease

Affiliations

Circulating cell membrane microparticles transfer heme to endothelial cells and trigger vasoocclusions in sickle cell disease

Stéphane M Camus et al. Blood. .

Abstract

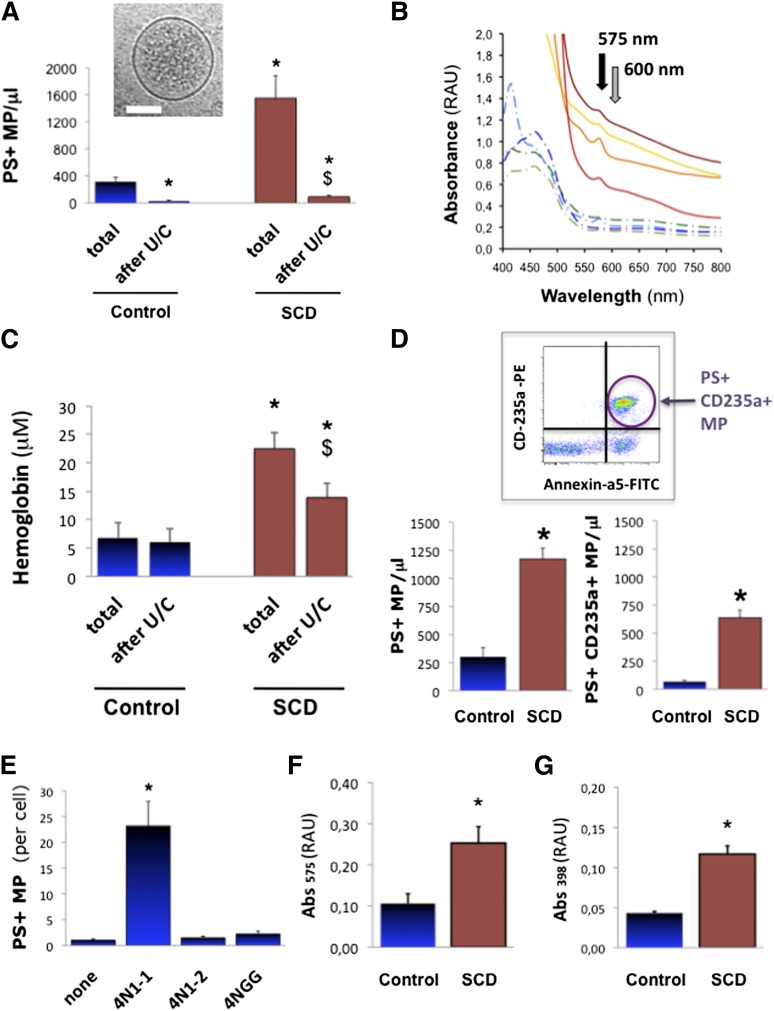
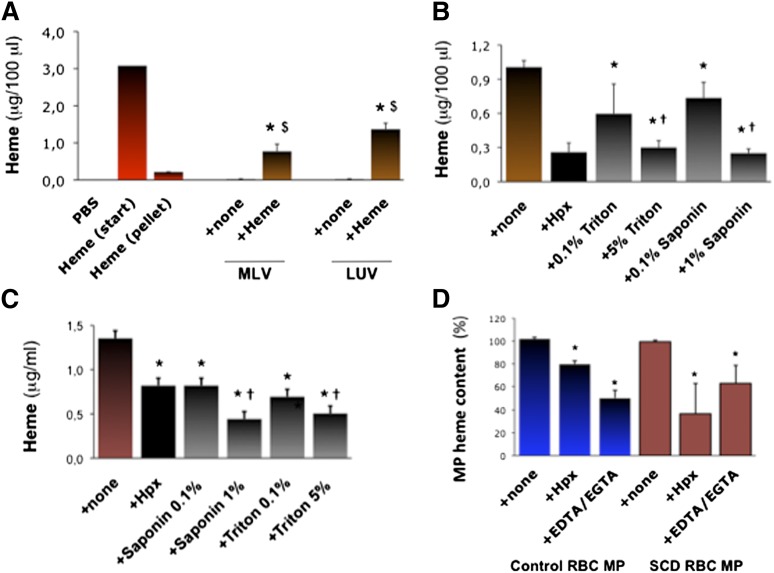
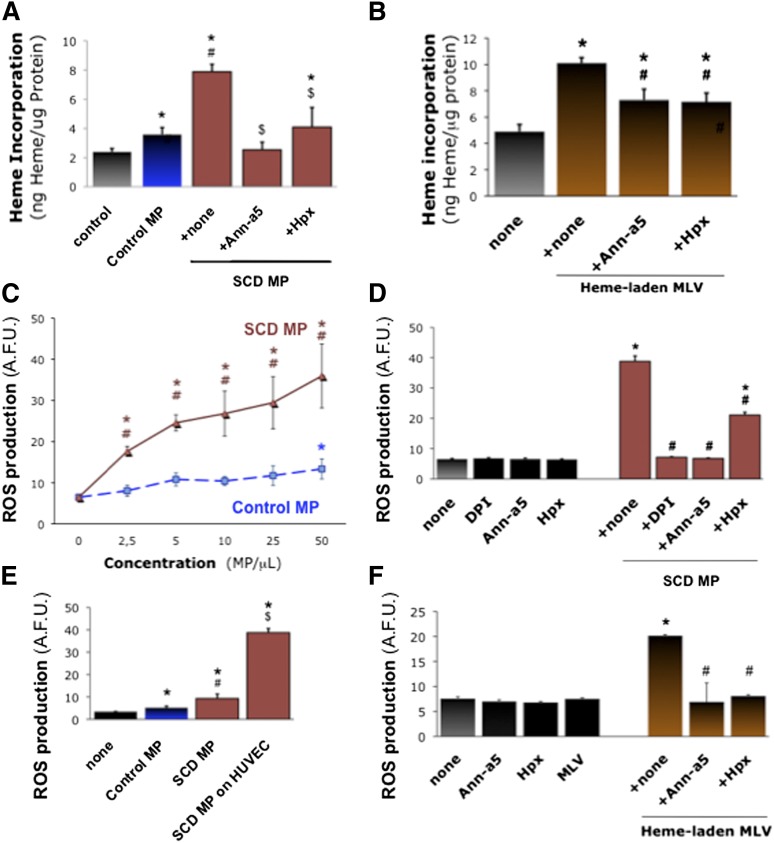
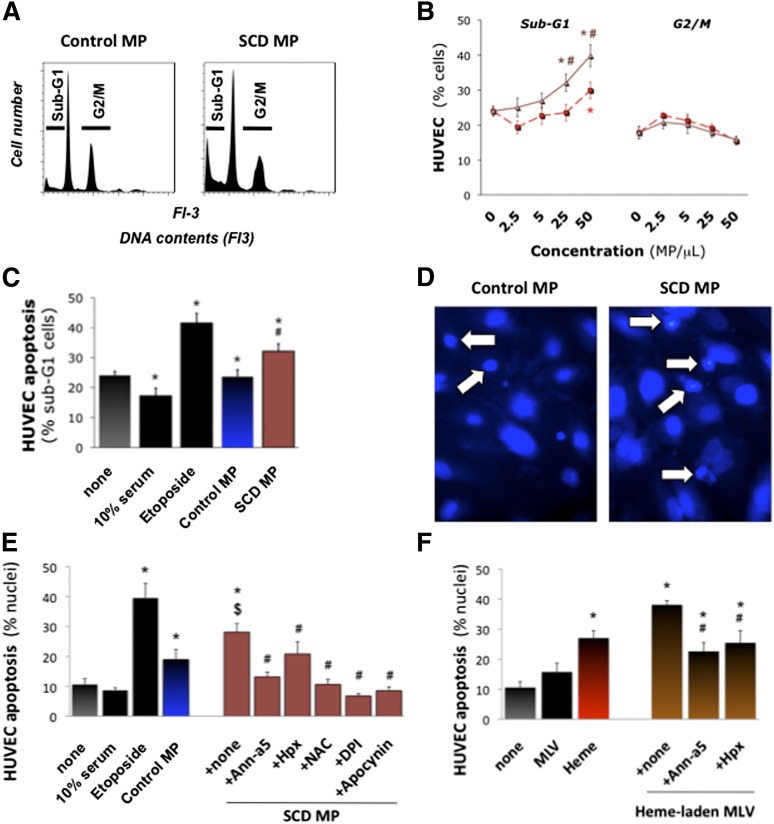
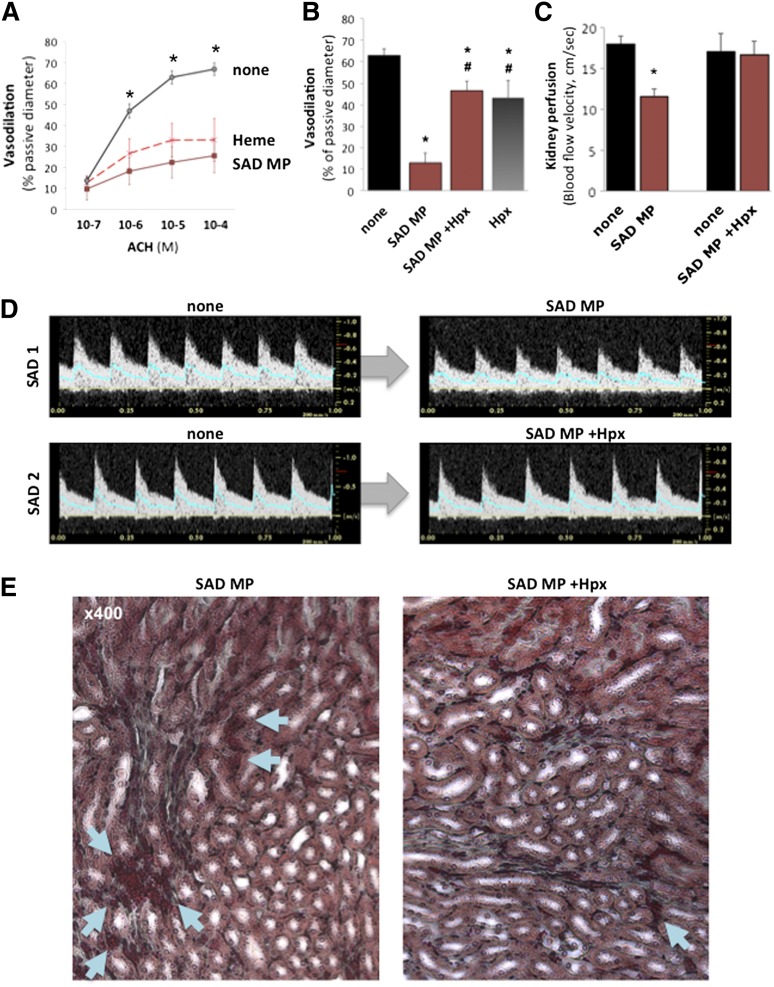
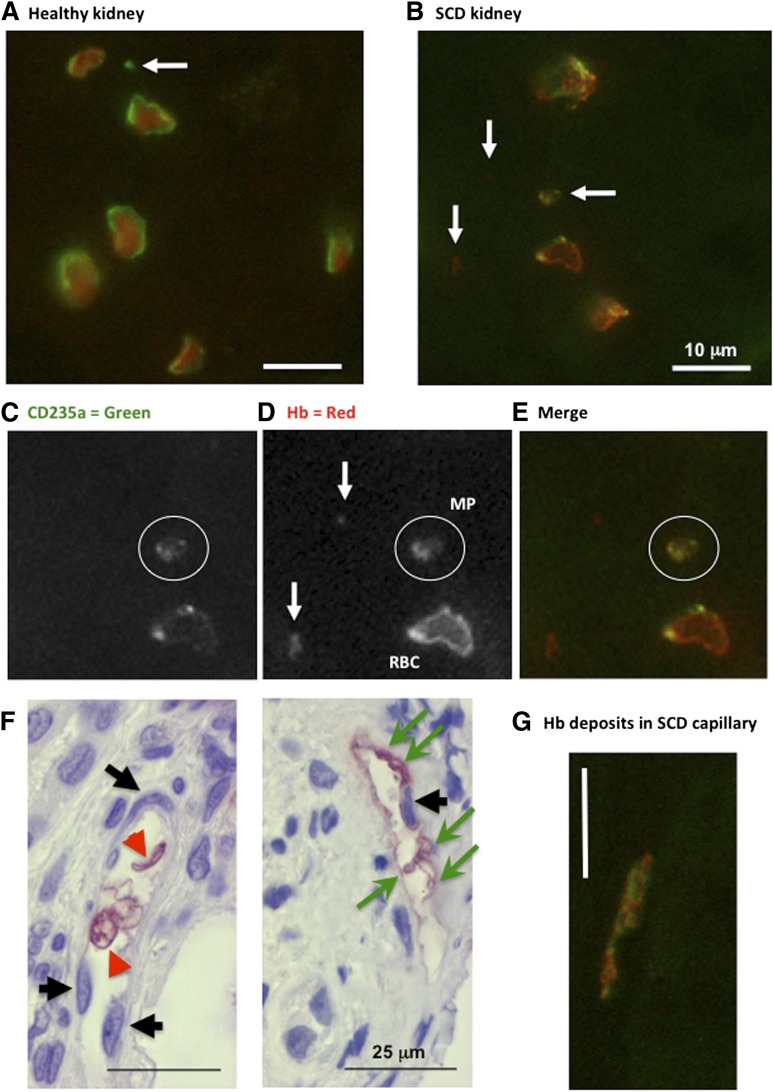
Intravascular hemolysis describes the relocalization of heme and hemoglobin (Hb) from erythrocytes to plasma. We investigated the concept that erythrocyte membrane microparticles (MPs) concentrate cell-free heme in human hemolytic diseases, and that heme-laden MPs have a physiopathological impact. Up to one-third of cell-free heme in plasma from 47 patients with sickle cell disease (SCD) was sequestered in circulating MPs. Erythrocyte vesiculation in vitro produced MPs loaded with heme. In silico analysis predicted that externalized phosphatidylserine (PS) in MPs may associate with and help retain heme at the cell surface. Immunohistology identified Hb-laden MPs adherent to capillary endothelium in kidney biopsies from hyperalbuminuric SCD patients. In addition, heme-laden erythrocyte MPs adhered and transferred heme to cultured endothelial cells, inducing oxidative stress and apoptosis. In transgenic SAD mice, infusion of heme-laden MPs triggered rapid vasoocclusions in kidneys and compromised microvascular dilation ex vivo. These vascular effects were largely blocked by heme-scavenging hemopexin and by the PS antagonist annexin-a5, in vitro and in vivo. Adversely remodeled MPs carrying heme may thus be a source of oxidant stress for the endothelium, linking hemolysis to vascular injury. This pathway might provide new targets for the therapeutic preservation of vascular function in SCD.


Figures

Figure 1
Figure 1
Heme-MP association in SCD plasma. Circulating PS+ MPs (A) were quantified in platelet-free plasma (PFP) from steady-state SCD patients (n = 47) or control matched healthy volunteers (n = 22) by fluorescence-activated cell sorter (FACS) after annexin-a5 labeling, as well as plasma Hb by spectrophotometry (Abs575-Abs600), before and after MP depletion by ultracentrifugation (U/C). (B) Whole spectrum analysis of light absorbance in SCD (full lines) and control PFP (dotted lines). Black arrow marks peak of Hb absorbance at 575 nm; gray arrow points at 600 nm. (C) Absorbance (Abs575-Abs600) in PFP from control volunteers and steady-state SCD patients. *P < .01 vs total in controls; $P < .05 vs total in SCD. (D) Circulating erythrocyte MPs were quantified in plasma from control and SCD patients (n = 12) by FACS after phycoerythrin-conjugated anti-CD235a+ immunoglobulin G (IgG) labeling; *P = .01. We generated stocks of MPs shed by purified erythrocytes in vitro. SCD and control erythrocytes were incubated in vitro with CD47 agonist peptide 4N1-1, truncated 4N1-2, or mutated 4NGG peptide (25 μM, 30 minutes). (E) Quantification of MPs released by control erythrocytes, by FACS after annexin-a5 labeling. Supernatants were ultracentrifuged to pellet MPs, which were resuspended at similar concentrations in PBS (500 MPs/μ). Spectrophotometric measurements relative to Hb (Abs575) (F) and heme (Abs398) (G) were gathered. *P < .05 vs control MPs.
Figure 2
Figure 2
Characterization of heme interactions with MP membranes. We synthetized MLVs or LUVs in vitro. (A) We incubated MLVs and LUVs (5000 vesicles/100 μL) in 50 μM heme or PBS (+ none) for 1 hour. Vesicles were then washed and concentrated in PBS. We quantified heme in vesicles alone and in heme-incubated vesicles by spectrophotometry (Abs398), compared with serial heme dilutions. Abs398 was also assessed in the initial heme solution before (start) and after ultracentrifugation without vesicles (pellet). Abs398 was measured in vesicles prior to or after incubation in heme. $P < .05 vs heme after ultracentrifugation (pellet); $P < .05 vs vesicles + none. (B) Heme-incubated MLVs were treated for 1 hour with triton and saponin (up to 5%) or Hpx (10 μM). Abs398 was then measured after de novo ulracentrifugation. *P < .01 vs MLV + none; P < .05 vs lower detergent concentrations. (C) SCD erythrocyte MPs were incubated with triton or saponin (up to 5%), and Abs398 was measured compared with a heme dilution curve. *P < .05 vs MPs + none; P < .05 vs low detergent concentrations. (D) In similar experiments, initial MP heme content was expressed at 100%. Control and SCD erythrocyte MPs (5000 PS+ MPs/100 μL; n = 4) were incubated with Hpx (2 μM) or EGTA-EDTA mix (both at 250 μM). *P < .05 vs MP + none.
Figure 3
Figure 3
Endothelial activation by heme-laden MPs. Confluent HUVEC monolayers were treated for 2 hours with erythrocyte MPs or synthetic vesicles. Some MPs were preincubated for 1 hour with specific inhibitors of MPs PS (10 μg/mL annexin-a5) and heme (Hpx, 2 μM). HUVECs were incubated with MPs derived from SCD or control erythrocytes (50 MPs/μL; ie, ∼20 nM heme for control MPs and 65 nM heme for SCD MPs) (A), or synthetic heme-laden MLVs (50 MLVs/μL) (B), washed with PBS, and lysed. Heme incorporation was estimated by spectrophotometry (Abs398) with respect to serial heme dilutions and normalized for protein contents; *P < .05 vs control; #P < .05 vs control MPs; $P < .05 vs MPs + none. (C) We analyzed ROS generation after incubation of HUVECs with SCD and control erythrocyte MPs (25 MPs/μL), with or without preincubation for 1 hour with annexin-a5 or Hpx. (D) HUVECs were preincubated for 1 hour with reduced NAD phosphate inhibitor DPI (10 μM). Here, fluorescent H2-DFF-DA was added after 30 minutes with MPs, and ROS production measured after 90 minutes. *P < .05 vs control; #P < .05 vs MPs + none. (E) Alternatively, we assessed ROS production by erythrocyte MPs alone for 1 hour in H2-DFF-DA, in absence of HUVECs. *P < .05 vs none; #P < .05 vs control MPs; $P < .05 vs SCD MPs without endothelium. (F) We assessed the effects of heme-laden MLVs on HUVEC ROS production, after incubation with annexin-a5 (10 μg/mL) or Hpx (2 μM). *P < .05 vs control; #P < .05 vs MLVs + none.
Figure 4
Figure 4
Endothelial apoptosis by heme-laden MPs. Confluent HUVEC monolayers were treated with purified erythrocyte MPs (25 MPs/μL), synthetic heme-laden MLVs, or heme alone (5 μM) for 16 hours. Some MPs were preincubated with annexin-a5 (10 μg/mL) or Hpx (2 μM) for 1 hour. HUVECs were then fixed. Total DNA contents were determined by FACS after coloration with propidium iodide. Cells undergoing apoptosis (sub-G1 phase) or proliferation (G2/M) were quantified. (A) Representative DNA content profiles. We compared the effects of serial dilutions of control and SCD erythrocyte MPs (B) vs high serum (10% serum) or proapoptotic etoposide (100 μM). Triangles, SCD MPs; squares, control MPs. *P < .05 vs none; #P < .05 vs control MPs. (C) In other experiments, HUVECs were fixed in situ and stained with 4,6-diamidino-2-phenylindole. Nuclei displaying fragmentation, pyknosis, or condensed chromatin by fluorescence microscopy were counted as apoptotic and expressed as percentage. (D) Representative images (×400). Arrows designate fragmented and condensed nuclei. (E) Quantification of degraded nuclei after incubation with erythrocyte MPs (25 MPs/μL), vs high serum (10% serum), or proapoptotic etoposide. Some HUVECs were preincubated for 30 minutes with NAC (5 mM), DPI (10 μM), or apocynin (100 μM). *P < .05 vs none; $P < .05 vs control MPs; #P < .05 vs SCD MPs. (F) Effects of synthetic heme-laden MLVs preincubated with annexin-a5 or Hpx. *P < .05 vs none; #P < .05 vs SCD MPs.
Figure 5
Figure 5
Erythrocyte MP heme induces endothelial damage and vasoocclusions. Mouse mesenteric resistances arteries were perfused with PSS alone, and initial diameters provided controls. Arterioles were then preconstricted with phenylephrine, and endothelium-dependent vasodilation was assessed in response to ACH (10−7 to 10−4 M). Arterioles were washed, constricted again with phenylephrine, and perfused with either SAD erythrocyte MPs (300 MPs/μL), or heme (100 nM) at 75 mm Hg pressure and 20 μL/s flow. (A) Endothelium-dependent vasodilation in response to increasing ACH doses (10−7 to 10−4 M) was quantified and expressed as percentage of passive diameter. *P < .05 vs SAD MPs (brown line) and heme (red dashes). (B) Some SAD MPs were pretreated with Hpx (1 µM, 1 hour) prior to perfusion. *P < .05 vs control; #P < .05 vs SAD MPs alone (+ none). To evaluate vasoocclusions in vivo, we injected 2 × 10⁴ SAD erythrocyte MPs per mouse (brown) intravenously to SAD transgenic mice. We monitored kidney vasoocclusions by recording echo-Doppler velocity waveforms (C-D) and hemodynamic parameters. In each SAD mouse, we recorded the mean blood flow velocity (cm/s) in the right renal artery (blue line in Doppler velocity waveforms), before (none) or after intravenous injection of 2 × 10⁴ SAD mouse erythrocyte MPs. Some MPs were preincubated with Hpx as previously described prior to injection. *P < .05 vs none. (E) Histologic analysis by Masson trichrome staining of SAD kidneys, 5 minutes after injection of SAD MPs, alone or preincubated with Hpx. Arrows show erythrocytes, with larger deposits and vascular congestion in SAD.
Figure 6
Figure 6
Immunohistochemistry for CD235a (glycophoryin) and Hb in human renal biopsies. Fluorescence immunohistochemistry in human normal peritumoral control (A) and SCD (B-G) kidney sections (n = 2) reacted with anti-human Hb and anti-human CD-235a IgG. High magnification micrographs were taken from tubulo-interstitial area (×600; white bars = 10 μm). White arrows identify CD235a+ or Hb+ particles. White circles surround a double-stained MPs. Note the submembrane deposition of Hb within SCD erythrocytes (C-E). (F) Immunohistochemistry with anti-human Hb IgG (×400). Black arrows identify counterstained capillary endothelial cell nuclei. Green arrows show Hb-positive cell fragments, and red arrowheads point at intact erythrocytes. Red stain reveals Hb in intact erythrocytes or deposited at the surface of nucleated vascular wall cells. (G) Fluorescence immunohistochemistry (×600) showing vascular Hb deposits.

Comment in

References

    1. Vallelian F, Schaer CA, Kaempfer T, et al. Glucocorticoid treatment skews human monocyte differentiation into a hemoglobin-clearance phenotype with enhanced heme-iron recycling and antioxidant capacity. Blood. 2010;116(24):5347–5356. - PubMed
    1. Muller-Eberhard U, Javid J, Liem HH, Hanstein A, Hanna M. Plasma concentrations of hemopexin, haptoglobin and heme in patients with various hemolytic diseases. Blood. 1968;32(5):811–815. - PubMed
    1. Reiter CD, Wang X, Tanus-Santos JE, et al. Cell-free hemoglobin limits nitric oxide bioavailability in sickle-cell disease. Nat Med. 2002;8(12):1383–1389. - PubMed
    1. Westerman M, Pizzey A, Hirschman J, et al. Microvesicles in haemoglobinopathies offer insights into mechanisms of hypercoagulability, haemolysis and the effects of therapy. Br J Haematol. 2008;142(1):126–135. - PubMed
    1. Hebbel RP. Reconstructing sickle cell disease: a data-based analysis of the “hyperhemolysis paradigm” for pulmonary hypertension from the perspective of evidence-based medicine. Am J Hematol. 2011;86(2):123–154. - PubMed

Publication types

MeSH terms