

Defects in mitophagy promote redox-driven metabolic syndrome in the absence of TP53INP1
- PMID: 25828351
- PMCID: PMC4459819
- DOI: 10.15252/emmm.201404318
Defects in mitophagy promote redox-driven metabolic syndrome in the absence of TP53INP1
Abstract
The metabolic syndrome covers metabolic abnormalities including obesity and type 2 diabetes (T2D). T2D is characterized by insulin resistance resulting from both environmental and genetic factors. A genome-wide association study (GWAS) published in 2010 identified TP53INP1 as a new T2D susceptibility locus, but a pathological mechanism was not identified. In this work, we show that mice lacking TP53INP1 are prone to redox-driven obesity and insulin resistance. Furthermore, we demonstrate that the reactive oxygen species increase in TP53INP1-deficient cells results from accumulation of defective mitochondria associated with impaired PINK/PARKIN mitophagy. This chronic oxidative stress also favors accumulation of lipid droplets. Taken together, our data provide evidence that the GWAS-identified TP53INP1 gene prevents metabolic syndrome, through a mechanism involving prevention of oxidative stress by mitochondrial homeostasis regulation. In conclusion, this study highlights TP53INP1 as a molecular regulator of redox-driven metabolic syndrome and provides a new preclinical mouse model for metabolic syndrome clinical research.
Keywords: autophagy; diabetes; mitochondria; obesity; oxidative stress.
© 2015 The Authors. Published under the terms of the CC BY 4.0 license.
Figures
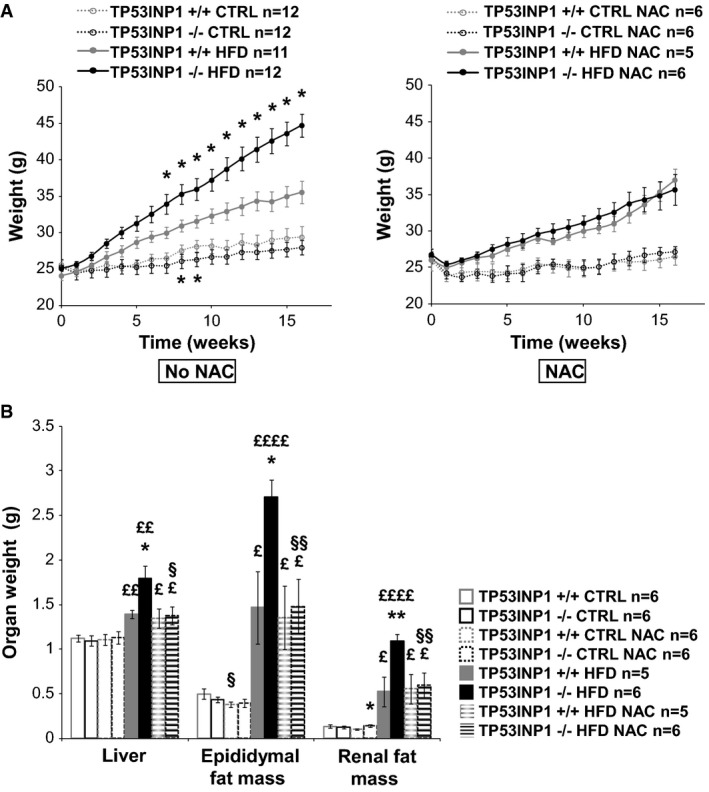
Curves show mice body weight recorded every week. CTRL: P (−/− versus +/+; t = 8w) = 0.047; P (−/− versus +/+; t = 9w) = 0.023. HFD: P (−/− versus +/+; t = 7w) = 0.039; P (−/− versus +/+; t = 8w) = 0.029; P (−/− versus +/+; t = 9w) = 0.021; P (−/− versus +/+; t = 10w) = 0.014; P (−/− versus +/+; t = 11w) = 0.0046; P (−/− versus +/+; t = 12w) = 0.0028; P (−/− versus +/+; t = 13w) = 0.0025; P (−/− versus +/+; t = 14w) = 0.00051; P (−/− versus +/+; t = 15w) = 0.00027; P (−/− versus +/+; t = 16w) = 0.00013.
At the end of protocol, mice were sacrificed; liver and epididymal and renal fat masses were taken and weighed. Histograms show organ weight. Liver: P (−/− versus +/+; HFD) = 0.014; P (HFD versus CTRL; +/+) = 0.00063; P (HFD versus CTRL; −/−) = 0.0010; P (HFD versus CTRL; +/+ NAC) = 0.034; P (HFD versus CTRL; −/− NAC) = 0.027; P (NAC versus no NAC; −/− HFD) = 0.014. Epididymal fat mass: P (−/− versus +/+; HFD) = 0.011; P (HFD versus CTRL; +/+) = 0.028; P (HFD versus CTRL; −/−) = 0.000017; P (HFD versus CTRL; +/+ NAC) = 0.019; P (HFD versus CTRL; −/− NAC) = 0.0054; P (NAC versus no NAC; +/+ CTRL) = 0.037; P (NAC versus no NAC; −/− HFD) = 0.0025. Renal fat mass: P (−/− versus +/+; HFD) = 0.0041; P (HFD versus CTRL; +/+) = 0.028; P (HFD versus CTRL; −/−) = 0.000013; P (HFD versus CTRL; +/+ NAC) = 0.019; P (HFD versus CTRL; −/− NAC) = 0.0078; P (NAC versus no NAC; −/− HFD) = 0.0047.
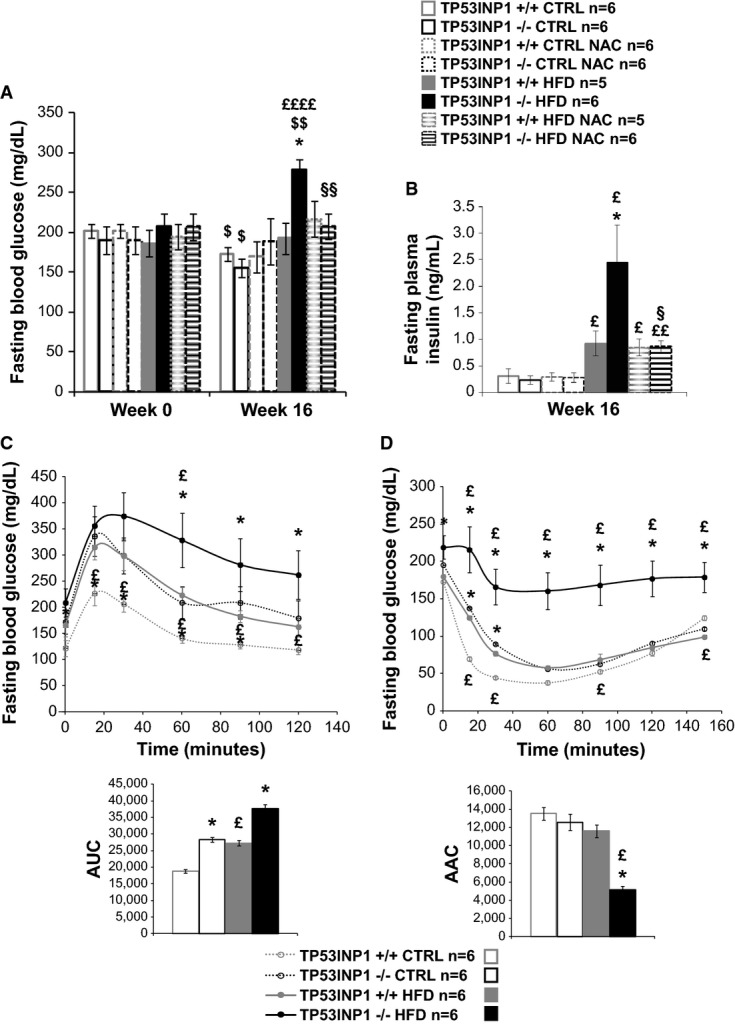
A, B Histograms show blood glucose (A) or plasma insulin (B) levels of 6-h-fasted mice at the beginning (Week 0) and/or at the end of the protocol (Week 16). Fasting blood glucose week 16: P (−/− versus +/+; HFD) = 0.0052; P (CTRL versus HFD; −/−) = 0.000081; P (NAC versus no NAC; −/− HFD) = 0.0019; P (w16 versus w0; +/+ CTRL) = 0.012; P (w16 versus w0; −/− CTRL) = 0.050; P (w16 versus w0; −/− HFD) = 0.0023. Fasting plasma insulin: P (−/− versus +/+; HFD) = 0.043; P (CTRL versus HFD; +/+) = 0.028; P (CTRL versus HFD; −/−) = 0.013; P (CTRL versus HFD; +/+ NAC) = 0.011; P (CTRL versus HFD; −/− NAC) = 0.0015; P (NAC versus no NAC; −/− HFD) = 0.038.
C Glucose tolerance test (GTT) was performed on 6-h-fasted mice during 120 min after injection of 1 g glucose/kg of body weight. Curves on the left show blood glucose level monitored after injection of glucose. Histograms on the right show area under curve (AUC). Fasting blood glucose: P (−/− versus +/+; CTRL; t = 0 min) = 0.045; P (−/− versus +/+; CTRL; t = 15 min) = 0.013; P (−/− versus +/+; CTRL; t = 30 min) = 0.016; P (−/− versus +/+; CTRL; t = 60 min) = 0.030; P (−/− versus +/+; CTRL; t = 90 min) = 0.017; P (−/− versus +/+; HFD; t = 60 min) = 0.041; P (−/− versus +/+; HFD; t = 90 min) = 0.043; P (−/− versus +/+; HFD; t = 120 min) = 0.034; P (HFD versus CTRL; +/+; t = 15 min) = 0.0076; P (HFD versus CTRL; +/+; t = 30 min) = 0.0067; P (HFD versus CTRL; +/+; t = 60 min) = 0.00058; P (HFD versus CTRL; +/+; t = 90 min) = 0.0010; P (HFD versus CTRL; +/+; t = 120 min) = 0.023; P (HFD versus CTRL; −/−; t = 60 min) = 0.032. AUC: P (−/− versus +/+; CTRL) = 0.023; P (−/− versus +/+; HFD) = 0.035; P (HFD versus CTRL; +/+) = 0.042.
D Insulin tolerance test (ITT) was performed on 6-h-fasted mice during 150 min after injection of 0.70 U insulin/kg of body weight. Curves on the left show blood glucose level monitored after injection of insulin. Histograms on the right show area above curve (AAC). Fasting blood glucose: P (−/− versus +/+; CTRL; t = 15 min = 0.012; P (−/− versus +/+; CTRL; t = 30 min) = 0.022; P (−/− versus +/+; HFD; t = 0 min) = 0.027; P (−/− versus +/+; HFD; t = 15 min) = 0.011; P (−/− versus +/+; HFD; t = 30 min) = 0.0037; P (−/− versus +/+; HFD; t = 60 min) = 0.0028; P (−/− versus +/+; HFD; t = 90 min) = 0.041; P (−/− versus +/+; HFD; t = 120 min) = 0.0032; P (−/− versus +/+; HFD; t = 150 min) = 0.0025; P (HFD versus CTRL; +/+; t = 15 min) = 0.0082; P (HFD versus CTRL; +/+; t = 30 min) = 0.033; P (HFD versus CTRL; +/+; t = 90 min) = 0.047; P (HFD versus CTRL; +/+; t = 150 min) = 0.028; P (HFD versus CTRL; −/−; t = 15 min) = 0.026; P (HFD versus CTRL; −/−; t = 30 min) = 0.0095; P (HFD versus CTRL; −/−; t = 60 min) = 0.0031; P (HFD versus CTRL; −/−; t = 90 min) = 0.033; P (HFD versus CTRL; −/−; t = 120 min) = 0.0068; P (HFD versus CTRL; −/−; t = 150 min) = 0.0082. AAC: P (−/− versus +/+; HFD) = 0.030; P (HFD versus CTRL; −/−) = 0.037.
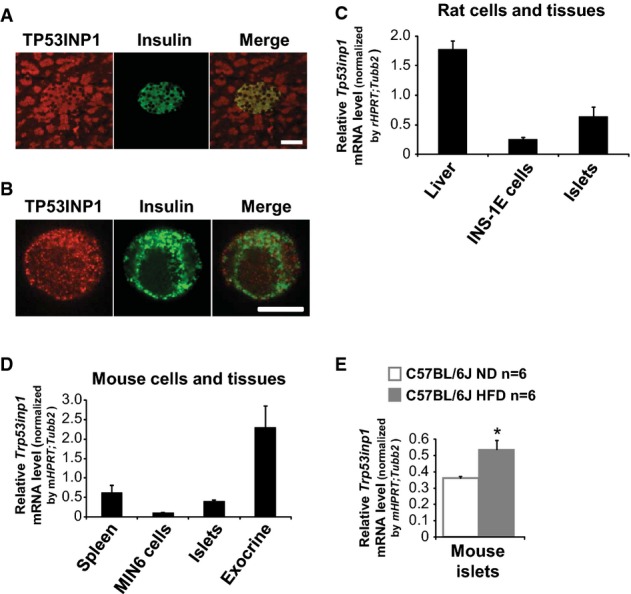
A, B (A, B) Immunocytofluorescent staining of TP53INP1 (red) and insulin (green) in mouse pancreatic sections (A) and single human islet beta cell (B). Scale bars represent 50 μm (A) and 10 μm (B).
C–E Quantitative PCR for Tp53inp1 mRNA levels in tissues and cells from rat (C) and C57BL/6J mice fed with a normal diet (5% fat; ND) or an high-fat diet (45% fat; HFD) (D, E). Results are expressed as the mean ± SEM and are representative of two independent experiments. n = 2 for rat liver, islets and mouse spleen; n = 4 for INS-1E cells; n = 5 for mouse exocrine pancreas; n = 6 for Min6 cells and ND and HFD islets; n = 11 for mouse islets. *P = 0.035 for HFD versus ND.
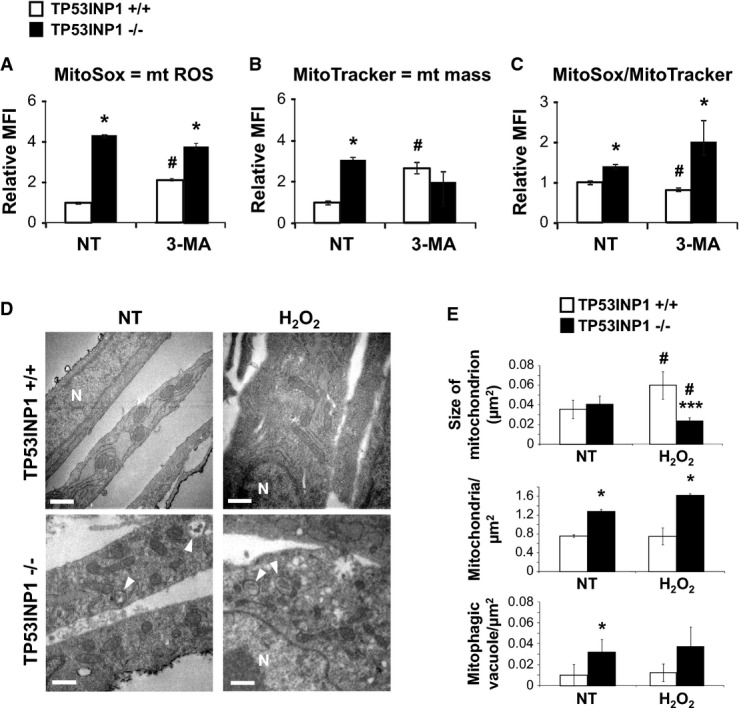
Histograms show mt ROS level measured by flow cytometry upon MitoSox staining. P (−/− versus +/+; NT) = 0.019; P (−/− versus +/+; 3-MA) = 0.025; P (3-MA versus NT; +/+) = 0.031.
Histograms show mt mass evaluated by flow cytometry in KO or WT MEFi using MitoTracker staining. P (−/− versus +/+; NT) = 0.012; P (3-MA versus NT; +/+) = 0.036.
Histogram shows MitoSox fluorescence normalized with MitoTracker fluorescence. P (−/− versus +/+; NT) = 0.041; P (−/− versus +/+; 3-MA) = 0.030; P (3-MA versus NT; +/+) = 0.045.
After 4 h recovering in normal media, H2O2 (1 h, 100 μM) or non-treated (NT) MEFi deficient (−/−) or not (+/+) for TP53INP1 were observed by transmission electron microscopy (TEM). N = nucleus; white arrow = mitophagic vacuoles. Scale bar represents 0.5 μm.
Mean size of mitochondrion (area), number of mitochondria and mitophagic vacuoles normalized by cytoplasmic surface area were quantified. Size: P (−/− versus +/+; H2O2) = 0.000027; P (H2O2 versus NT; +/+) = 0.0070; P (H2O2 versus NT; −/−) = 0.013. Nb mito.: P (−/− versus +/+; NT) = 0.035; P (−/− versus +/+; H2O2) = 0.016. Nb vacuoles.: P (−/− versus +/+; NT) = 0.047.
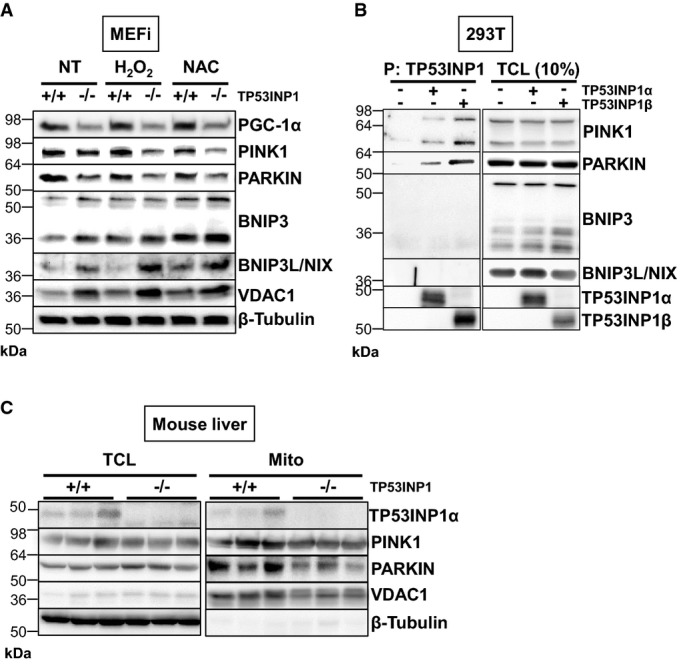
After 4 h recovering in normal media, TCLs from H2O2- (1 h, 100 μM), NAC- (24 h, 10 mM) or non-treated (NT) MEFi deficient (−/−) or not (+/+) for TP53INP1 were analyzed by immunoblotting for PGC-1α, PINK1, PARKIN, BNIP3, BNIP3L/NIX, VDAC1 and β-tubulin.
HEK293T cells were cotransfected with plasmids encoding TP53INP1α-NTAP or TP53INP1β-NTAP. TP53INP1α- or β-NTAP was precipitated with a streptavidin-containing resin (P), resolved by PAGE and Western blots developed with anti-TP53INP1 (TP53INP1 precipitation control), anti-PINK1, anti-PARKIN, anti-BNIP3 or anti-BNIP3L/NIX antibody. Western blot on TCL (on the right) served as a transfection control.
Three-month-old TP53INP1-deficient and WT male mice were sacrificed and their livers harvested. Mitochondrial lysates (Mito) were purified from total liver lysates (TCL), and both were analyzed by immunoblotting for TP53INP1, PINK1, PARKIN, VDAC1 and β-tubulin.
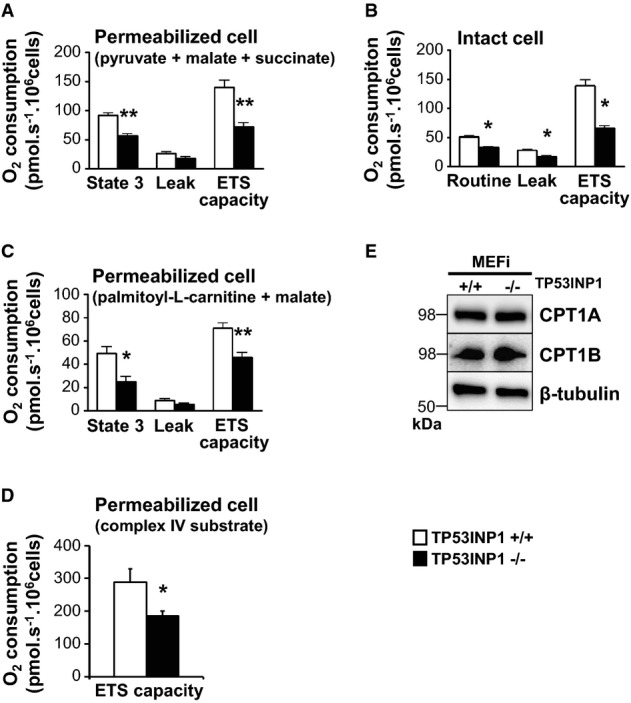
A–D High-resolution respirometry was performed on permeabilized MEFi TP53INP1 deficient (−/−, black bars) or not (+/+, white bars) using glucose (A), lipid-related substrates (C) or complex IV substrate (D). High-resolution respirometry was also performed on intact MEFi (B). For different respiratory state details (routine, 3, leak, and ETS capacity), please refer to the Materials and Methods section. Results are expressed as the mean ± SEM and are representative of three independent experiments. In (A): P (−/− versus +/+; State 3) = 0.0079; P (−/− versus +/+; ETS) = 0.0079; n = 5 in each group. In (B): P (−/− versus +/+; routine) = 0.0159; P (−/− versus +/+; leak) = 0.0159; P (−/− versus +/+; ETS) = 0.0159; n = 5 in each group. In (C): P (−/− versus +/+; State 3) = 0.029; P (−/− versus +/+; ETS) = 0.0079; n = 5 in each group. In (D): P (−/− versus +/+; ETS) = 0.0259; n = 5 in each group. *TP53INP1−/− versus TP53INP1 +/+; 1 character: P < 0.05; 2 characters: P < 0.01.
E TCLs from MEFi were analyzed by immunoblotting for CPT1A, CPT1B and β-tubulin. Results are representative of three independent experiments.
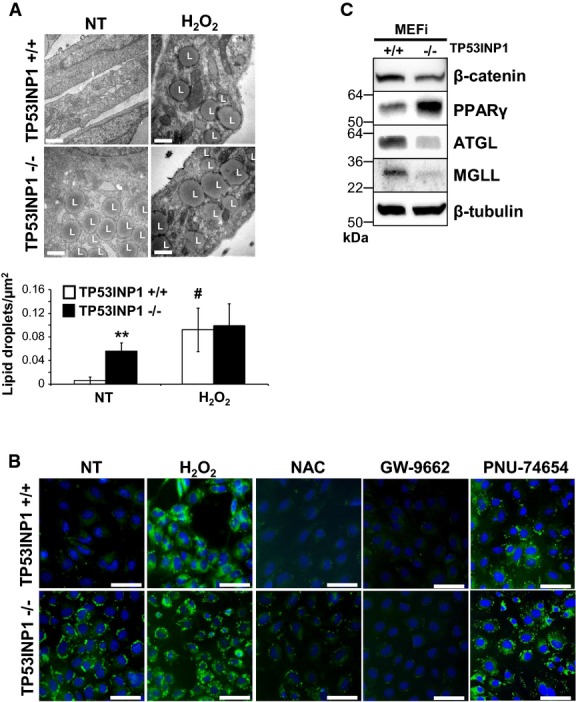
Number of LD normalized by cytoplasmic surface area is shown in both histograms at the bottom of the figure. Scale bar represents 0.5 μm. Results are expressed as the mean ± SEM and are representative of three independent experiments. *P (−/− versus +/+; NT) = 0.00086; #P (H2O2 versus NT; +/+) = 0.013.
Cells were also observed by fluorescence microscopy after Bodipy493/503 staining of LD (green) and DAPI staining of nucleus (blue). L = lipid droplets. Scale bar represents 100 μm. Results are representative of three independent experiments.
TCLs from MEFi were analyzed by immunoblotting for β-catenin, PPARγ, ATGL, MGLL and β-tubulin. Results are representative of three independent experiments.
References
-
- Anty R, Bekri S, Luciani N, Saint-Paul MC, Dahman M, Iannelli A, Amor IB, Staccini-Myx A, Huet PM, Gugenheim J, et al. The inflammatory C-reactive protein is increased in both liver and adipose tissue in severely obese patients independently from metabolic syndrome, Type 2 diabetes, and NASH. Am J Gastroenterol. 2006;101:1824–1833. - PubMed
-
- Bekri S, Gual P, Anty R, Luciani N, Dahman M, Ramesh B, Iannelli A, Staccini-Myx A, Casanova D, Ben Amor I, et al. Increased adipose tissue expression of hepcidin in severe obesity is independent from diabetes and NASH. Gastroenterology. 2006;131:788–796. - PubMed
-
- Bondia-Pons I, Ryan L, Martinez JA. Oxidative stress and inflammation interactions in human obesity. J Physiol Biochem. 2012;68:701–711. - PubMed
Publication types
MeSH terms
Substances
Grants and funding
LinkOut - more resources
Full Text Sources
Other Literature Sources
Medical
Molecular Biology Databases
