. 2015 Aug 15;21(16):3705-15.
doi: 10.1158/1078-0432.CCR-14-2809. Epub 2015 Mar 31.

Pharmacological and Protein Profiling Suggests Venetoclax (ABT-199) as Optimal Partner with Ibrutinib in Chronic Lymphocytic Leukemia

Affiliations

Pharmacological and Protein Profiling Suggests Venetoclax (ABT-199) as Optimal Partner with Ibrutinib in Chronic Lymphocytic Leukemia

Fabiola Cervantes-Gomez et al. Clin Cancer Res. .

Abstract

Purpose: Bruton's tyrosine kinase (BTK) is a critical enzyme in the B-cell receptor pathway and is inhibited by ibrutinib due to covalent binding to the kinase domain. Though ibrutinib results in impressive clinical activity in chronic lymphocytic leukemia (CLL), most patients achieve only partial remission due to residual disease. We performed a pharmacologic profiling of residual circulating CLL cells from patients receiving ibrutinib to identify optimal agents that could induce cell death of these lymphocytes.

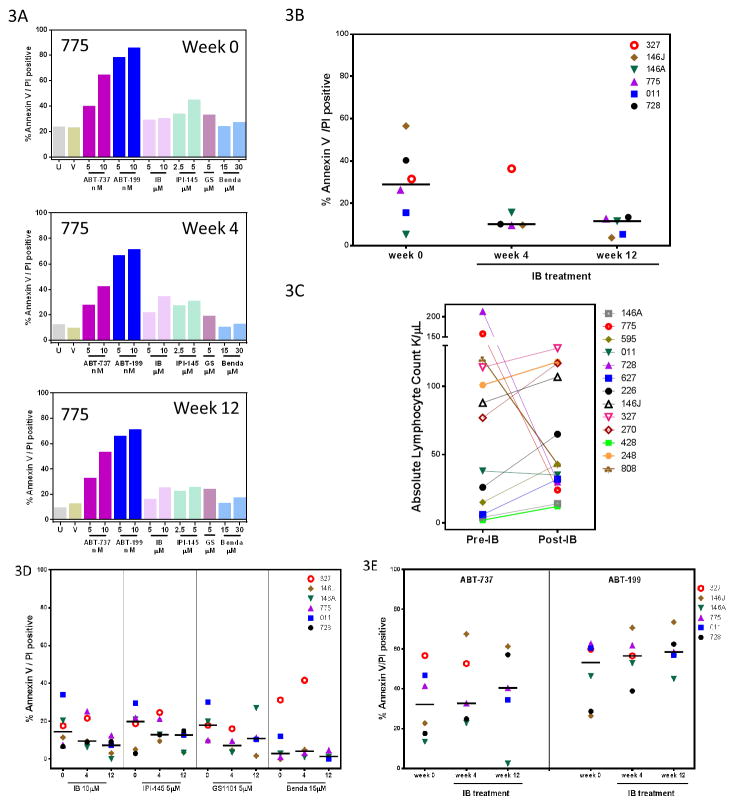
Experimental design: Ex vivo serial samples of CLL cells from patients on ibrutinib were obtained prior and after (weeks 2, 4, and 12) the start of treatment. These cells were incubated with PI3K inhibitors (idelalisib or IPI-145), bendamustine, additional ibrutinib, or BCL-2 antagonists (ABT-737 or ABT-199), and cell death was measured. In vitro investigations complemented ex vivo studies. Immunoblots for BTK signaling pathway and antiapoptotic proteins were performed.

Results: The BCL-2 antagonists, especially ABT-199, induced high cell death during ex vivo incubations. In concert with the ex vivo data, in vitro combinations also resulted in high cytotoxicity. Serial samples of CLL cells obtained before and 2, 4, 12, or 36 weeks after the start of ibrutinib showed inhibition of BTK activity and sensitivity to ABTs. Among the three BCL-2 family antiapoptotic proteins that are overexpressed in CLL, levels of MCL-1 and BCL-XL were decreased after ibrutinib while ABT-199 selectively antagonizes BCL-2.

Conclusions: Our biologic and molecular results suggest that ibrutinib and ABT-199 combination should be tested clinically against CLL.


Conflict of interest statement

Conflict-of-interest: VG received sponsored research agreement from Pharmacyclics; other authors declare no competing financial interests.

Figures

Figure 1
Figure 1. Ex vivo studies in circulating residual CLL cells from patients enrolled in an ibrutinib clinical trial
A, Lymphocytes isolated from 1 ibrutinib-treated CLL patient (#595) were incubated ex vivo for 24 hours with therapeutic agents currently in clinical trials or approved for CLL: inhibitors of PI3K (idelalisib [GS1101; GS] and IPI-145), BTK inhibitor (ibrutinib [IB]), BCL-2 antagonists (ABT-737 and ABT-199), and an alkylating agent (bendamustine [Benda]). The concentrations of the drugs are shown on the abscissa. After the incubation period, cell death was determined by Annexin V / PI staining using flow cytometry. Untreated (U) and vehicle-treated (V) cells were also included for each experiment. The level of endogenous cell death, determined in vehicle control (DMSO)-treated cultures, was subtracted from all treatments in each sample to determine the cytotoxicity exerted only by the agents. B, Additional CLL cells were isolated from peripheral blood obtained from patients (n=10) who had received ibrutinib for 4 weeks and were treated ex vivo under the same conditions as in Figure 1A. C and D, Lymphocytes were isolated from the blood of patients who had received ibrutinib for 2, 4, and 12 weeks and were treated with ABT-737 (C) and ABT-199 (D) ex vivo for 24 hours. Cell death was measured and plotted as described for Fig. 1A.
Figure 2
Figure 2. In vitro studies in CLL lymphocytes obtained from blood of ibrutinib-naïve CLL patients
AC, IC50 values were calculated for ibrutinib (A), ABT-737 (B), and ABT-199 (C). For this, CLL cells were incubated with the individual drugs at various concentrations, and cell viability was then tested using Annexin V/PI staining. DG, A second IC50 assessment was performed for the combinations using 2 ibrutinib concentrations, 5 and 10 μM, with ABT-737 (D, E) and ABT-199 (F, G). Cells were incubated with escalating concentrations of ABT-737 and a fixed concentration of ibrutinib, 5 μM (D) or 10 μM (E), or with escalating doses of ABT-199 and a fixed concentration of ibrutinib, 5 μM (F) and 10 μM (G). Cell death was measured as described before. H and I, Assessment of combination. (H) Lymphocytes were left untreated (Unt) or incubated with the vehicle DMSO (0), ABT-737, ibrutinib, or the combination of ABT-737 plus ibrutinib for 24 hours. A parallel experiment of the same 4 treatments was done in cells stimulated with 10 μg/mL anti-IgM 30 min after vehicle, ibrutinib, or ABT-737 was added to the culture. (I) Conditions similar to those described in Fig. 2H were followed, except ABT-737 was replaced with ABT-199. Cell death was measured as described before. J, Changes in levels of phosphorylated and total protein after in vitro incubations. Immunoblots were obtained after 24 hours of incubation of CLL cells from patient #424 with single-agent ibrutinib in the absence (left panel) or presence (right panel) of anti-IgM (added 30 minutes after ibrutinib); analyzing for targets in the BTK signaling pathway and BCL-2 family proteins. Only one GAPDH was needed because all proteins were done from same gel and membrane by cutting in several sections and using antibodies from different species. We use a fluorescence based imaging system, LiCor Odyssey system to analyze our immunoblots. With this system, our secondary antibodies against primary antibodies derived from different species are tagged with different fluorescence colors.
Figure 3
Figure 3. Ex vivo studies in cells obtained from the blood of CLL patients before and after ibrutinib therapy
A, Lymphocytes were isolated from the blood of a CLL patient (#775) collected at weeks 0 (pre-ibrutinib; top panel), 4 (post-ibrutinib; middle panel), and 12 (post-ibrutinib; bottom panel). Cells were left untreated (U) or treated with vehicle (V), ABT-199, ABT-737, ibrutinib (IB), IPI-145, GS1101 (GS), and bendamustine (Benda) at the indicated concentrations for 24 hours. Annexin V /PI staining was performed by flow cytometry to determine cell death level. B, Endogenous cell death in CLL cells before and after ibrutinib therapy was assessed after 24 hour in vitro incubations in lymphocytes isolated from 6 patient samples on pre- (week 0) and post- (weeks 4 and 12) ibrutinib therapy. C, Peripheral blood was obtained from CLL patients (n= 13) before ibrutinib treatment (Pre-IB) and 4 weeks after ibrutinib administration was initiated (Post-IB). The absolute lymphocyte count for each sample was determined from clinical blood count was determined and is plotted as 1000 lymphocytes per microliter (μL) of blood. D, Six CLL patient samples were collected at weeks 0, 4, and 12 of ibrutinib treatment, and lymphocytes isolated and treated under the same conditions described for Fig. 3A. E, Cytotoxicity exerted by ex vivo treatment with ABT-737 and ABT-199 on lymphocytes isolated at weeks 0, 4, and 12 of ibrutinib treatment.
Figure 4
Figure 4. Total and phospho BTK protein levels in cells obtained from the blood of CLL patients before and after ibrutinib therapy
A, Immunoblots analyzing for p-BTK-Y223 and total BTK protein levels in untreated lymphocytes isolated from patients before (week 0) and after ibrutinib (weeks 2, 4, and 12) initiation. Both total and phospho-BTK were from the same gel. Since the antibodies were from the same species, the membrane was stripped and re-probed. We use a fluorescence based imaging system, LiCor Odyssey system to analyze our immunoblots. B, Quantitation was performed for each band, and results plotted as change compared to control (week 0) for each post-ibrutinib sample (weeks 2, 4, or 12) and plotted for p-BTK.
Figure 5
Figure 5. Antiapoptotic protein and transcript levels in cells obtained from the blood of CLL patients before and after ibrutinib therapy
AC, Lymphocytes were isolated from the peripheral blood of 6 CLL patients prior to and after therapy with ibrutinib for up to 12 weeks. Cell pellets for RPPA analysis were collected right after lymphocyte isolation (no in vitro drug treatment was performed on these cells). The plots show normalized linear data for the 3 proteins of interest, MCL-1 (A), BCL-XL (B), and BCL-2 (C). D–G, Immunoblots analyzing for MCL-1, BCL-XL, and BCL-2 (D) protein levels in untreated lymphocytes isolated from patients before (week 0) and after ibrutinib (weeks 2, 4, and 12) initiation. All three BCL-2 antiapoptotic proteins were from the same gel and were visualized using antibodies from different species. We use a fluorescence based imaging system, LiCor Odyssey system to analyze our immunoblots. With this system, our secondary antibodies against primary antibodies derived from different species are tagged with different fluorescence colors. Quantitation was performed for each band, and results plotted as change compared to control (week 0) for each post-ibrutinib sample (weeks 2, 4, or 12) and plotted for MCL-1 (E), BCL-XL (F), and BCL-2 (G). P values are from paired t-tests comparing pre- and post-ibrutinib levels of the proteins in samples from all patients. H–J, Real time RT-PCR analysis of MCL-1 (H), BCL-XL(I), and BCL-2 (J) mRNA levels in untreated lymphocytes isolated from patients before (week 0) and after ibrutinib (weeks 2, 4, and 12) initiation. mRNA levels are expressed as fold change over week 0 (pretreatment) for each sample. Eukaryotic 18S ribosomal RNA was used as an internal control.

References

    1. Zenz T, Mertens D, Kuppers R, Dohner H, Stilgenbauer S. From pathogenesis to treatment of chronic lymphocytic leukaemia. Nature reviews Cancer. 2010;10:37–50. - PubMed
    1. Chiorazzi N, Rai KR, Ferrarini M. Chronic lymphocytic leukemia. The New England journal of medicine. 2005;352:804–15. - PubMed
    1. Burger JA, Quiroga MP, Hartmann E, Burkle A, Wierda WG, Keating MJ, et al. High-level expression of the T-cell chemokines CCL3 and CCL4 by chronic lymphocytic leukemia B cells in nurselike cell cocultures and after BCR stimulation. Blood. 2009;113:3050–8. - PMC - PubMed
    1. Herishanu Y, Perez-Galan P, Liu D, Biancotto A, Pittaluga S, Vire B, et al. The lymph node microenvironment promotes B-cell receptor signaling, NF-kappaB activation, and tumor proliferation in chronic lymphocytic leukemia. Blood. 2011;117:563–74. - PMC - PubMed
    1. Tam CS, O’Brien S, Wierda W, Kantarjian H, Wen S, Do KA, et al. Long-term results of the fludarabine, cyclophosphamide, and rituximab regimen as initial therapy of chronic lymphocytic leukemia. Blood. 2008;112:975–80. - PMC - PubMed

Publication types

MeSH terms

Substances