. 2015 Jun;5(6):652-67.
doi: 10.1158/2159-8290.CD-14-1507. Epub 2015 Mar 31.

HIF2α-Dependent Lipid Storage Promotes Endoplasmic Reticulum Homeostasis in Clear-Cell Renal Cell Carcinoma

Affiliations

HIF2α-Dependent Lipid Storage Promotes Endoplasmic Reticulum Homeostasis in Clear-Cell Renal Cell Carcinoma

Bo Qiu et al. Cancer Discov. 2015 Jun.

Abstract

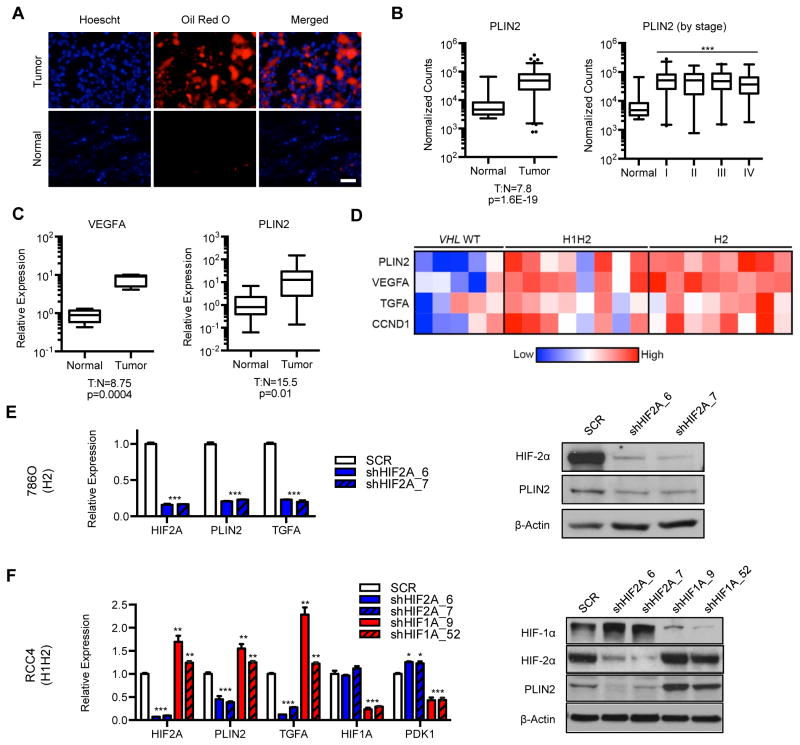
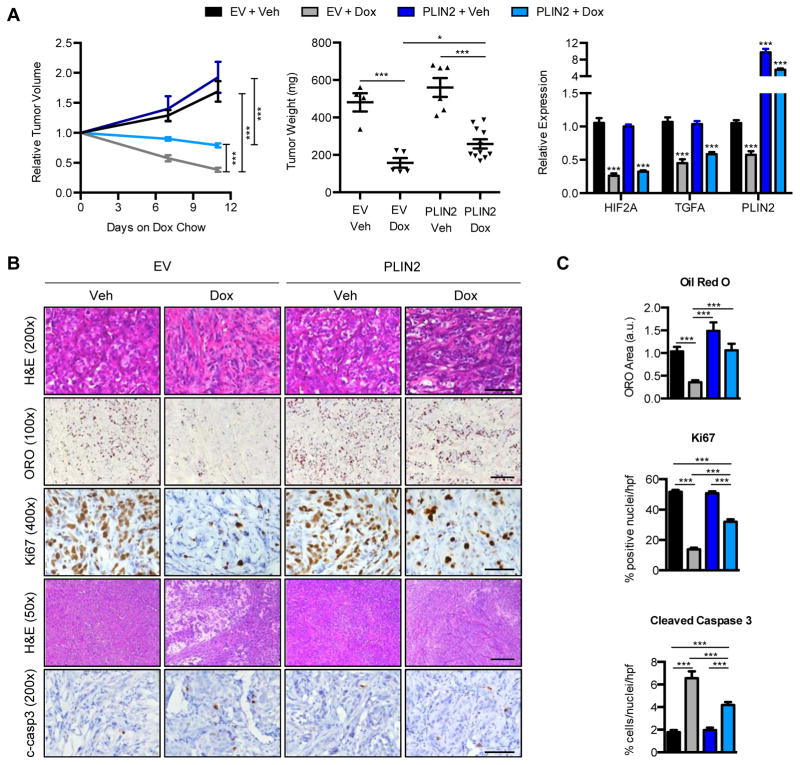
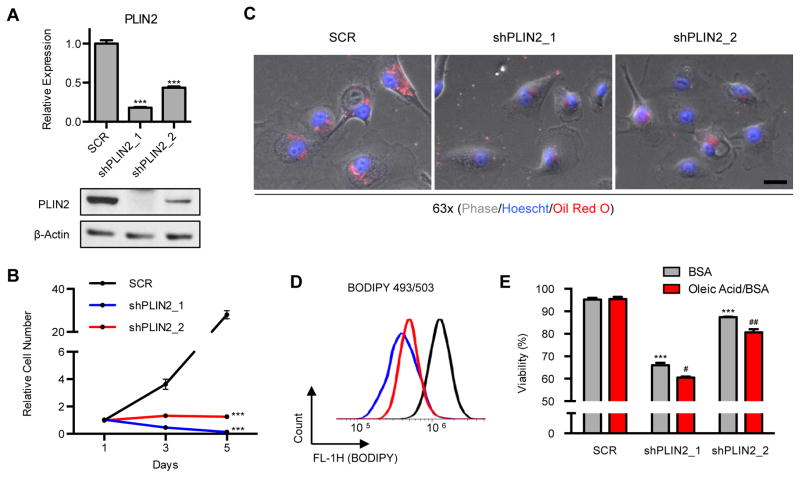
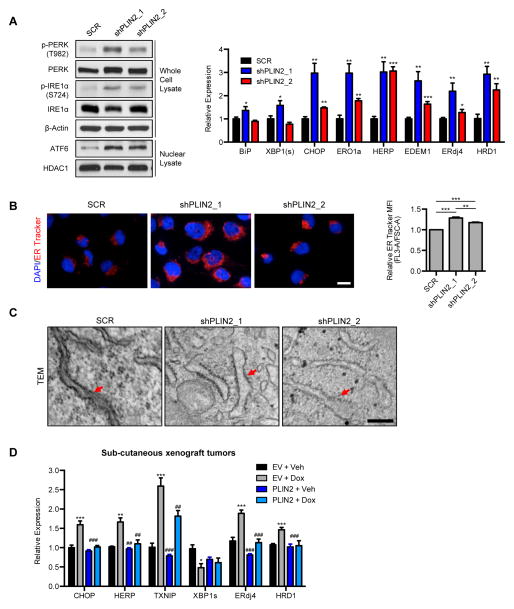
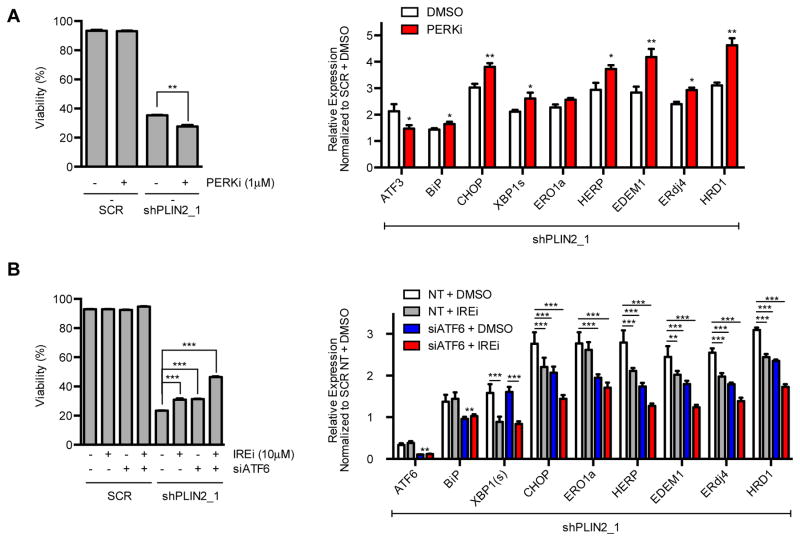
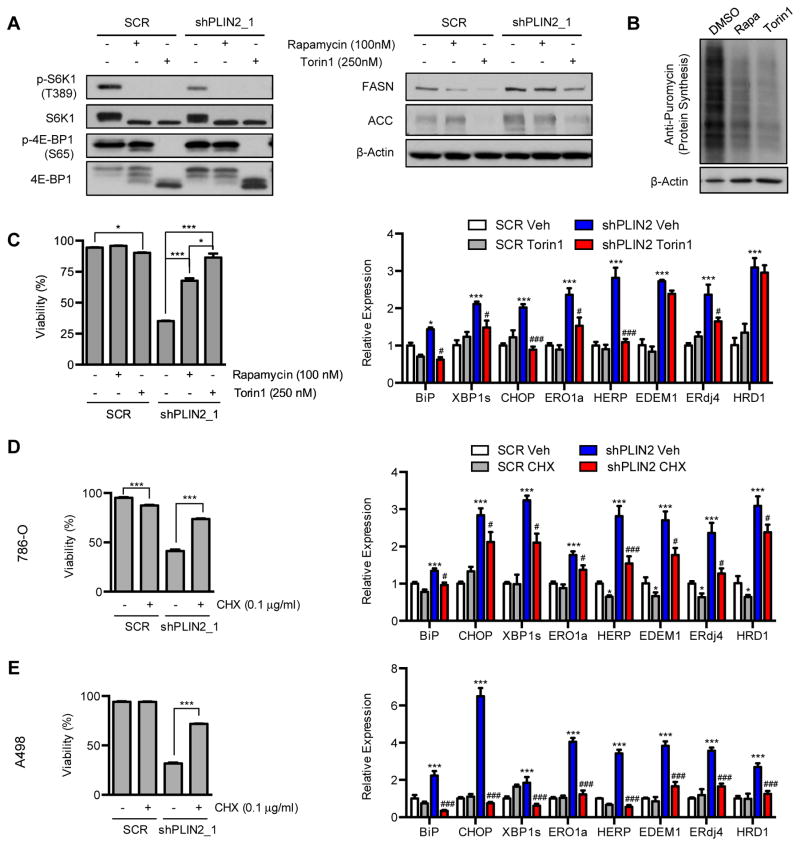
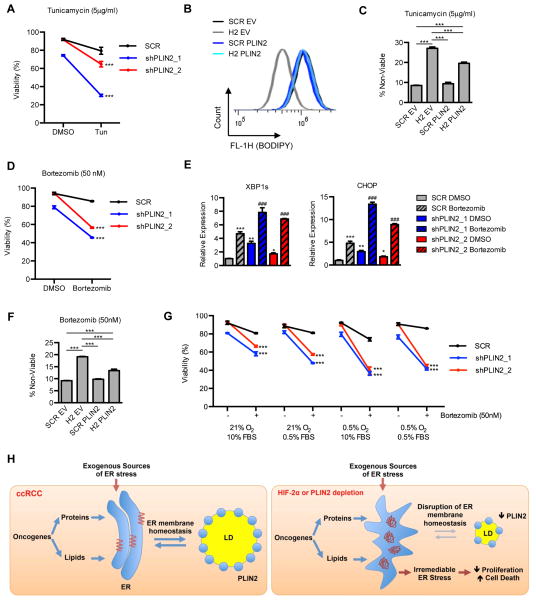
Two hallmarks of clear-cell renal cell carcinoma (ccRCC) are constitutive hypoxia-inducible factor (HIF) signaling and abundant intracellular lipid droplets (LD). However, regulation of lipid storage and its role in ccRCC are incompletely understood. Transcriptional profiling of primary ccRCC samples revealed that expression of the LD coat protein gene PLIN2 was elevated in tumors and correlated with HIF2α, but not HIF1α, activation. HIF2α-dependent PLIN2 expression promoted lipid storage, proliferation, and viability in xenograft tumors. Mechanistically, lipid storage maintained integrity of the endoplasmic reticulum (ER), which is functionally and physically associated with LDs. Specifically, PLIN2-dependent lipid storage suppressed cytotoxic ER stress responses that otherwise result from elevated protein synthetic activity characteristic of ccRCC cells. Thus, in addition to promoting ccRCC proliferation and anabolic metabolism, HIF2α modulates lipid storage to sustain ER homeostasis, particularly under conditions of nutrient and oxygen limitation, thereby promoting tumor cell survival.

Significance: We demonstrate that HIF2α promotes lipid storage, ER homeostasis, and cell viability in ccRCC via upregulation of the LD coat protein PLIN2, revealing a novel function for the well-documented "clear-cell" phenotype and identifying ER stress as a targetable vulnerability created by HIF2α/PLIN2 suppression in this common renal malignancy.


Conflict of interest statement

Conflicts of Interest: The authors have no conflicts of interest to report.

Figures

Figure 1
Figure 1. HIF-2α promotes expression of the lipid droplet coat protein PLIN2 in ccRCC
A) Oil red O staining of matched primary ccRCC and normal kidney samples. Scale bar = 50 μm. B) Normalized RNA-seq reads of PLIN2 in ccRCC (n=480) and normal kidney (n=69) samples. Tumors were also analyzed for PLIN2 expression according to tumor stage. RNA-seq data was obtained from The Cancer Genome Atlas (TCGA), and p-values determined by DEseq. Whiskers denote the 1st and 99th percentiles. C) Quantitative RT-PCR (qRT-PCR) analysis of VEGFA and PLIN2 in matched ccRCC (n=10) and normal kidney (n=10) samples obtained from the Cooperative Human Tissue Network (CHTN). Whiskers denote the 1st and 99th percentiles. D) Microarray analysis of primary ccRCC samples that have been previously classified by VHL genotyping and HIF-α immunohistochemical staining to reveal 3 sub-types: VHL WT (no HIF-1α or HIF-2α staining and confirmed WT sequence at VHL locus, n=5), H1H2 (HIF-1α and HIF-2α staining, n=8), and H2 (HIF-2α staining only, n=8). Expression of PLIN2 and multiple known HIF-2α target genes in ccRCC are shown. PLIN2 mRNA was elevated in both H1H2 (9.7 fold overexpression, p=2.6E-4) and H2 (16.7 fold overexpression, p=2.5E-6) tumors compared to VHL WT samples. p-values determined by ANOVA. E) 786-O (H2) ccRCC cells were transduced with two independent shRNAs against HIF2A (shHIF2A_6 and 7) or a SCR control. qRT-PCR and western blot analysis of PLIN2 are shown. TGFA is included as a positive control for HIF-2α suppression. F) RCC4 (H1H2) ccRCC cells were transduced with two independent shRNAs against HIF-1α (shHIF1A_9 and 52), HIF-2α (shHIF2A_6 and 7), or a SCR control. qRT-PCR and western blot for PLIN2 is shown. TGFA and PDK1 are included as positive controls for HIF-2α and HIF-1α suppression, respectively. Data are representative of three independent experiments. Unless otherwise noted, p-values were determined by student’s t-test. * p<0.05, ** p<0.01, *** p<0.001. For qRT-PCR, TBP and ACTB were utilized as endogenous control genes and relative mRNA expression was determined by normalizing to expression in SCR samples. Error bars denote standard error of the mean (SEM).
Figure 2
Figure 2. HIF-2α dependent PLIN2 expression and lipid storage promotes xenograft tumor growth
A) Sub-cutaneous tumors of 786-O cells expressing Dox-inducible shHIF2A_7, along with either empty vector or exogenous PLIN2, were generated in NIH-III nude mice. Once tumor volume reached 300mm3, a cohort received Dox-chow (625 mg/kg). Relative tumor volume was monitored until 11 days of Dox treatment (left). Tumor weights at harvest were determined (center), and qRT-PCR analysis for HIF-2α, TGFA, and PLIN2 was performed (right). EV Veh, n=4; EV Dox, n=5; PLIN2 Veh n=6; PLIN2 Dox, n=9. For qRT-PCR, TBP and ACTB were utilized as endogenous control genes and relative mRNA expression was determined by normalizing to expression in EV Veh samples. B) Histological analysis of tumors is shown. The indicated stains were performed on sections obtained from tumors described in (A). Scale bars: 50x=400μm, 100x=200μm, 200x=100μm, 400x=50μm. C) Oil red O area per field was determined using Image J. Percentage of cells per field that exhibited nuclear Ki67 or cleaved caspase 3 expression is shown. For each graph, 30 fields per tumor type were quantified. p-values were determined by two-way ANOVA with Bonferroni correction. * p<0.05, ** p<0.01, *** p<0.001. Error bars denote SEM.
Figure 3
Figure 3. PLIN2 is required for lipid storage and cell viability
A) 786-O ccRCC cells were transduced with two independent shRNAs against PLIN2 (shPLIN2_1, shPLIN2_2) or a SCR control. qRT-PCR and western blot analysis were performed on day 3 post shRNA transduction to assess for PLIN2 suppression. For qRT-PCR, TBP and ACTB were utilized as endogenous control genes and relative mRNA expression was determined by normalizing to expression in SCR samples. p-values were determined by student’s t-test. *** p<0.001. B) Growth curves for cells described in (A). Day 1 of growth curve corresponds to day 3 post transduction. C) Oil Red O staining of cells described in (A) was performed on day 3 post transduction. Scale bar = 50μm. D) Live cells described in (A) were stained with BODIPY 493/503 (2μg/ml) and fluorescence was measured by flow cytometry. A histogram of BODIPY 493/503 fluorescence is shown. E) Beginning on day 3 post transduction, cells from (A) were treated with BSA alone or BSA conjugated with oleic acid (30μM). Viability was determined by annexin/PI staining after 24 hours of treatment. Data are representative of three independent experiments. p-values were determined by two-way ANOVA with Bonferroni correction. Asterisks denote comparison with SCR BSA. *** p<0.001. Pound signs denote comparison of Oleic Acid with BSA treated conditions within each cell line. # p<0.05, ## p<0.01. Error bars denote SEM.
Figure 4
Figure 4. PLIN2 dependent lipid storage promotes ER homeostasis in ccRCC
A) Western blot for UPR sensors was performed in 786-O cells expressing independent shRNAs against PLIN2 (shPLIN2_1, shPLIN2_2) or a SCR control (left, day 3 post transduction). Corresponding qRT-PCR analysis of UPR target genes is shown (right, day 4 post transduction). Data are representative of three independent experiments. p-values were determined by student’s t-test. B) ER Tracker Red (500 nM) staining of live cells described in (A) was performed (day 4 post transduction). Representative images (left) and quantification of ER Tracker fluorescence are shown (right). Fluorescence was normalized to forward scatter for each event to account for differences in cell size. Scale bar = 50μm. p-values were determined by student’s t-test. C) Transmission electron microscopy of control and PLIN2 depleted cells is shown (day 4 post transduction). Red arrows denote rough ER. Scale bar=200 nm. D) qRT-PCR of xenograft tumor RNA assessing expression of UPR target genes. p-values were determined by two-way ANOVA with Bonferroni correction. Asterisks denote comparison with EV Veh. * p<0.05, ** p<0.01, *** p<0.001. Pound signs denote comparison with EV Dox. ## p<0.01, ### p<0.001. Error bars denote SEM.
Figure 5
Figure 5. Unfolded protein response promotes cell death upon PLIN2 depletion
A) 786-O cells expressing shPLIN2_1 or SCR control were treated with PERK inhibitor (1μM) or DMSO vehicle beginning on day 3 post transduction. Cell viability was determined by annexin/PI staining after 48 hours of drug treatment and qRT-PCR analysis of UPR target gene expression was performed after 24 hours of drug treatment. For qRT-PCR, TBP and ACTB were utilized as endogenous control genes and relative mRNA expression was determined by normalizing to expression in SCR samples. Data are representative of three independent experiments. p-values were determined by student’s t-test. * p<0.05, ** p<0.01, *** p<0.001. B) 786-O cells expressing shPLIN2_1 or SCR shRNA were transfected with non-targeting (NT) or ATF6 directed siRNA (day 2 post transduction) and subsequently treated with IRE-1α inhibitor (10μM) or DMSO vehicle (day 3 post transduction). Cell viability was determined by annexin/PI staining after 48 hours of drug treatment (left) and qRT-PCR analysis of UPR target gene expression was performed after 24 hours of drug treatment (right). Data are representative of three independent experiments. p-values were determined by two-way ANOVA with Bonferroni correction. ** p<0.01, *** p<0.001. Error bars denote SEM.
Figure 6
Figure 6. Suppression of protein synthesis ameliorates ER stress and cell death upon PLIN2 depletion
A) 786-O cells expressing shPLIN2_1 or SCR control were treated with rapamycin (100 nM) or Torin1 (250 nM) for 48 hours. Western blot analysis of direct targets of mTORC1 kinase (left) and mTORC1 regulated fatty acid synthesis enzymes (right) are shown. B) Protein synthesis activity was measured in 786-O cells treated with rapamycin, Torin1, or DMSO vehicle for 48 hours. Cells were pulsed with puromycin (30 min, 10μg/ml) and chased in puromycin free media (1 hr) to allow puromycin incorporation into nascent peptides. Whole cell lysates were subjected to western blot analysis using an anti-puromycin antibody (clone 12D10). C) 786-O cells expressing shPLIN2_1 or SCR control were treated with rapamycin, Torin1, or DMSO vehicle starting on day 3 post transduction and cell viability was determined by annexin/PI staining after 48 hours of drug treatment (left). qRT-PCR comparing UPR target gene expression in cells treated with Torin1 was performed after 24 hours of drug treatment. D) 786-O cells expressing shPLIN2_1 or SCR shRNA were treated with cycloheximide or DMSO vehicle starting on day 3 post transduction and cell viability was determined by annexin/PI staining after 48 hours of drug treatment (left). qRT-PCR for UPR target genes was performed after 24 hours of drug treatment (right). E) A498 cells were treated and analyzed as described in (D). Data are representative of three independent experiments. p-values were determined by student’s t-test for annexin/PI assays and two-way ANOVA with Bonferroni correction for qRT-PCR. For qRT-PCR, TBP and ACTB were utilized as endogenous control genes and relative mRNA expression was determined by normalizing to expression in SCR Veh samples. Asterisks denote statistical comparison with SCR Veh. * p<0.05, *** p<0.001. Pound signs denote statistical comparison with shPLIN2 Veh. # p<0.05, ### p<0.001. Error bars denote SEM.
Figure 7
Figure 7. HIF-2α/PLIN2 dependent lipid storage protects ccRCC cells against pharmacological ER stress
A) A498 cells expressing shPLIN2_1, shPLIN2_2, or SCR control were treated with tunicamycin or DMSO at 2 days post transduction. Cell viability was determined by annexin/PI staining after 48 hours of drug treatment. Asterisks denote statistical comparison of viability under tunicamycin treatment. Tunicamycin-induced reduction in viability was significantly different between shPLIN2 and SCR cells: shPLIN2_1 vs SCR, p<0.01; shPLIN2_2 vs SCR, p<0.01. B) A498 cells expressing shHIF2A_7 or SCR control, along with either exogenous PLIN2 or an empty vector (EV), were stained with BODIPY 493/503 (2μg/ml). Histograms indicating BODIPY fluorescence was generated by flow cytometry. C) Cells described in (B) were treated with tunicamycin or DMSO control for 48 hours and viability was determined by annexin/PI staining. D) A498 cells expressing shPLIN2_1, shPLIN2_2, or SCR control were treated with Bortezomib or DMSO at 3 days post transduction. Cell viability was determined by annexin/PI staining after 24 hours of drug treatment. Asterisks denote statistical comparison of viability under Bortezomib treatment. Bortezomib-induced reduction in viability was significantly different between shPLIN2 and SCR cells: shPLIN2_1 vs SCR, p<0.001 shPLIN2_2 vs SCR, p<0.001 E) XBP1s and CHOP expression in cells from (D) was determined by qRT-PCR. Asterisks denote comparison with SCR DMSO. Pound signs denote comparison with SCR Bortezomib. For qRT-PCR, TBP and ACTB were utilized as endogenous control genes and relative mRNA expression was determined by normalizing to expression in SCR DMSO samples. F) Cells described in (B) were treated with Bortezomib or DMSO control for 24 hours and viability was determined by annexin/PI staining. G) A498 cells expressing shPLIN2_1, shPLIN2_2, or SCR control were treated with Bortezomib or DMSO at 3 days post transduction and incubated under the designated serum and oxygen conditions. Cell viability was determined by annexin/PI staining after 24 hours of drug treatment. Astericks denote comparison with SCR Bortezomib. Under each serum and oxygen condition, Bortezomib-induced reduction in viability was significantly different between shPLIN2 and SCR cells: shPLIN2_1 vs SCR, p<0.001 shPLIN2_2 vs SCR, p<0.001 H) Proposed model illustrating the protective function of HIF-2α dependent PLIN2 expression and lipid storage against ER stress in ccRCC cells. Data are representative of three independent experiments. p-values were determined by two-way ANOVA with Bonferroni correction. * p<0.05, ** p<0.01, *** p<0.001. ### p<0.001. Error bars denote SEM.

Comment in

References

    1. Shen C, Kaelin WG., Jr The VHL/HIF axis in clear cell renal carcinoma. Seminars in cancer biology. 2013;23:18–25. - PMC - PubMed
    1. Keith B, Johnson RS, Simon MC. HIF1alpha and HIF2alpha: sibling rivalry in hypoxic tumour growth and progression. Nature reviews Cancer. 2012;12:9–22. - PMC - PubMed
    1. Shen C, Beroukhim R, Schumacher SE, Zhou J, Chang M, Signoretti S, et al. Genetic and functional studies implicate HIF1alpha as a 14q kidney cancer suppressor gene. Cancer discovery. 2011;1:222–35. - PMC - PubMed
    1. Gordan JD, Lal P, Dondeti VR, Letrero R, Parekh KN, Oquendo CE, et al. HIF-alpha effects on c-Myc distinguish two subtypes of sporadic VHL-deficient clear cell renal carcinoma. Cancer cell. 2008;14:435–46. - PMC - PubMed
    1. Purdue MP, Johansson M, Zelenika D, Toro JR, Scelo G, Moore LE, et al. Genome-wide association study of renal cell carcinoma identifies two susceptibility loci on 2p21 and 11q13.3. Nature genetics. 2011;43:60–5. - PMC - PubMed

Publication types

MeSH terms

Substances