. 2015 Mar 31;112(13):4056-61.
doi: 10.1073/pnas.1418549112. Epub 2015 Mar 17.

T-bet- and STAT4-dependent IL-33 receptor expression directly promotes antiviral Th1 cell responses

Affiliations

T-bet- and STAT4-dependent IL-33 receptor expression directly promotes antiviral Th1 cell responses

Claudia Baumann et al. Proc Natl Acad Sci U S A. .

Abstract

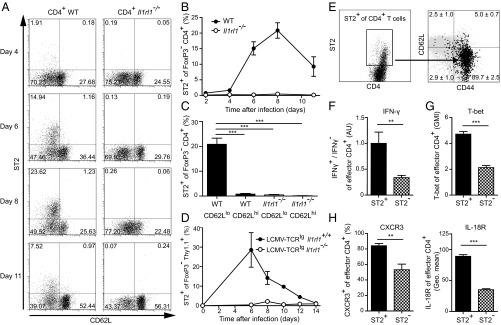
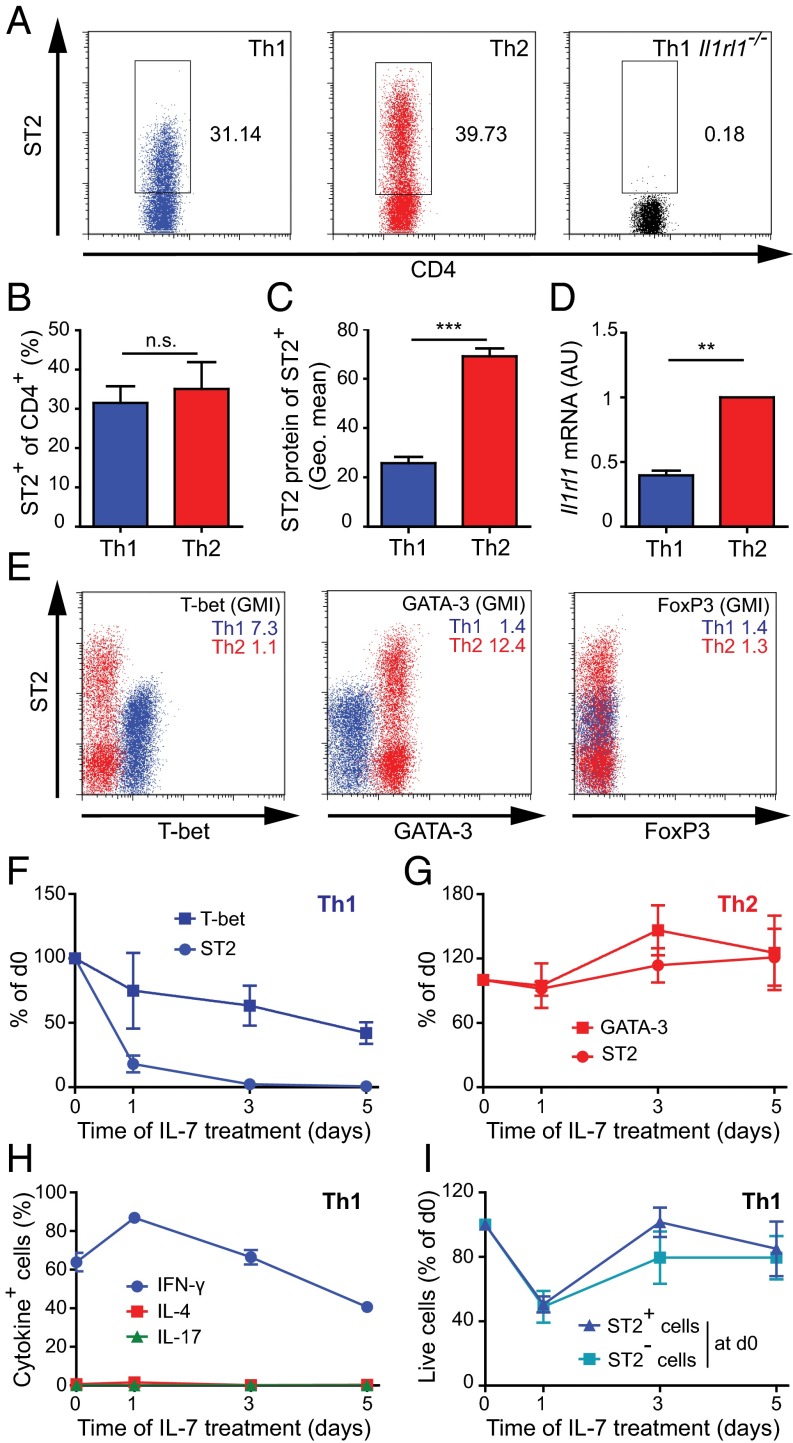
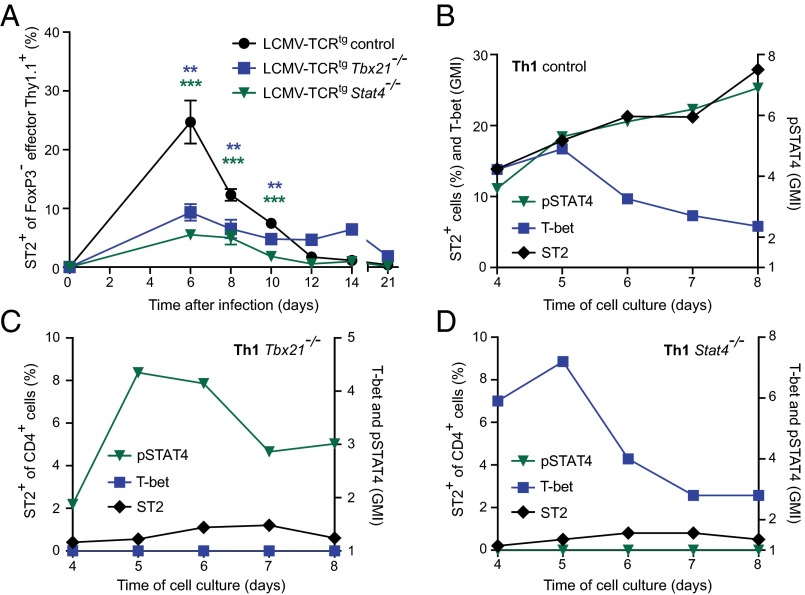
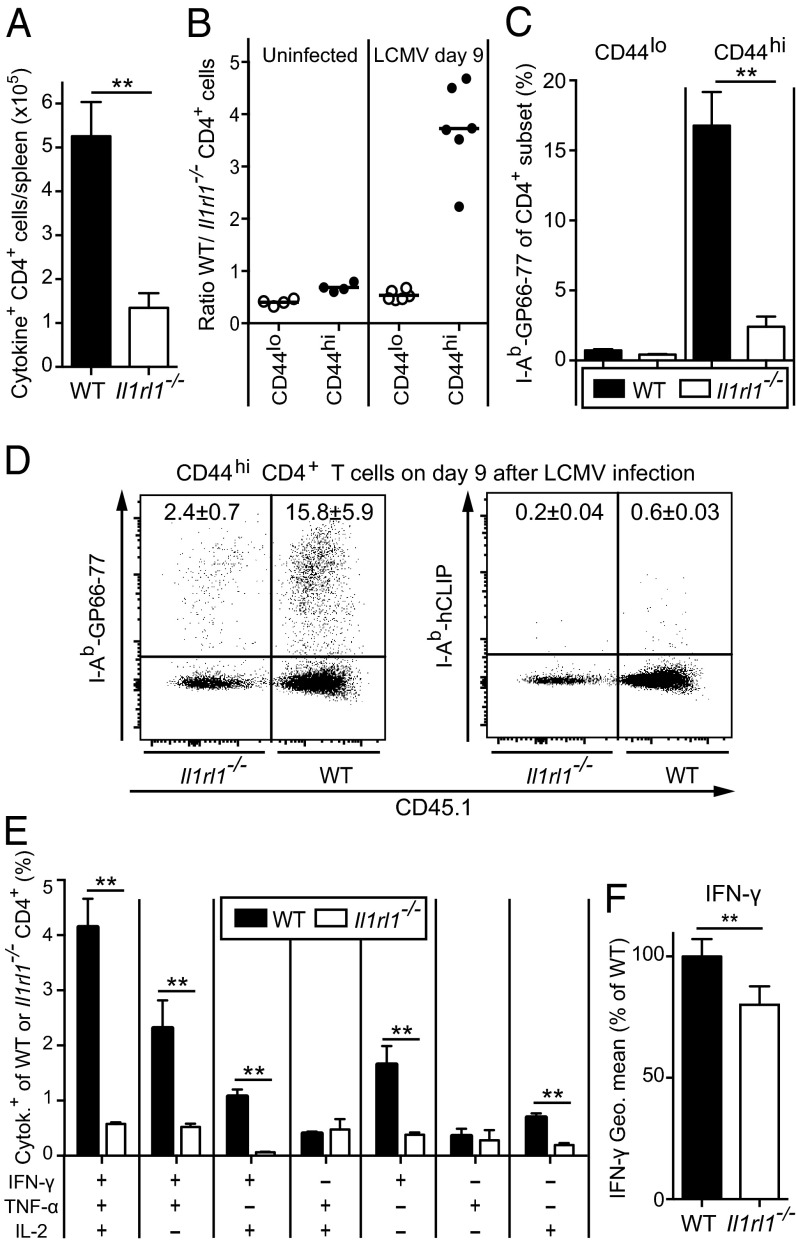
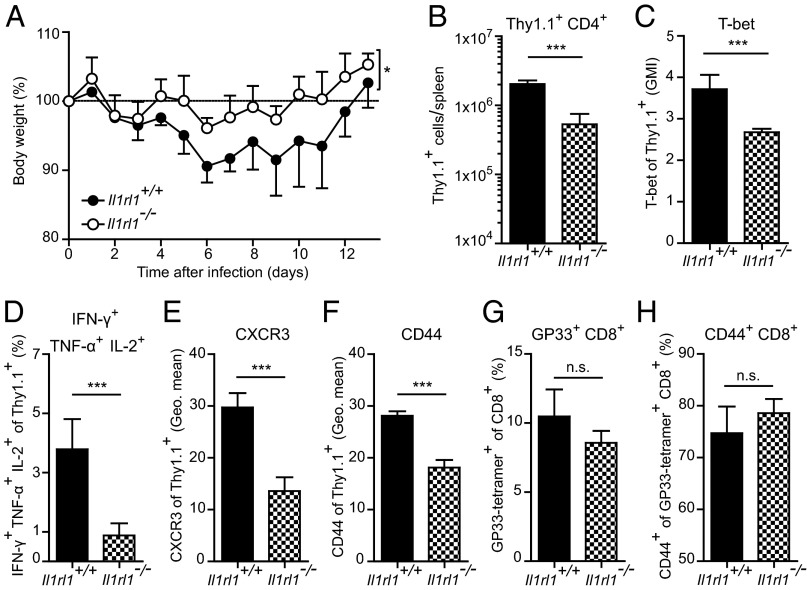
During infection, the release of damage-associated molecular patterns, so-called "alarmins," orchestrates the immune response. The alarmin IL-33 plays a role in a wide range of pathologies. Upon release, IL-33 signals through its receptor ST2, which reportedly is expressed only on CD4(+) T cells of the Th2 and regulatory subsets. Here we show that Th1 effector cells also express ST2 upon differentiation in vitro and in vivo during lymphocytic choriomeningitis virus (LCMV) infection. The expression of ST2 on Th1 cells was transient, in contrast to constitutive ST2 expression on Th2 cells, and marked highly activated effector cells. ST2 expression on virus-specific Th1 cells depended on the Th1-associated transcription factors T-bet and STAT4. ST2 deficiency resulted in a T-cell-intrinsic impairment of LCMV-specific Th1 effector responses in both mixed bone marrow-chimeric mice and adoptive cell transfer experiments. ST2-deficient virus-specific CD4(+) T cells showed impaired expansion, Th1 effector differentiation, and antiviral cytokine production. Consequently, these cells mediated little virus-induced immunopathology. Thus, IL-33 acts as a critical and direct cofactor to drive antiviral Th1 effector cell activation, with implications for vaccination strategies and immunotherapeutic approaches.

Keywords: CD4 T cell; IL-33; ST2; Th1 cell; virus infection.


Conflict of interest statement

The authors declare no conflict of interest.

Figures

Fig. 1.
Fig. 1.
Transient ST2 expression on virus-specific CD4+ T cells is associated with enhanced Th1 effector properties. (A–C) Kinetic flow cytometry analysis of ST2 expression of FoxP3 CD4+ T cells in peripheral blood during LCMV infection (2 × 10⁶ PFU). (A) Analysis of one representative mouse per time point (n = 3). (B) Symbols represent mean ± SD values (n = 3). (C) Frequencies of ST2-expressing FoxP3 CD4+ T cells at day 8 postinfection. Bars represent mean + SD (n = 3). (D) Il1rl1+/+ and Il1rl1−/− naive LCMV-TCRtg CD4+ Thy1.1+ T cells were transferred into WT recipients, followed by LCMV infection (200 PFU). Shown are the results of kinetic analysis of ST2 expression of FoxP3 CD4+ Thy1.1+ cells in peripheral blood. Symbols represent mean ± SD values (n = 3–5). (E) ST2 expression of splenic total CD4+ T cells at day 8 postinfection. ST2+ CD4+ T cells are shown in black with average ± SD frequencies; the expression pattern of total CD4+ T cells is shown in gray. Data are from one representative mouse (n = 3). (F–H) Comparison of splenic ST2+ and ST2 effector CD4+ T cells analyzed by flow cytometry at day 8 postinfection. Effector CD4+ T cells were defined by CD62Llo or CD44+ expression. (F) Expression levels of IFN-γ after GP64 peptide restimulation. The ratio of IFN-γ+ to IFN-γ of ST2+ or ST2 CD44+ CD4+ T cells was calculated, and the average value of the ST2+ fraction was set to an arbitrary unit of 1. (G) Geometric mean index (GMI) of T-bet protein. (H) Expression of CXCR3 and IL-18R. Bars represent mean + SD (n = 3). All data are representative of two or three independent experiments.
Fig. 2.
Fig. 2.
ST2 expression is weaker and less stable on Th1 cells than on Th2 cells. (A–E) Naive LCMV-TCRtg CD4+ T cells were differentiated to Th1 and Th2 cells for 8 d. (A) Representative dot plots of ST2 expression on Th1 and Th2 cells. Il1rl1−/− Th1 cells served as staining controls. (B–D) Mean + SD of two or three independent cultures for flow cytometry analysis of ST2 frequency (B), geometric mean of ST2 protein within ST2+ cells (C), and quantitation of Il1rl1 mRNA (D). (E) Flow cytometry analysis of ST2 and T-bet, GATA-3, and FoxP3. Th1 cells are shown in blue; Th2 cells, in red. The GMI of the respective protein is displayed in the upper right corner of the plot. (F–I) Naive LCMV-TCRtg CD4+ T cells were differentiated to Th1 and Th2 cells for 8 d and placed into resting condition in fresh medium with IL-7 for another 5 d. Analysis gates were set on living cells. The frequency of ST2-expressing cells and the GMI of T-bet and GATA-3 protein are shown for Th1 cells (F) and Th2 cells (G) normalized as percentage of d0. (H) Frequencies of Th1 cells expressing IFN-γ, IL-4, and IL-17 after restimulation with PMA and ionomycin. (I) ST2+ and ST2 Th1 cells were sorted on day 8 and plated separately under resting conditions with IL-7. Total numbers of living cells were assessed over time. Symbols represent the mean ± SD of two or three pooled, independent experiments.
Fig. 3.
Fig. 3.
T-bet and STAT4 regulate ST2 expression on Th1 cells in vivo and in vitro. (A) Plain control, Tbx21−/−, and Stat4−/− naive LCMV-TCRtg CD4+ Thy1.1+ cells were transferred into WT recipients and infected with LCMV (200 PFU). Shown is a time course analysis of ST2 expression on circulating effector FoxP3 CD4+ Thy1.1+ cells, effector T cells as defined by CD62Llo or CD44+ expression. Symbols represent mean ± SEM values of two pooled, independent experiments (n = 3–8). (B–D) Naive control (B), Tbx21−/− (C), and Stat4−/− (D) LCMV-TCRtg CD4+ T cells were differentiated to Th1 cells for 4 d and then kinetically analyzed by flow cytometry for pSTAT4 (triangle), T-bet (square), and ST2 (diamond) expression until day 8 of culture. Representative data from one of three experiments are shown.
Fig. 4.
Fig. 4.
ST2 cell-intrinsically enhances the expansion of polyfunctional antiviral CD4+ T cells. (A) WT and Il1rl1−/− mice were infected with LCMV. On day 9, we enumerated GP64-specific splenic CD4+ T cells expressing IFN-γ, TNF-α, IL-2, and combinations thereof. (B–F) Irradiated WT recipients were reconstituted with WT (CD45.1+) and Il1rl1−/− (CD45.2+) bone marrow and subjected to flow cytometry analysis either before LCMV infection (B, Left) or 9 d after LCMV infection (B, Right and C–F). (B) Ratio of WT and Il1rl1−/− CD4+ T cells, either CD44lo or CD44hi. Symbols represent individual mice. (C) Frequencies of I-Ab GP66-77 tetramer-binding CD44lo or CD44hi CD4+ T cells in the WT and Il1rl1−/− compartments. (D) Representative FACS plots of specific I-Ab GP66-77 tetramer binding compared with irrelevant hCLIP-loaded I-Ab tetramer. Values indicate the percentage (mean ± SD) of tetramer binding within the WT and Il1rl1−/− CD4+CD44hi compartments. (E) Frequencies of WT and Il1rl1−/− CD4+ T cells expressing IFN-γ, TNF-α, IL-2, or combinations thereof after GP64 peptide restimulation. (F) IFN-γ geometric mean of IFN-γ–producing WT and Il1rl1−/− CD4+ T cells. Bars represent mean + SEM values of four mice (A) or six mice (B–F). A, E, and F show representative results from two independent experiments. The paired Student t test was used in F.
Fig. 5.
Fig. 5.
Adoptively transferred ST2-deficient CD4+ T cells cause less virus-induced immunopathology. Naive Il1rl1+/+ and Il1rl1−/− LCMV-TCRtg CD4+ Thy1.1+ cells were transferred into WT recipients, which were subsequently infected with LCMV (200 PFU). (A) Body weight was monitored daily; symbols represent mean ± SD (n = 4). Differences in body weight between Il1rl1+/+ and Il1rl1−/− CD4+ Thy1.1+ cell recipients were analyzed by two-way ANOVA for the entire time course. (B–F) Analysis of splenic transferred Il1rl1+/+ and Il1rl1−/− CD4+ Thy1.1+ cells at day 6 postinfection. Shown are total CD4+ Thy1.1+ cell numbers (B), T-bet GMI (C), IFN-γ+ TNF-α+ IL-2+ frequencies after GP64 peptide restimulation (D), and geometric means of CXCR3 (E) and CD44 (F). (G and H) Frequencies of splenic, endogenous GP33-tretramer+ CD8+ T cells (G) and CD44+ GP33-tetramer+ CD8+ T cells (H). Bars represent mean + SD (n = 4). All data are representative of two independent experiments.

References

    1. Oppenheim JJ, Yang D. Alarmins: Chemotactic activators of immune responses. Curr Opin Immunol. 2005;17(4):359–365. - PubMed
    1. Palmer G, Gabay C. Interleukin-33 biology with potential insights into human diseases. Nat Rev Rheumatol. 2011;7(6):321–329. - PubMed
    1. Schmitz J, et al. IL-33, an interleukin-1–like cytokine that signals via the IL-1 receptor-related protein ST2 and induces T helper type 2-associated cytokines. Immunity. 2005;23(5):479–490. - PubMed
    1. Ali S, et al. IL-1 receptor accessory protein is essential for IL-33–induced activation of T lymphocytes and mast cells. Proc Natl Acad Sci USA. 2007;104(47):18660–18665. - PMC - PubMed
    1. Garlanda C, Dinarello CA, Mantovani A. The interleukin-1 family: Back to the future. Immunity. 2013;39(6):1003–1018. - PMC - PubMed

Publication types

MeSH terms

LinkOut - more resources