Comparison of acute physiology and chronic health evaluation II and Glasgow Coma Score in predicting the outcomes of Post Anesthesia Care Unit's patients
- PMID: 25829900
- PMCID: PMC4374217
- DOI: 10.4103/1658-354X.152839
Comparison of acute physiology and chronic health evaluation II and Glasgow Coma Score in predicting the outcomes of Post Anesthesia Care Unit's patients
Abstract
Context: Acute physiology and chronic health evaluation II (APACHE II) is one of the most general classification systems of disease severity in Intensive Care Units and Glasgow Coma Score (GCS) is one of the most specific ones.
Aims: The aim of the current study was to assess APACHE II and GCS ability in predicting the outcomes (survivors, non-survivors) in the Post Anesthesia Care Unit's (PACU).
Settings and design: This was an observational and prospective study of 150 consecutive patients admitted in the PACU during 6-month period.
Materials and methods: Demographic information recorded on a checklist, also information about severity of disease calculated based on APACHE II scoring system in the first admission 24 h and GCS scale.
Statistical analysis used: Logistic regression, Hosmer-Lemeshow test and receiver operator characteristic (ROC) curves were used in statistical analysis (95% confidence interval).
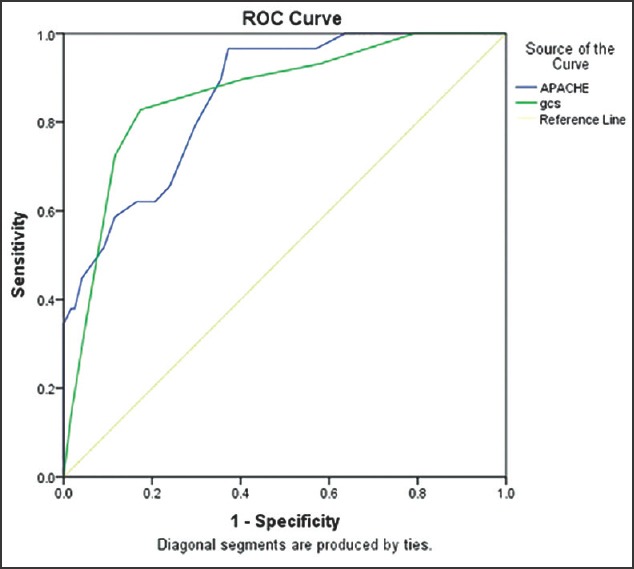
Results: Data analysis showed a significant statistical difference between outcomes and both APACHE II and Glasgow Coma Score (GCS) (P < 0.0001). The ROC-curve analysis suggested that the predictive ability of GCS is slightly better than APACHE II in this study. For GCS the area under the ROC curve was 86.1% (standard error [SE]: 3.8%), and for APACHE II it was 85.7% (SE: 3.5%), also the Hosmer-Lemeshow statistic revealed better calibration for GCS (χ(2) = 5.177, P = 0.521), than APACHE II (χ(2) = 10.203, P = 0.251).
Conclusions: The survivors had significantly lower APACHE II and higher GCS compared with non-survivors, also GCS showed more predictive accuracy than APACHE II in prognosticating the outcomes in PACU.
Keywords: Acute physiology and chronic health evaluation II; Glasgow Coma Score; Post Anesthesia Care Unit.
Conflict of interest statement
Figures
Similar articles
-
Evaluation of Acute Physiology and Chronic Health Evaluation II and sequential organ failure assessment scoring systems for prognostication of outcomes among Intensive Care Unit's patients.Saudi J Anaesth. 2016 Apr-Jun;10(2):168-73. doi: 10.4103/1658-354X.168817. Saudi J Anaesth. 2016. PMID: 27051367 Free PMC article.
-
Comparison of full outline of unresponsiveness score and Glasgow Coma Scale in Medical Intensive Care Unit.Ann Card Anaesth. 2019 Apr-Jun;22(2):143-148. doi: 10.4103/aca.ACA_25_18. Ann Card Anaesth. 2019. PMID: 30971594 Free PMC article.
-
Comparison of the APACHE III, APACHE II and Glasgow Coma Scale in acute head injury for prediction of mortality and functional outcome.Intensive Care Med. 1997 Jan;23(1):77-84. doi: 10.1007/s001340050294. Intensive Care Med. 1997. PMID: 9037644
-
Should the pre-sedation Glasgow Coma Scale value be used when calculating Acute Physiology and Chronic Health Evaluation scores for sedated patients? Scottish Intensive Care Society Audit Group.Crit Care Med. 2000 Feb;28(2):389-94. doi: 10.1097/00003246-200002000-00017. Crit Care Med. 2000. PMID: 10708172 Clinical Trial.
-
Severity scores in respiratory intensive care: APACHE II predicted mortality better than SAPS II.Respir Care. 1995 Oct;40(10):1042-7. Respir Care. 1995. PMID: 10152703 Review.
Cited by
-
Prediction of Mortality in the Medical Intensive Care Unit with Serial Full Outline of Unresponsiveness Score in Elderly Patients.Indian J Crit Care Med. 2022 Jan;26(1):94-99. doi: 10.5005/jp-journals-10071-24094. Indian J Crit Care Med. 2022. PMID: 35110851 Free PMC article.
-
Dynamic APACHE II Score to Predict the Outcome of Intensive Care Unit Patients.Front Med (Lausanne). 2022 Jan 26;8:744907. doi: 10.3389/fmed.2021.744907. eCollection 2021. Front Med (Lausanne). 2022. PMID: 35155461 Free PMC article.
-
Evaluation of Acute Physiology and Chronic Health Evaluation II and sequential organ failure assessment scoring systems for prognostication of outcomes among Intensive Care Unit's patients.Saudi J Anaesth. 2016 Apr-Jun;10(2):168-73. doi: 10.4103/1658-354X.168817. Saudi J Anaesth. 2016. PMID: 27051367 Free PMC article.
-
Comparison of full outline of unresponsiveness score and Glasgow Coma Scale in Medical Intensive Care Unit.Ann Card Anaesth. 2019 Apr-Jun;22(2):143-148. doi: 10.4103/aca.ACA_25_18. Ann Card Anaesth. 2019. PMID: 30971594 Free PMC article.
-
Performance of critical care prognostic scoring systems in low and middle-income countries: a systematic review.Crit Care. 2018 Jan 26;22(1):18. doi: 10.1186/s13054-017-1930-8. Crit Care. 2018. PMID: 29373996 Free PMC article.
References
-
- Knaus WA, Draper EA, Wagner DP, Zimmerman JE. APACHE II: A severity of disease classification system. Crit Care Med. 1985;13:818–29. - PubMed
-
- Desai S, Lakhani JD. Utility of SOFA and APACHE II score in sepsis in rural set up MICU. J Assoc Physicians India. 2013;61:608–11. - PubMed
-
- Bouch C, Thompson J. Severity scoring systems in the critically ill. Continuing Education in Anesthesia. Crit Care Pain. 2008;8:181–5.
-
- Teasdale G, Jennett B. Assessment of coma and impaired consciousness. A practical scale. Lancet. 1974;2:81–4. - PubMed