

Enhanced insulin signaling in density-enhanced phosphatase-1 (DEP-1) knockout mice
- PMID: 25830095
- PMCID: PMC4354926
- DOI: 10.1016/j.molmet.2015.02.001
Enhanced insulin signaling in density-enhanced phosphatase-1 (DEP-1) knockout mice
Abstract
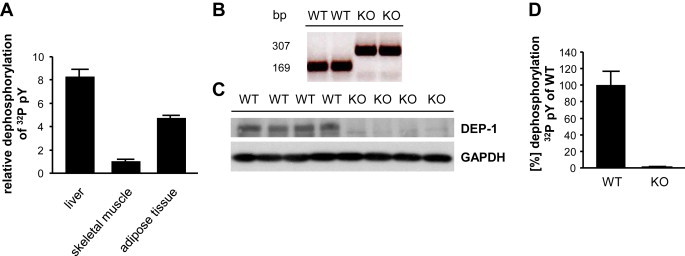
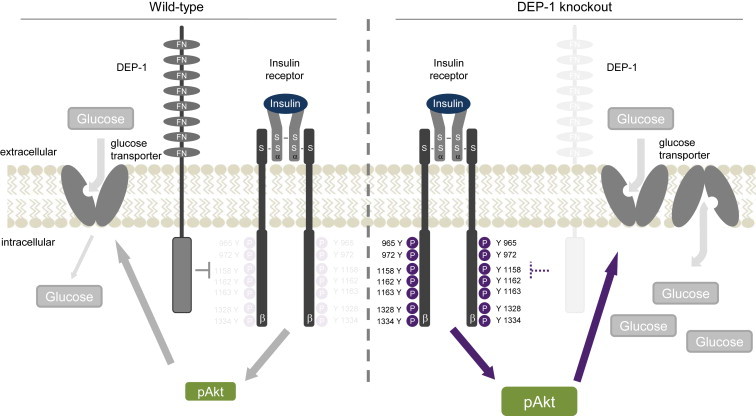
Objective: Insulin resistance can be triggered by enhanced dephosphorylation of the insulin receptor or downstream components in the insulin signaling cascade through protein tyrosine phosphatases (PTPs). Downregulating density-enhanced phosphatase-1 (DEP-1) resulted in an improved metabolic status in previous analyses. This phenotype was primarily caused by hepatic DEP-1 reduction.
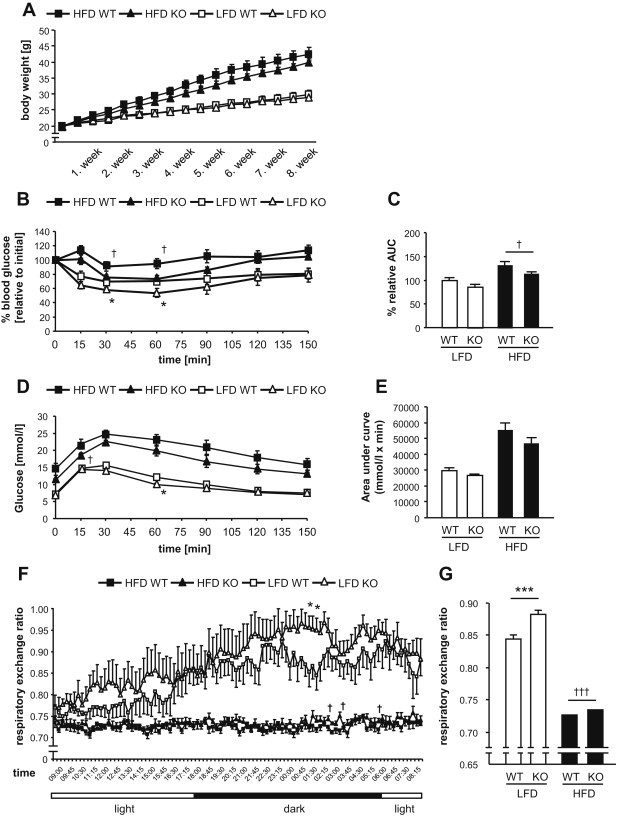
Methods: Here we further elucidated the role of DEP-1 in glucose homeostasis by employing a conventional knockout model to explore the specific contribution of DEP-1 in metabolic tissues. Ptprj (-/-) (DEP-1 deficient) and wild-type C57BL/6 mice were fed a low-fat or high-fat diet. Metabolic phenotyping was combined with analyses of phosphorylation patterns of insulin signaling components. Additionally, experiments with skeletal muscle cells and muscle tissue were performed to assess the role of DEP-1 for glucose uptake.
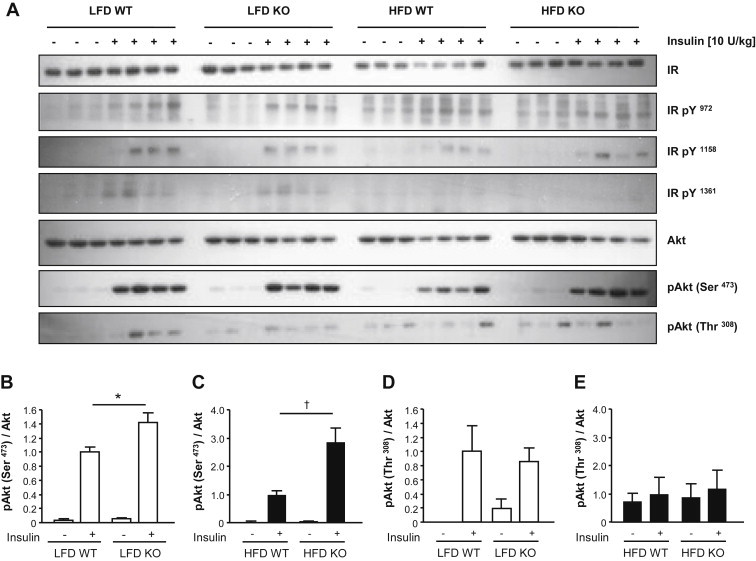
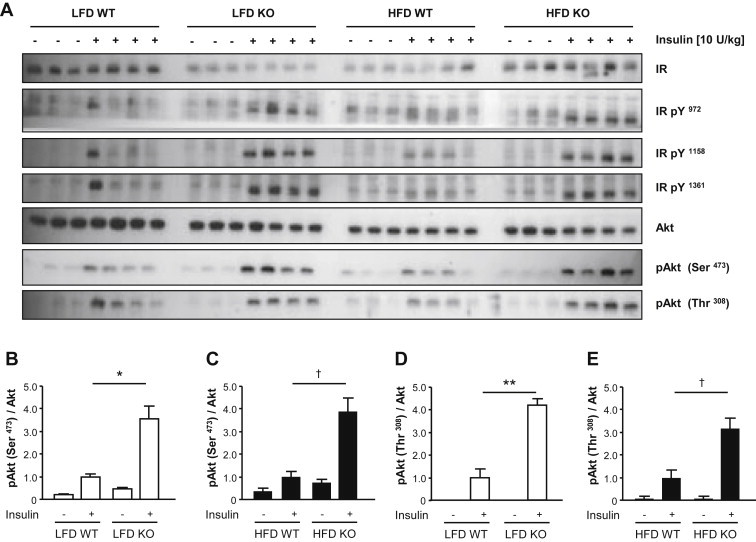
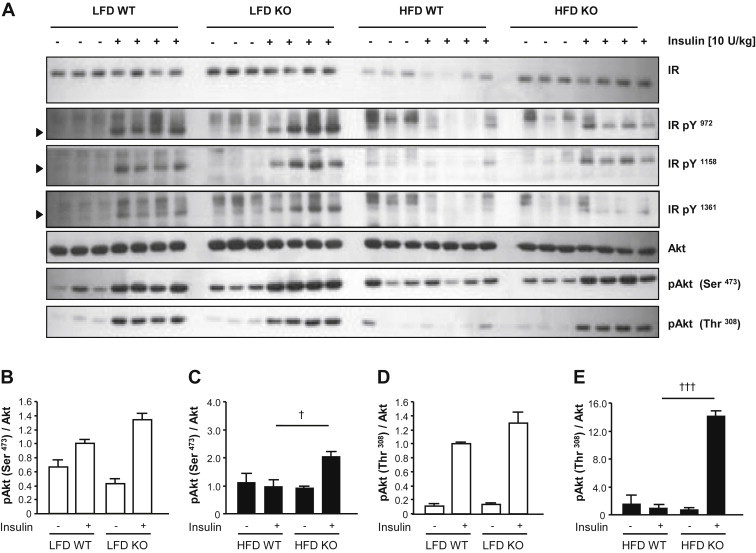
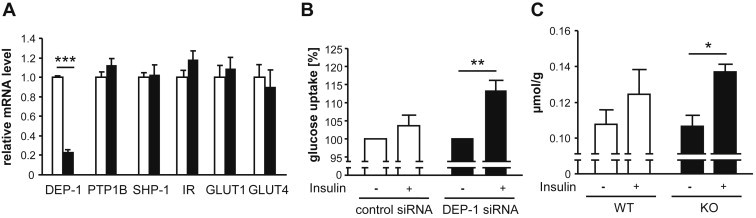
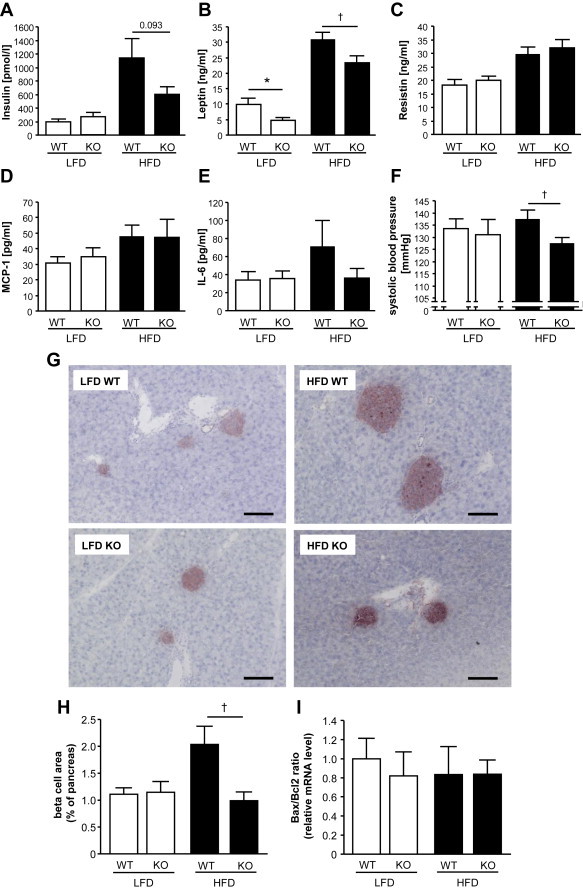
Results: High-fat diet fed-Ptprj (-/-) mice displayed enhanced insulin sensitivity and improved glucose tolerance. Furthermore, leptin levels and blood pressure were reduced in Ptprj (-/-) mice. DEP-1 deficiency resulted in increased phosphorylation of components of the insulin signaling cascade in liver, skeletal muscle and adipose tissue after insulin challenge. The beneficial effect on glucose homeostasis in vivo was corroborated by increased glucose uptake in skeletal muscle cells in which DEP-1 was downregulated, and in skeletal muscle of Ptprj (-/-) mice.
Conclusion: Together, these data establish DEP-1 as novel negative regulator of insulin signaling.
Keywords: DEP-1, density-enhanced phosphatase-1; Density-enhanced phosphatase-1; GTT, glucose tolerance test; Glucose homeostasis; HFD, high-fat diet; IL-6, interleukin 6; IR, insulin receptor; ITT, insulin tolerance test; Insulin resistance; Insulin signaling; KO, knockout; LFD, low-fat diet; MCP-1, monocyte chemotactic protein-1; PTP, protein tyrosine phosphatase; Phosphorylation; RER, respiratory exchange ratio; RTK, receptor tyrosine kinase; WT, wild-type.
Figures
Similar articles
-
Targeting density-enhanced phosphatase-1 (DEP-1) with antisense oligonucleotides improves the metabolic phenotype in high-fat diet-fed mice.Cell Commun Signal. 2013 Jul 26;11:49. doi: 10.1186/1478-811X-11-49. Cell Commun Signal. 2013. PMID: 23889985 Free PMC article.
-
Skeletal muscle salt inducible kinase 1 promotes insulin resistance in obesity.Mol Metab. 2015 Nov 6;5(1):34-46. doi: 10.1016/j.molmet.2015.10.004. eCollection 2016 Jan. Mol Metab. 2015. PMID: 26844205 Free PMC article.
-
Deficiency of the tumor promoter gene wip1 induces insulin resistance.Mol Endocrinol. 2015 Jan;29(1):28-39. doi: 10.1210/me.2014-1136. Mol Endocrinol. 2015. PMID: 25379953 Free PMC article.
-
PTP1B and TCPTP--nonredundant phosphatases in insulin signaling and glucose homeostasis.FEBS J. 2013 Jan;280(2):445-58. doi: 10.1111/j.1742-4658.2012.08563.x. Epub 2012 Apr 18. FEBS J. 2013. PMID: 22404968 Review.
-
The Structure, Function and Regulation of Protein Tyrosine Phosphatase Receptor Type J and Its Role in Diseases.Cells. 2022 Dec 20;12(1):8. doi: 10.3390/cells12010008. Cells. 2022. PMID: 36611803 Free PMC article. Review.
Cited by
-
Systemic LSD1 Inhibition Prevents Aberrant Remodeling of Metabolism in Obesity.Diabetes. 2022 Dec 1;71(12):2513-2529. doi: 10.2337/db21-1131. Diabetes. 2022. PMID: 36162056 Free PMC article.
-
Antitumor effects of β-elemene via targeting the phosphorylation of insulin receptor.Endocr Relat Cancer. 2019 Feb;26(2):187-199. doi: 10.1530/ERC-18-0370. Endocr Relat Cancer. 2019. PMID: 30422809 Free PMC article.
-
Loss of Protein Tyrosine Phosphatase Receptor J Expression Predicts an Aggressive Clinical Course in Patients with Esophageal Squamous Cell Carcinoma.Pathol Oncol Res. 2016 Jul;22(3):541-7. doi: 10.1007/s12253-015-0036-3. Epub 2015 Dec 23. Pathol Oncol Res. 2016. PMID: 26694178
-
A Mixture of Endocrine Disrupting Chemicals Associated with Lower Birth Weight in Children Induces Adipogenesis and DNA Methylation Changes in Human Mesenchymal Stem Cells.Int J Mol Sci. 2022 Feb 19;23(4):2320. doi: 10.3390/ijms23042320. Int J Mol Sci. 2022. PMID: 35216435 Free PMC article.
-
PTPRJ is a negative regulator of insulin signaling in neuronal cells, impacting protein biosynthesis, and neurite outgrowth.J Neuroendocrinol. 2024 Dec;36(12):e13446. doi: 10.1111/jne.13446. Epub 2024 Sep 10. J Neuroendocrinol. 2024. PMID: 39253900 Free PMC article.
References
-
- Saltiel A.R., Kahn C.R. Insulin signalling and the regulation of glucose and lipid metabolism. Nature. 2001;414:799–806. - PubMed
-
- Tikellis C., Pickering R., Tsorotes D., Du X.J., Kiriazis H., Nguyen-Huu T.P. Interaction of diabetes and ACE2 in the pathogenesis of cardiovascular disease in experimental diabetes. Clinical Science. 2012;123:519–529. - PubMed
-
- Hotamisligil G.S., Shargill N.S., Spiegelman B.M. Adipose expression of tumor necrosis factor-alpha: direct role in obesity-linked insulin resistance. Science. 1993;259:87–91. - PubMed
-
- Bevan P. Insulin signalling. Journal of Cell Science. 2001;114:1429–1430. - PubMed
LinkOut - more resources
Full Text Sources
Other Literature Sources
Molecular Biology Databases
Research Materials
Miscellaneous
