

Impact of nutrition and salinity changes on biological performances of green and white sturgeon
- PMID: 25830227
- PMCID: PMC4382339
- DOI: 10.1371/journal.pone.0122029
Impact of nutrition and salinity changes on biological performances of green and white sturgeon
Abstract
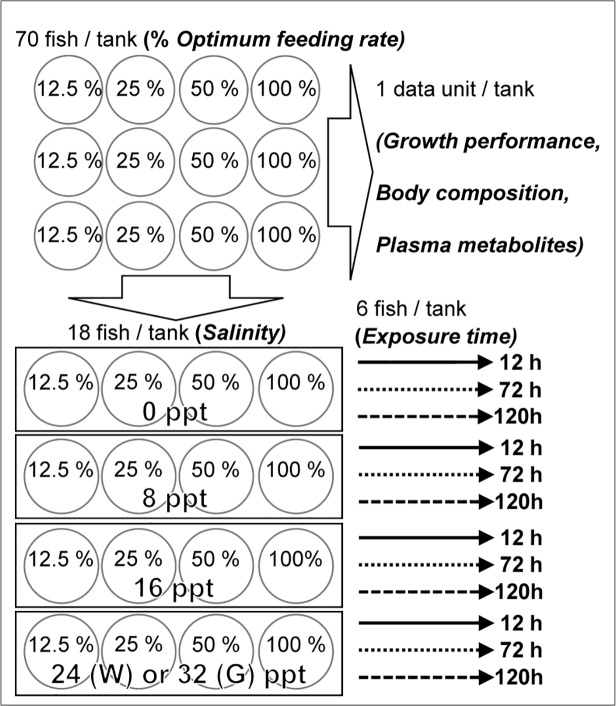
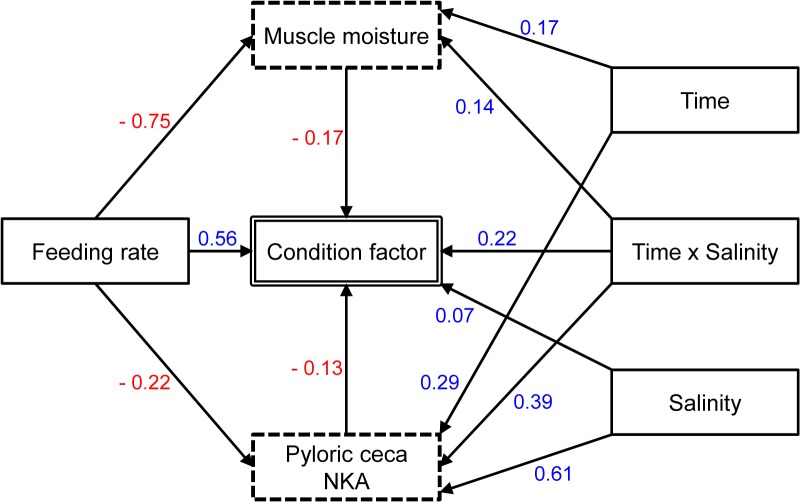
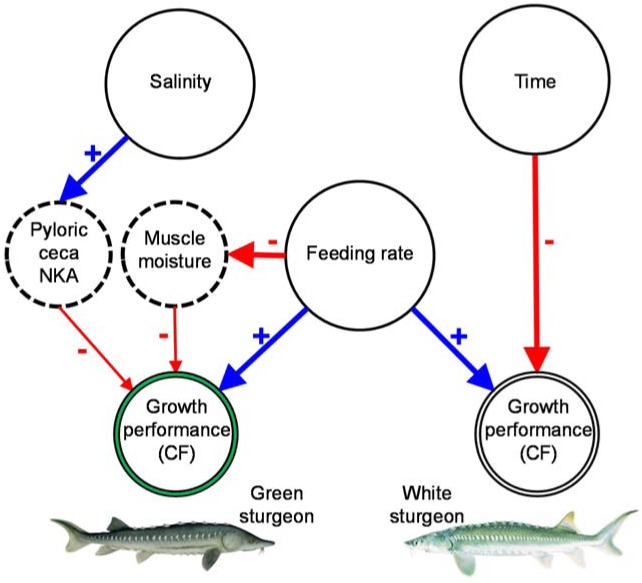
Green and white sturgeon are species of high conservational and economic interest, particularly in the San Francisco Bay Delta (SFBD) for which significant climate change-derived alterations in salinity and nutritional patterns are forecasted. Although there is paucity of information, it is critical to test the network of biological responses underlying the capacity of animals to tolerate current environmental changes. Through nutrition and salinity challenges, climate change will likely have more physiological effect on young sturgeon stages, which in turn may affect growth performance. In this study, the two species were challenged in a multiple-factor experimental setting, first to levels of feeding rate, and then to salinity levels for different time periods. Data analysis included generalized additive models to select predictors of growth performance (measured by condition factor) among the environmental stressors considered and a suite of physiological variables. Using structural equation modeling, a path diagram is proposed to quantify the main linkages among nutrition status, salinity, osmoregulation variables, and growth performances. Three major trends were anticipated for the growth performance of green and white sturgeon in the juvenile stage in the SFBD: (i) a decrease in prey abundance will be highly detrimental for the growth of both species; (ii) an acute increase in salinity within the limits studied can be tolerated by both species but possibly the energy spent in osmoregulation may affect green sturgeon growth within the time window assessed; (iii) the mechanism of synergistic effects of nutrition and salinity changes will be more complex in green sturgeon, with condition factor responding nonlinearly to interactions of salinity and nutrition status or time of salinity exposure. Green sturgeon merits special scientific attention and conservation effort to offset the effects of feed restriction and salinity as key environmental stressors in the SFBD.
Conflict of interest statement
Figures
Similar articles
-
Effects of feed restriction on salinity tolerance in white sturgeon (Acipenser transmontanus).Comp Biochem Physiol A Mol Integr Physiol. 2015 Oct;188:156-67. doi: 10.1016/j.cbpa.2015.06.027. Epub 2015 Jun 27. Comp Biochem Physiol A Mol Integr Physiol. 2015. PMID: 26123778
-
Effect of nutritional status on the osmoregulation of green sturgeon (Acipenser medirostris).Physiol Biochem Zool. 2015 Jan-Feb;88(1):22-42. doi: 10.1086/679519. Epub 2014 Dec 18. Physiol Biochem Zool. 2015. PMID: 25590591
-
The physiological responses of green sturgeon (Acipenser medirostris) to potential global climate change stressors.Physiol Biochem Zool. 2014 May-Jun;87(3):456-63. doi: 10.1086/675494. Epub 2014 Mar 6. Physiol Biochem Zool. 2014. PMID: 24769709
-
Physiological mechanisms used by fish to cope with salinity stress.J Exp Biol. 2015 Jun;218(Pt 12):1907-14. doi: 10.1242/jeb.118695. J Exp Biol. 2015. PMID: 26085667 Review.
-
Too Hot to Handle: A Meta-Analytical Review of the Thermal Tolerance and Adaptive Capacity of North American Sturgeon.Glob Chang Biol. 2024 Nov;30(11):e17564. doi: 10.1111/gcb.17564. Glob Chang Biol. 2024. PMID: 39563555
Cited by
-
The role of salinity in recovery of white sturgeon (Acipenser transmontanus) from stimulated angling stress.Conserv Physiol. 2023 Mar 17;11(1):coad009. doi: 10.1093/conphys/coad009. eCollection 2023. Conserv Physiol. 2023. PMID: 36950376 Free PMC article.
-
Optimal Feeding Rates for Growth Performance, Nutrient Retention, and Heat Shock Protein 70 Expression in Fingerling Yellow Perch (Perca flavescens).Animals (Basel). 2025 May 19;15(10):1465. doi: 10.3390/ani15101465. Animals (Basel). 2025. PMID: 40427342 Free PMC article.
-
Recent advances in sturgeon nutrition.Anim Nutr. 2017 Sep;3(3):191-204. doi: 10.1016/j.aninu.2017.05.005. Epub 2017 May 30. Anim Nutr. 2017. PMID: 29767119 Free PMC article. Review.
-
Developmental responses of sterlet (Acipenser ruthenus) to temperature modulation with insights into intestinal and morphological traits.Sci Rep. 2025 May 25;15(1):18170. doi: 10.1038/s41598-025-02566-y. Sci Rep. 2025. PMID: 40414943 Free PMC article.
-
Substrate-dependent fish have shifted less in distribution under climate change.Commun Biol. 2020 Oct 16;3(1):586. doi: 10.1038/s42003-020-01325-1. Commun Biol. 2020. PMID: 33067547 Free PMC article.
References
-
- IPCC (Intergovernmental Panel on Climate Change). Working Group I Contribution to the IPCC Fifth Assessment Report Climate Change 2013: The Physical Sciences Basis Summary for Policymakers. Cambridge, UK: Cambridge University Press; 2013.
-
- Meehl GA, Washington WM, Collins WD, Arblaster JM, Hu A, Buja LE, et al. How Much More Global Warming and Sea Level Rise? Science. 2005; 307: 1769–1772. - PubMed
-
- Cloern JE, Jassby AD. Drivers of change in estuarine-coastal ecosystems: Discoveries from four decades of study in San Francisco Bay. Rev Geophys. 2012; 50: RG4001.
