. 2015 May 20;26(5):899-905.
doi: 10.1021/acs.bioconjchem.5b00107. Epub 2015 Apr 9.

Nanodiscs as a Modular Platform for Multimodal MR-Optical Imaging

Affiliations

Nanodiscs as a Modular Platform for Multimodal MR-Optical Imaging

Christiane E Carney et al. Bioconjug Chem. .

Abstract

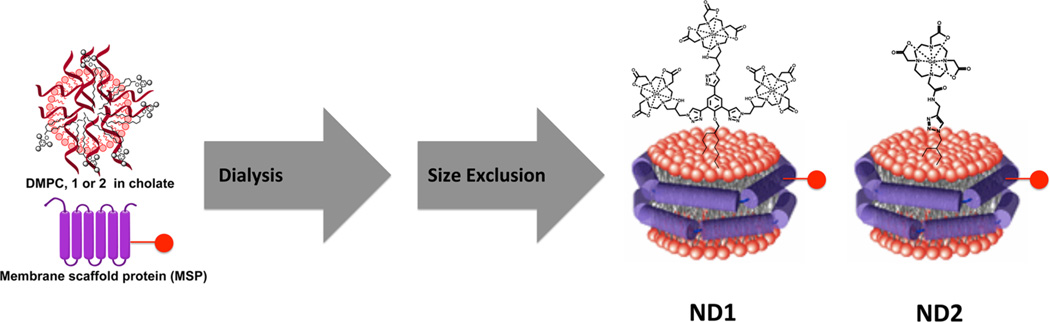
Nanodiscs are monodisperse, self-assembled discoidal particles that consist of a lipid bilayer encircled by membrane scaffold proteins (MSP). Nanodiscs have been used to solubilize membrane proteins for structural and functional studies and deliver therapeutic phospholipids. Herein, we report on tetramethylrhodamine (TMR) tagged nanodiscs that solubilize lipophilic MR contrast agents for generation of multimodal nanoparticles for cellular imaging. We incorporate both multimeric and monomeric Gd(III)-based contrast agents into nanodiscs and show that particles containing the monomeric agent (ND2) label cells with high efficiency and generate significant image contrast at 7 T compared to nanodiscs containing the multimeric agent (ND1) and Prohance, a clinically approved contrast agent.


Figures

Figure 1
Figure 1
Structures of lipophilic contrast agents for incorporation into nanodiscs. Complex 1 is multimeric and contains three Gd(III) chelates, while 2 is monomeric and contains a single Gd(III) chelate.
Figure 2
Figure 2
Confocal micrographs of HeLa cells incubated with 1 µM of ND0, ND1, and ND2 show intracellular accumulation. Blue = DAPI, Red = TMR. Scale bar = 20 µm.
Figure 3
Figure 3
Localization of 1 and 2 was determined using cell fractionation and showed greater accumulation of the contrast agents in the cell membrane compared to the cytosol. These results suggest that the lipids in the nanodiscs can undergo exchange with lipids in the cell membrane.
Figure 4
Figure 4
Cell uptake of ND1 and ND2 was determined in HeLa (red) and MCF7 (blue) cells at varied incubation concentrations. (A) Uptake at variable nanodisc incubation concentrations shows the same labeling for ND1 and ND2. (B) Uptake at variable Gd(III) incubation concentrations shows that ND2 attains higher cell labeling. Error bars represent the standard deviation of triplicate experiments.
Figure 5
Figure 5
T1-weighted MR images at 7 T of HeLa cell pellets labeled with ND0, ND1, ND2, and ProHance. Scale bar represents 1 mm. Error bars represent the standard deviation of the mean of 4 slices. TE = 11 ms, TR = 500 ms, MTX = 256 × 256. These images show that at incubation concentrations of 30 µM Gd(III), ND2 produces the greatest image contrast.
Figure 6
Figure 6
Cellular proliferation and retention of HeLa and MCF7 cells treated with concentrations of ND1 (45 µM Gd(III)), ND2 (25 µM Gd(III)), and ProHance (2 mM) chosen to equalize cell labeling. (A) Cellular proliferation was measured as the fold increase in cell number between time = 0 and 72 h. No significant change in proliferation was observed. (B) Cellular retention in HeLa cells was determined by measuring the Gd(III) content in the media at 4, 24, 48, and 72 h postlabeling. ND1 shows the greatest retention in HeLa cells. (C) Cellular retention was also determined in MCF7 cells. Similar retention was observed for ND1 and ProHance while ND2 was retained least effectively by cells. Error bars represent ± the standard deviation of triplicate experiments.
Scheme 1
Scheme 1. Nanodiscs Were Synthesized to Contain Varied Amounts of Complex 1 (ND1) or 2 (ND2)a
aNanodiscs were prepared by combining DMPC phospholipids, 1 or 2, and TMR-tagged MSP in cholate. The cholate was removed and the nanodiscs were purified with size exclusion chromatography.

References

    1. Modo M, Beech JS, Meade TJ, Williams SCR, Price J. A chronic 1 year assessment of MRI contrast agent-labelled neural stem cell transplants in stroke. Neuroimage. 2009;47:T133–T142. - PMC - PubMed
    1. Modo M, Roberts T, Sandhu J, Brekke C, Ashioti M, Meade TJ, Price J, Williams SCR. In vivo detection of stem cells by magnetic resonance imaging. Neurobiol. Aging. 2004;25:S19–S19.
    1. Ahrens ET, Bulte JWM. Tracking immune cells in vivo using magnetic resonance imaging. Nat. Rev. Immunol. 2013;13:755–763. - PMC - PubMed
    1. Weissleder R. Molecular imaging in cancer. Science. 2006;312:1168–1171. - PubMed
    1. Massoud TF, Gambhir SS. Molecular imaging in living subjects: seeing fundamental biological processes in a new light. Gene Dev. 2003;17:545–580. - PubMed

Publication types