

Analyzing large gene expression and methylation data profiles using StatBicRM: statistical biclustering-based rule mining
- PMID: 25830807
- PMCID: PMC4382191
- DOI: 10.1371/journal.pone.0119448
Analyzing large gene expression and methylation data profiles using StatBicRM: statistical biclustering-based rule mining
Abstract
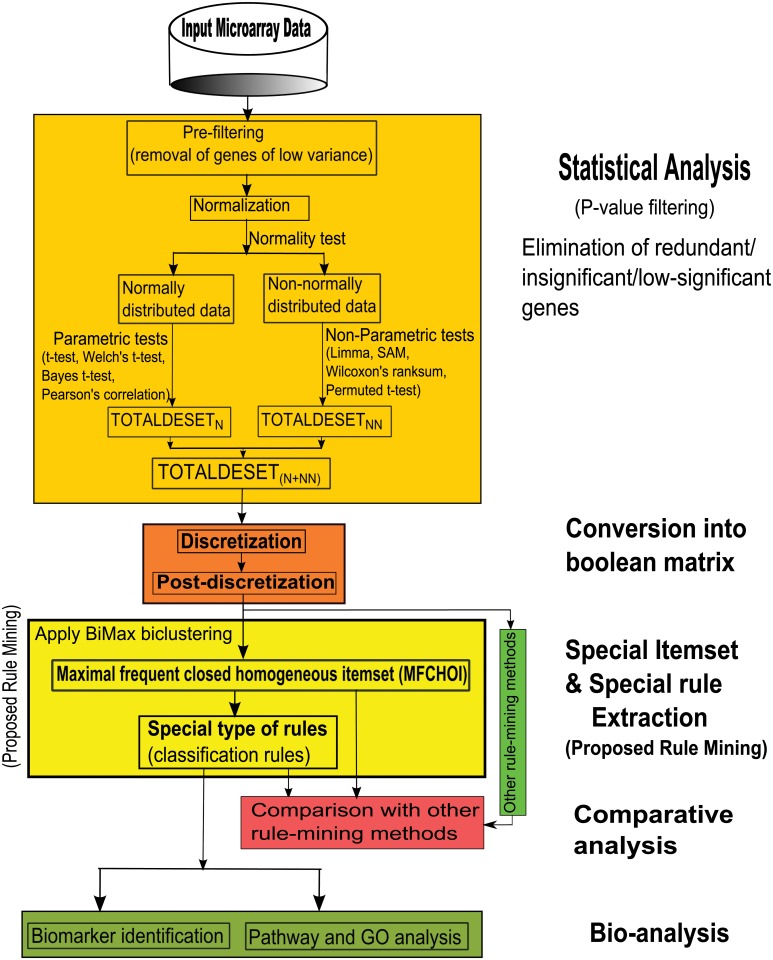
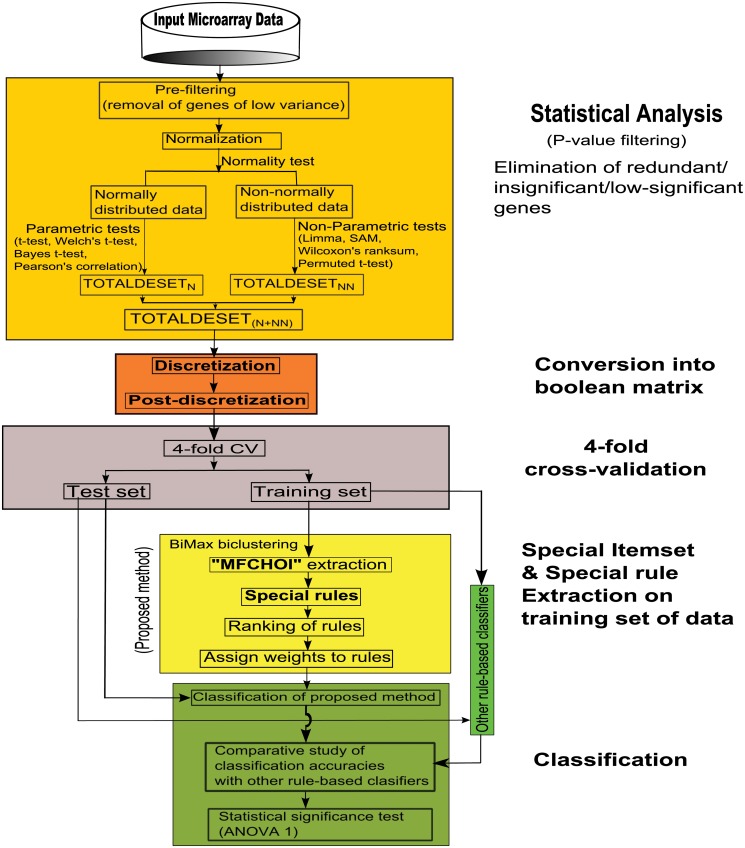
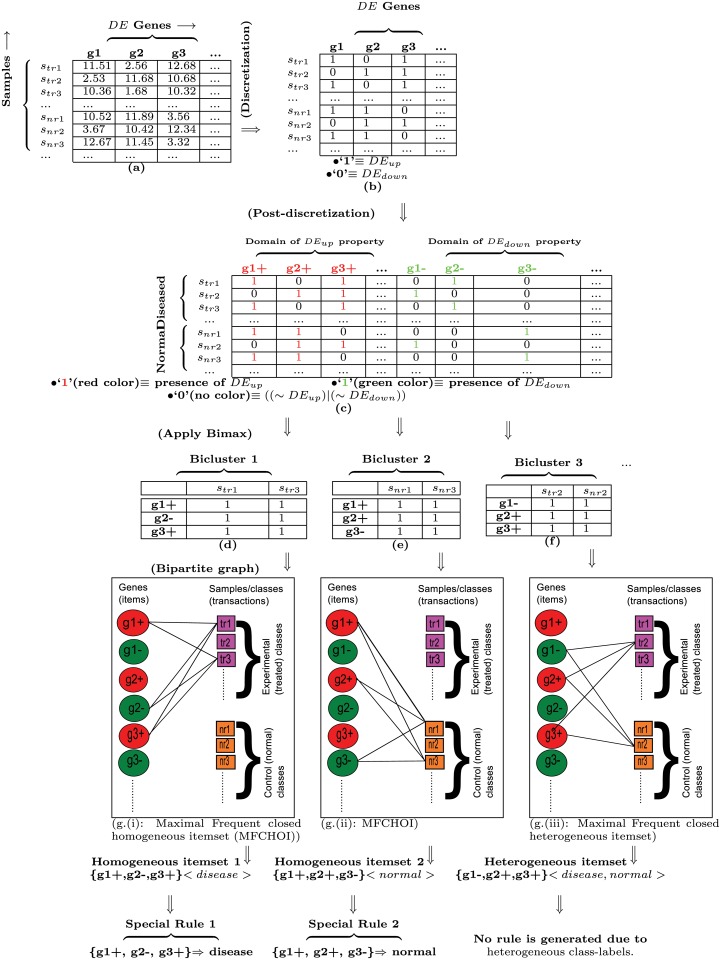
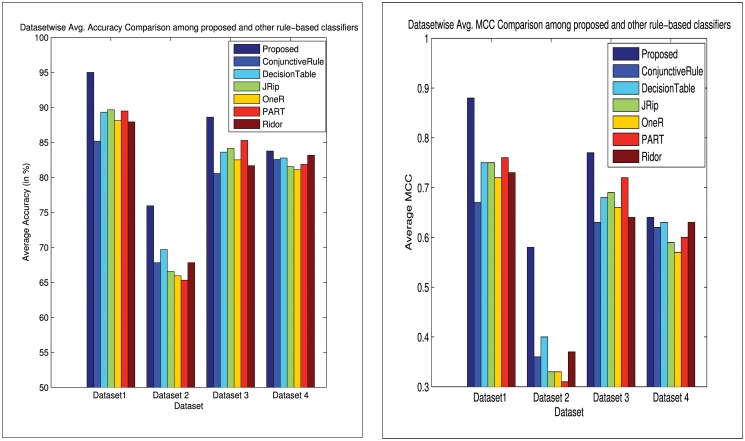
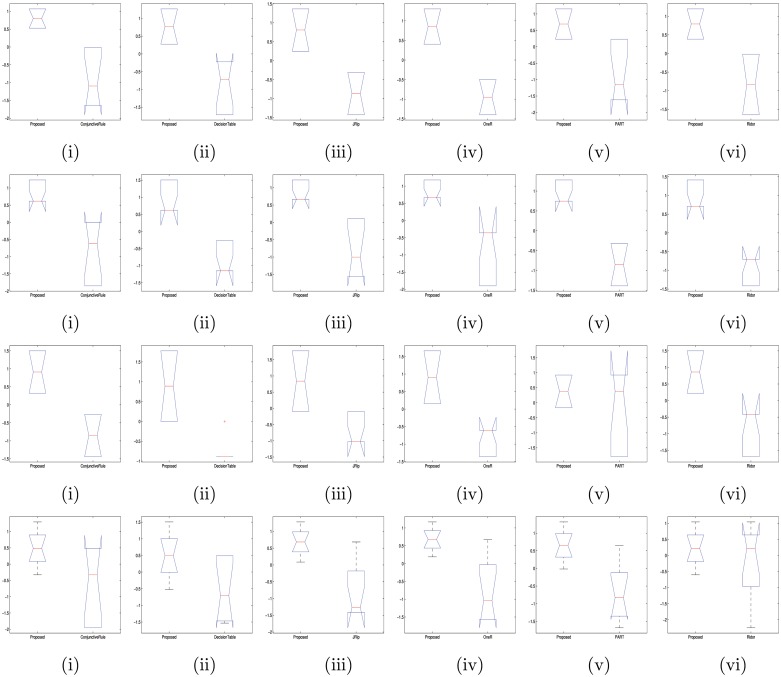
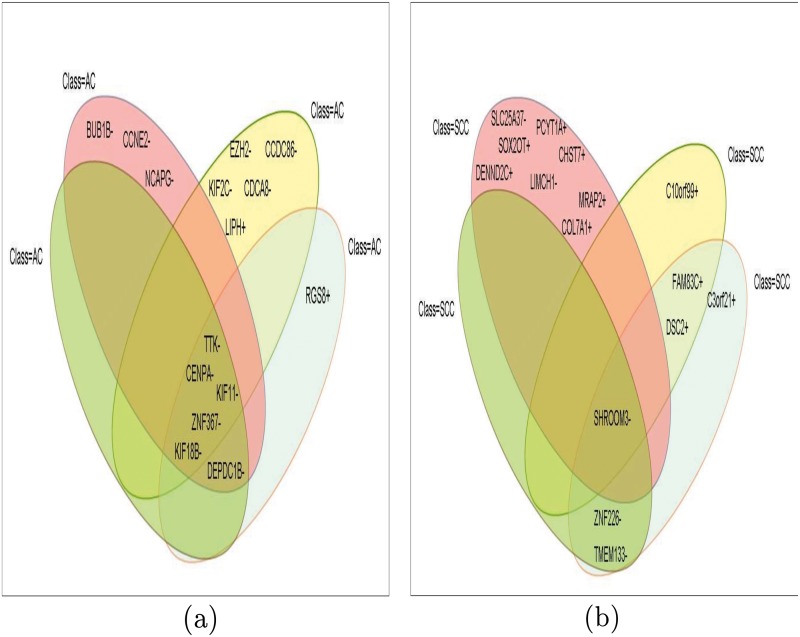
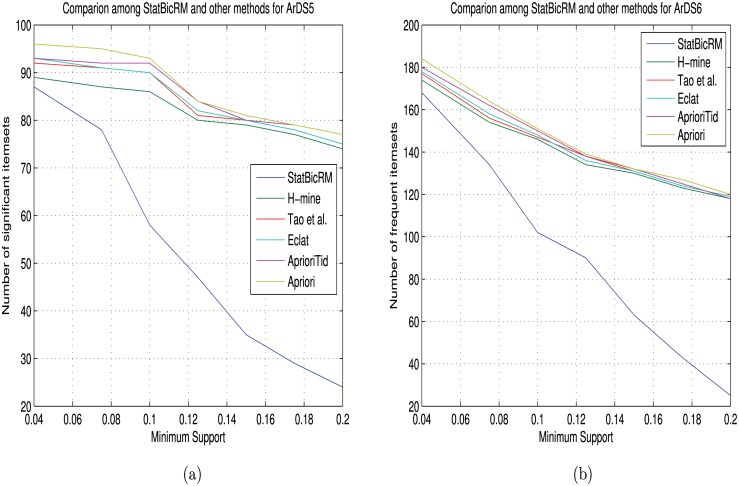
Microarray and beadchip are two most efficient techniques for measuring gene expression and methylation data in bioinformatics. Biclustering deals with the simultaneous clustering of genes and samples. In this article, we propose a computational rule mining framework, StatBicRM (i.e., statistical biclustering-based rule mining) to identify special type of rules and potential biomarkers using integrated approaches of statistical and binary inclusion-maximal biclustering techniques from the biological datasets. At first, a novel statistical strategy has been utilized to eliminate the insignificant/low-significant/redundant genes in such way that significance level must satisfy the data distribution property (viz., either normal distribution or non-normal distribution). The data is then discretized and post-discretized, consecutively. Thereafter, the biclustering technique is applied to identify maximal frequent closed homogeneous itemsets. Corresponding special type of rules are then extracted from the selected itemsets. Our proposed rule mining method performs better than the other rule mining algorithms as it generates maximal frequent closed homogeneous itemsets instead of frequent itemsets. Thus, it saves elapsed time, and can work on big dataset. Pathway and Gene Ontology analyses are conducted on the genes of the evolved rules using David database. Frequency analysis of the genes appearing in the evolved rules is performed to determine potential biomarkers. Furthermore, we also classify the data to know how much the evolved rules are able to describe accurately the remaining test (unknown) data. Subsequently, we also compare the average classification accuracy, and other related factors with other rule-based classifiers. Statistical significance tests are also performed for verifying the statistical relevance of the comparative results. Here, each of the other rule mining methods or rule-based classifiers is also starting with the same post-discretized data-matrix. Finally, we have also included the integrated analysis of gene expression and methylation for determining epigenetic effect (viz., effect of methylation) on gene expression level.
Conflict of interest statement
Figures

Similar articles
-
RANWAR: rank-based weighted association rule mining from gene expression and methylation data.IEEE Trans Nanobioscience. 2015 Jan;14(1):59-66. doi: 10.1109/TNB.2014.2359494. Epub 2014 Sep 23. IEEE Trans Nanobioscience. 2015. PMID: 25265613
-
DTFP-Growth: Dynamic Threshold-Based FP-Growth Rule Mining Algorithm Through Integrating Gene Expression, Methylation, and Protein-Protein Interaction Profiles.IEEE Trans Nanobioscience. 2018 Apr;17(2):117-125. doi: 10.1109/TNB.2018.2803021. IEEE Trans Nanobioscience. 2018. PMID: 29870335
-
Integrating Multiple Data Sources for Combinatorial Marker Discovery: A Study in Tumorigenesis.IEEE/ACM Trans Comput Biol Bioinform. 2018 Mar-Apr;15(2):673-687. doi: 10.1109/TCBB.2016.2636207. Epub 2016 Dec 6. IEEE/ACM Trans Comput Biol Bioinform. 2018. PMID: 28114033
-
It is time to apply biclustering: a comprehensive review of biclustering applications in biological and biomedical data.Brief Bioinform. 2019 Jul 19;20(4):1449-1464. doi: 10.1093/bib/bby014. Brief Bioinform. 2019. PMID: 29490019 Free PMC article. Review.
-
Biclustering data analysis: a comprehensive survey.Brief Bioinform. 2024 May 23;25(4):bbae342. doi: 10.1093/bib/bbae342. Brief Bioinform. 2024. PMID: 39007596 Free PMC article. Review.
Cited by
-
Molecular signatures identified by integrating gene expression and methylation in non-seminoma and seminoma of testicular germ cell tumours.Epigenetics. 2021 Jan-Feb;16(2):162-176. doi: 10.1080/15592294.2020.1790108. Epub 2020 Jul 13. Epigenetics. 2021. PMID: 32615059 Free PMC article.
-
Coordinated medical care for children with neurofibromatosis type 1 and related RASopathies in Poland.Arch Med Sci. 2019 May 17;17(5):1221-1231. doi: 10.5114/aoms.2019.85143. eCollection 2021. Arch Med Sci. 2019. PMID: 34522251 Free PMC article.
-
Detecting TF-miRNA-gene network based modules for 5hmC and 5mC brain samples: a intra- and inter-species case-study between human and rhesus.BMC Genet. 2018 Jan 22;19(1):9. doi: 10.1186/s12863-017-0574-7. BMC Genet. 2018. PMID: 29357837 Free PMC article.
-
Optimal ranking and directional signature classification using the integral strategy of multi-objective optimization-based association rule mining of multi-omics data.Front Bioinform. 2023 Jul 27;3:1182176. doi: 10.3389/fbinf.2023.1182176. eCollection 2023. Front Bioinform. 2023. PMID: 37576714 Free PMC article.
-
3PNMF-MKL: A non-negative matrix factorization-based multiple kernel learning method for multi-modal data integration and its application to gene signature detection.Front Genet. 2023 Feb 14;14:1095330. doi: 10.3389/fgene.2023.1095330. eCollection 2023. Front Genet. 2023. PMID: 36865387 Free PMC article.
References
-
- Bandyopadhyay S, Maulik U, Wang J. Analysis of Biological Data: A Soft Computing Approach World Scientific, Singapore; 2007.
-
- Maulik U. Analysis of gene microarray data in a soft computing framework. Applied Soft Computing 2011; 11: 4152–4160. 10.1016/j.asoc.2011.03.004 - DOI
-
- Maulik U, Bandyopadhyay S, Wang J. Computational Intelligence and Pattern Analysis in Biological Informatics. Wiley, Singapore; 2010.
-
- Mallik S, Mukhopadhyay A, Maulik U, Bandyopadhyay S. Integrated analysis gene expression and genome-wide DNA methylation for tumor prediction: An association rule mining-based approach In: Proceedings IEEE Symposium on Computational Intelligence in Bioinformatics and Computational Biology (CIBCB), IEEE Symposium Series on Computational Intelligence (SSCI), Singapore: 2013.
-
- Dudoit S, Yang Y, Speed T, Callow M. Statistical methods for identifying differentially expressed genes in replicated cdna microarray experiments. Statistica Sinica 2002; 12: 111–139.
MeSH terms
LinkOut - more resources
Full Text Sources
Other Literature Sources
