. 2015 Apr 9;520(7546):192-197.
doi: 10.1038/nature14362. Epub 2015 Apr 1.

Fatty acid carbon is essential for dNTP synthesis in endothelial cells

Affiliations

Fatty acid carbon is essential for dNTP synthesis in endothelial cells

Sandra Schoors et al. Nature. .

Erratum in

  • Corrigendum: Fatty acid carbon is essential for dNTP synthesis in endothelial cells.
    Schoors S, Bruning U, Missiaen R, Queiroz KC, Borgers G, Elia I, Zecchin A, Cantelmo AR, Christen S, Goveia J, Heggermont W, Goddë L, Vinckier S, Van Veldhoven PP, Eelen G, Schoonjans L, Gerhardt H, Dewerchin M, Baes M, De Bock K, Ghesquière B, Lunt SY, Fendt SM, Carmeliet P. Schoors S, et al. Nature. 2015 Oct 1;526(7571):144. doi: 10.1038/nature14624. Epub 2015 Aug 5. Nature. 2015. PMID: 26245368 No abstract available.

Abstract

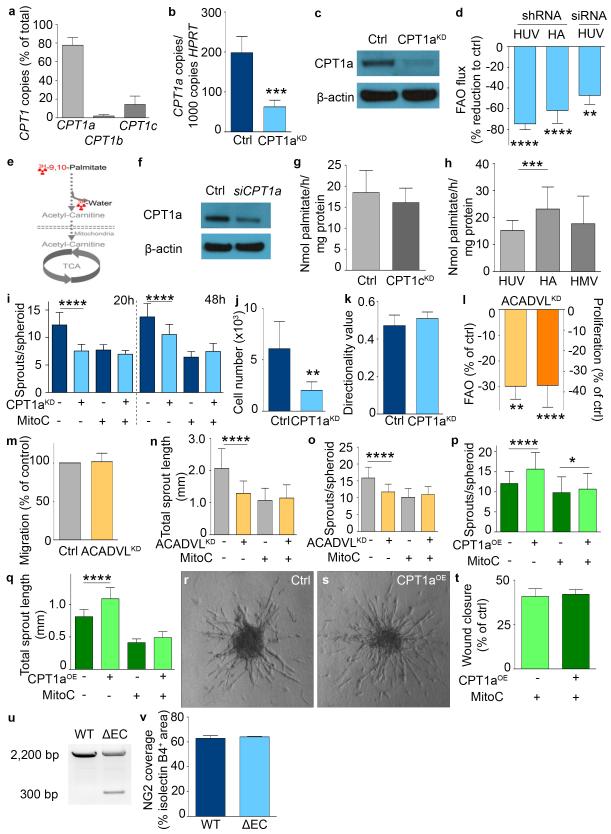
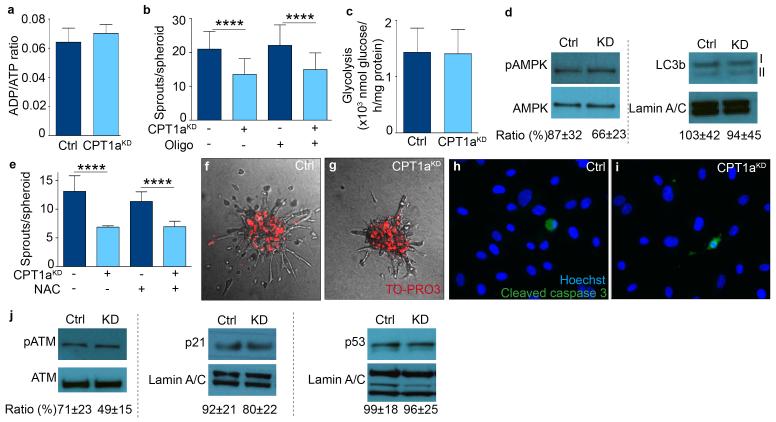
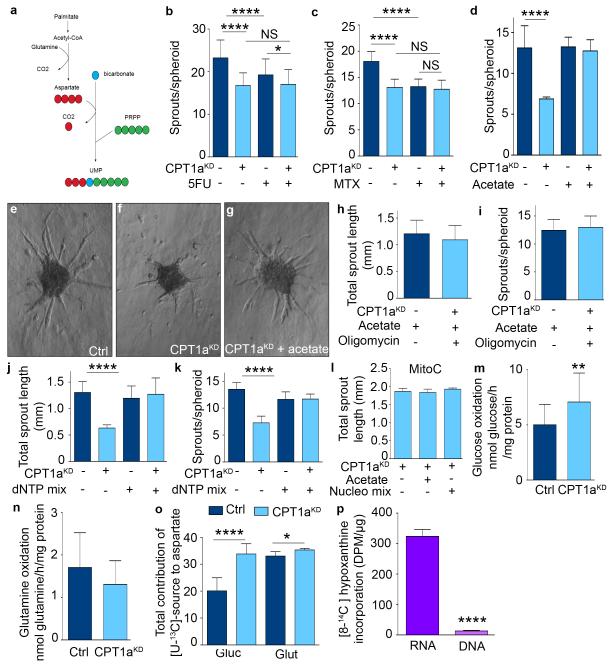
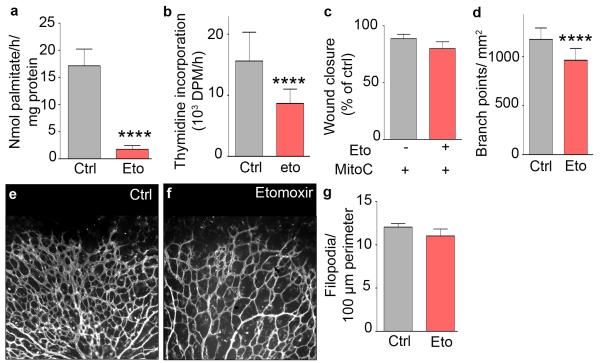
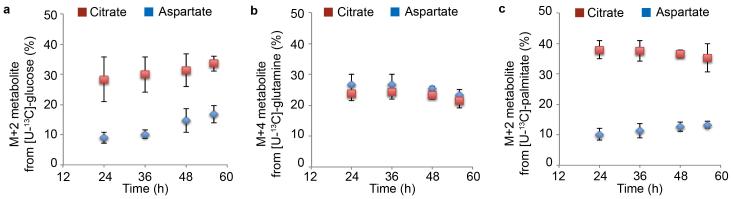
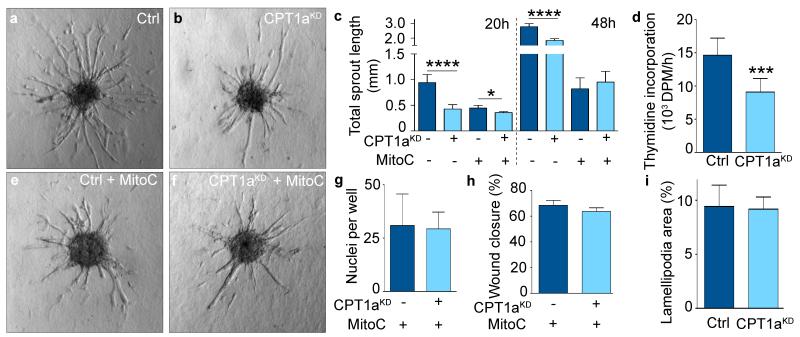
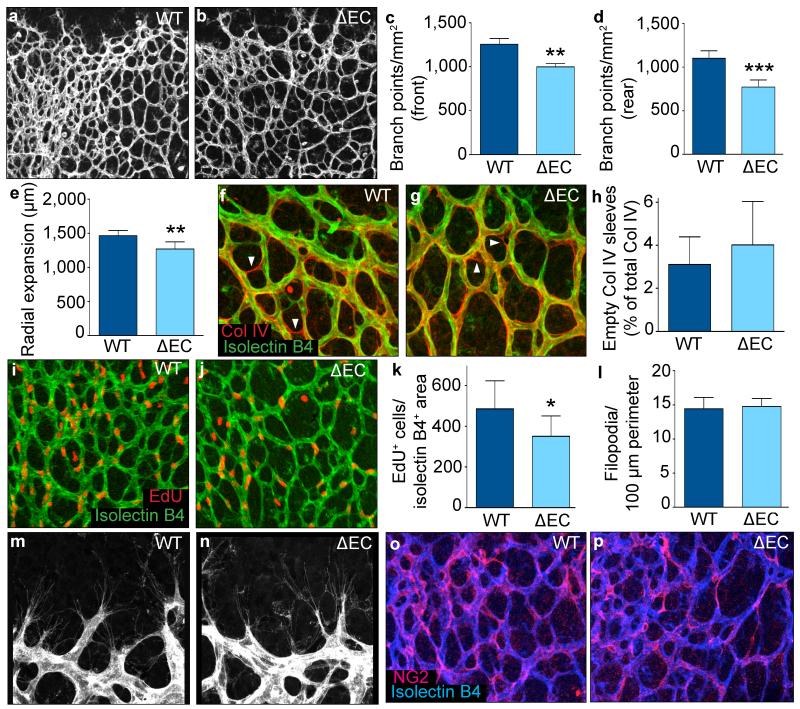
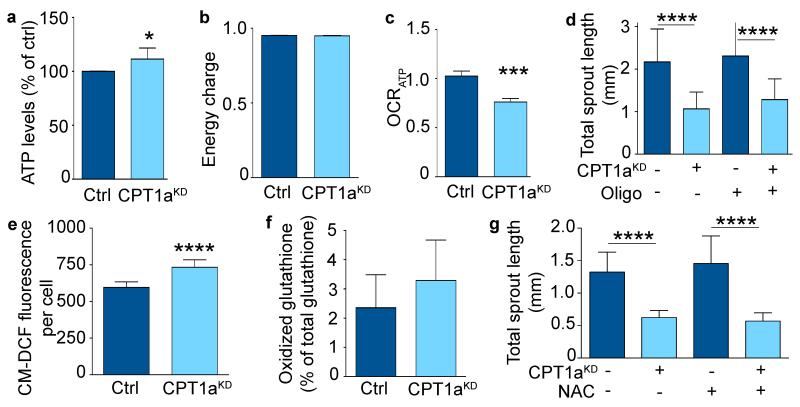
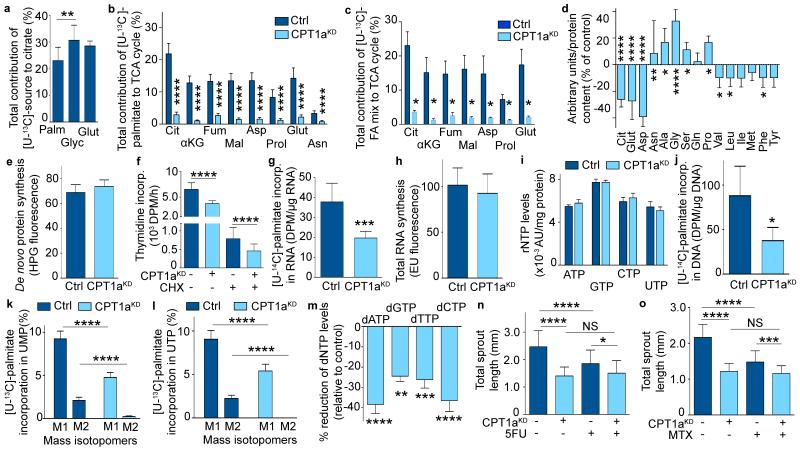
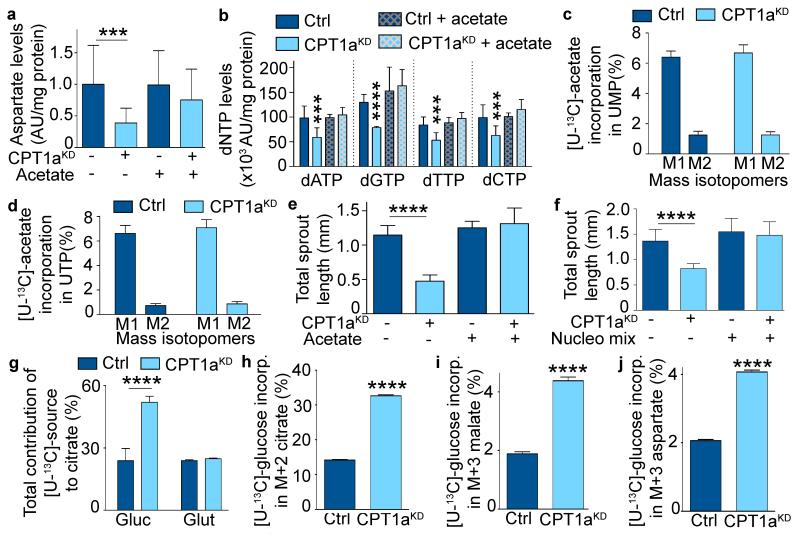
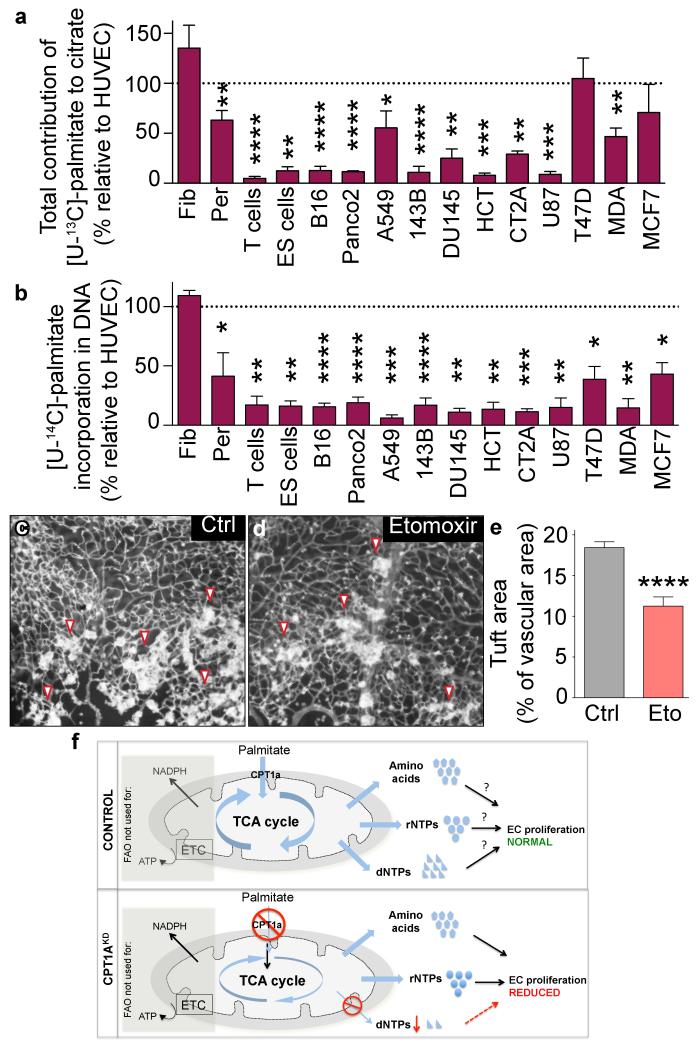
The metabolism of endothelial cells during vessel sprouting remains poorly studied. Here we report that endothelial loss of CPT1A, a rate-limiting enzyme of fatty acid oxidation (FAO), causes vascular sprouting defects due to impaired proliferation, not migration, of human and murine endothelial cells. Reduction of FAO in endothelial cells did not cause energy depletion or disturb redox homeostasis, but impaired de novo nucleotide synthesis for DNA replication. Isotope labelling studies in control endothelial cells showed that fatty acid carbons substantially replenished the Krebs cycle, and were incorporated into aspartate (a nucleotide precursor), uridine monophosphate (a precursor of pyrimidine nucleoside triphosphates) and DNA. CPT1A silencing reduced these processes and depleted endothelial cell stores of aspartate and deoxyribonucleoside triphosphates. Acetate (metabolized to acetyl-CoA, thereby substituting for the depleted FAO-derived acetyl-CoA) or a nucleoside mix rescued the phenotype of CPT1A-silenced endothelial cells. Finally, CPT1 blockade inhibited pathological ocular angiogenesis in mice, suggesting a novel strategy for blocking angiogenesis.


Figures

Extended Data Figure 1
Extended Data Figure 1. FAO regulates vessel sprouting
a, mRNA expression of CPT1 isoforms (n=3). b, CPT1a mRNA levels upon CPT1a silencing (CPT1aKD) (n=11). c, Representative immunoblot of CPT1a for control and CPT1aKD ECs. d, FAO flux upon CPT1a silencing in venous (HUV) and arterial (HA) ECs, or upon small interference RNA transfection in venous ECs (siRNA) (n=6 for HUV shRNA, n=3 for HA shRNA and HUV siRNA). e, Schematic representation of FAO measurement using [9,10-3H]-palmitate (reproduced from Wang et al. with permission). f, Representative immunoblot for CPT1a upon genetic silencing of CPT1a using siRNA (siCPT1a). g, FAO flux upon silencing of CPT1c (CPT1cKD) (n=3 independent p=NS). h, FAO flux levels in venous (HUV), arterial (HA) and microvascular (HMV) ECs (n=4 for HUV vs HA and n=3 for HUV vs HMV). i, Sprout number in control and CPT1aKD EC spheroids with mitomycin C (MitoC) treatment as indicated (n=3) j, Flow cytometry counting of viable control and CPT1aKD ECs (n=3). k, Analysis of random cell-motility tracks in control and CPT1aKD ECs (n=4; p=NS). l, FAO flux and proliferation upon silencing of ACADVL (ACADVLKD) (n=3 for each). m, Wound closure in control and ACADVLKD ECs (n=3; p=NS). n,o, Quantification of vessel sprouting in control and ACADVLKD EC spheroids with MitoC treatment as indicated, total sprout length (n) and sprout numbers per spheroid (o) (n=5). p, Sprout number in control and CPT1aOE EC spheroids with MitoC treatment as indicated (n=3). q, Total sprout length in control and CPT1aOE EC spheroids treated with MitoC as indicated (n=5). r,s, Representative phase contrast images of control (r) and CPT1aOE (s) EC spheroids. t, Scratch wound assay in control and CPT1aOE ECs treated with MitoC as indicated (n=3; p=NS). u, PCR analysis of genomic DNA from WT and CPT1aΔEC pups, confirming Cre-mediated recombination of the floxed Cpt1a allele as shown by the appearance of a 300 bp band. v, NG2+ area in neonatal vascular plexus of WT and CPT1aΔEC mice (3 litters, n=8 pups for WT and 7 pups for CPT1aΔEC; p=NS). Data are mean ± s.e.m of n independent experiments (a,b,d,g-q,t) or the total number of mice (v). Statistical test: mixed models. NS, not significant. *p<0.05, **p<0.01, ***p<0.001, ****p<0.0001.
Extended data Figure 2
Extended data Figure 2. CPT1a silencing does not cause cellular distress
a, ADP/ATP ratio in control and CPT1aKD ECs (n=3; p=NS). b, Sprout number upon oligomycin treatment (oligo) in control and CPT1aKD EC spheroids (n=3). c, Glycolysis measurement in control and CPT1aKD ECs (n=3; p=NS). d, Representative immunoblot for phosphorylated AMPK (pAMPK) and total AMPK (AMPK) and for LC3b I and II in control and CPT1aKD ECs. The ratio of the densitometrically quantified bands of pAMPK/AMPK and LC3b II/I is shown below the blots (n=3; p=NS). e, Sprout number upon N-acetylcysteine (NAC) treatment in control and CPT1aKD EC spheroids (n=3). f,g, Representative images of EC spheroids upon staining for TO-PRO3 in control (f) and CPT1aKD spheroids (g). h,i, Representative pictures of Hoechst/cleaved caspase 3-stained control (h) and CPT1aKD (i) ECs. j, Representative immunoblots, showing the ratio of phosphorylated (pATM) / total-ATM (ATM), p21 / Lamin and p53 / Lamin in control and CPT1aKD ECs. The ratios of the densitometrically quantified bands are shown below the blots (n=3; p=NS). Data are mean ± s.e.m of n independent experiments (a-e,j). Statistical test: mixed models. NS, not significant. ****p<0.0001.
Extended data Figure 3
Extended data Figure 3. FAO is used for de novo nucleotide synthesis
a, Schematic representation of the different carbon sources used for de novo synthesis of UMP. Note that palmitate contributes 3 carbons to the 9 carbons skeleton of UMP. PRPP: 5-phosphoribosyl-1-pyrophosphate. b, Sprout number upon 5-fluorouracil (5FU) treatment in control and CPT1aKD EC spheroids (n=4). c, Sprout number upon methotrexate (MTX) treatment in control and CPT1aKD EC spheroids (n=4). d, Sprout number upon acetate treatment in control and CPT1aKD EC spheroids (n=3). e-g, Representative images of EC spheroids upon acetate treatment. h,i, Rescue of the sprouting defect of CPT1aKD spheroids by acetate was not affected by oligomycin treatment; panel h: total sprout length; panel i: sprout numbers/spheroid (n=3; p=NS). j,k, Quantification of vessel sprouting using the EC spheroid model, showing that the reduction of total sprout length (j) and number of sprouts per spheroid (k) upon CPT1a silencing (CPT1aKD) was rescued by supplementation with a dNTP mix (n=3). l, Quantification of MitoC treated EC spheroid sprouting upon acetate or nucleoside mix supplementation (n=3; p=NS). m, Glucose oxidation in ECs, measured by 14CO2 formation from [6-14C]-glucose in control and CPT1aKD ECs (n=4). n, Glutamine oxidation in ECs, measured by 14CO2 formation from [U-14C]-glutamine in control and CPT1aKD ECs (n=4; p=NS). o, Total contribution of [U-13C]-glucose and [U-13C]-glutamine to aspartate in control and CPT1aKD ECs (n=3). p, [8-14C] hypoxanthine incorporation in RNA and DNA in control ECs (n=3). Data are mean ± s.e.m of n independent experiments (b-d,h-p). Statistical test: mixed models. NS, not significant. *p<0.05, **p<0.01, ****p<0.0001.
Extended data Figure 4
Extended data Figure 4. Etomoxir reduces vessel sprouting
a, FAO flux upon etomoxir (eto) treatment (n=6). b, [3H]-thymidine incorporation upon etomoxir treatment (n=5). c, Scratch wound assay using MitoC-treated ECs upon etomoxir (eto) treatment (n=4; p=NS). d, Branch point quantification in the retinal vasculature of control (ctrl) and etomoxir-treated (eto) pups (8 litter, n=24 pups for control and 16 for etomoxir treatment). e,f, Representative confocal images of retinal vessels stained for isolectin-B4 in control (e) and etomoxir (f) treated pups. g, Filopodia quantification in the retinal vasculature front of control and etomoxir (eto) treated pups (4 litters, n=11 for WT and 9 for etomoxir; p=NS). Data are mean ± s.e.m of n independent experiments (a-d,g) or the total number of mice (d,g). Statistical test: mixed models. NS, not significant. ****p<0.0001.
Extended data Figure 5
Extended data Figure 5. Analysis of steady state
Percentage M+2 or M+4 citrate and aspartate over different timepoints (24, 36, 48 and 52 hours) after labeling with [U-13C]-glucose (a), [U-13C]-glutamine (b), or [U-13C]-palmitate (c). Data are mean ± s.d. of n=3 independent experiments.
Figure 1
Figure 1. FAO stimulates vessel sprouting via EC proliferation
a,b, Representative images of control (ctrl) and CPT1aKD EC spheroids. c, Total sprout length in control and CPT1aKD EC spheroids treated with mitomycin C (MitoC) when indicated (n=3). d, [3H]-thymidine incorporation in DNA in control and CPT1aKD ECs (n=5). e,f, Representative images of MitoC-treated control and CPT1aKD EC spheroids. g, Number of MitoC-treated control and CPT1aKD ECs that traversed a Boyden chamber (n=4; p=NS). h, Scratch wound assay using MitoC-treated control and CPT1aKD ECs (n=4; p=NS). i, Lamellipodial area in control and CPT1aKD ECs (n=4; p=NS). Data are mean ± s.e.m. of n independent experiments. Statistical test: mixed models (c,d,g-i). NS, not significant. *p<0.05, ***p<0.001, ****p<0.0001.
Figure 2
Figure 2. CPT1a gene deletion in ECs causes vascular defects in vivo
a,b, Representative images of retinal vessels of wild-type (a) and CPT1aΔEC (b) mice. c,d, Branch point quantification in WT and CPT1aΔEC mice in the front (c) and rear (d) of the retinal vasculature (5 litters, n=11 pups for WT and CPT1aΔEC). e, Retinal vascular outgrowth in WT and CPT1aΔEC mice (6 litters, n=13 pups for WT and 18 for CPT1aΔEC). f,g, Representative images of the retina stained for isolectin-B4 (green) and collagen IV (red) in WT (f) and CPT1aΔEC mice (g). h, Quantification of isolectin-B4 collagen IV+ empty sleeves in WT and CPT1aΔEC pups (4 litters, n=8 pups for WT and 14 for CPT1aΔEC; p=NS). i,j, Representative images of retina stained for EdU (red) and isolectin-B4 (green) in WT (i) and CPT1aΔEC (j) mice. k, Quantification of EdU+ ECs in WT and CPT1aΔEC mice (3 litters, n=9 pups for WT and 6 for CPT1aΔEC). l, Quantification of filopodia in WT and CPT1aΔEC mice (6 litters, n=20 pups for WT and 16 for CPT1aΔEC; p=NS). m,n, Representative images of filopodia in WT (m) and CPT1aΔEC (n) mice. o,p, Representative images of the retinal vasculature of WT (o) and CPT1aΔEC mice (p) stained for isolectin-B4 (blue) and the pericyte marker NG2 (pink). Data are mean ± s.e.m. of n individual mice. Statistical test: mixed models (c-e,h,k,l). NS, not significant. *p < 0.05, **p<0.01, ***p<0.001.
Figure 3
Figure 3. CPT1a silencing does not cause ATP depletion or redox imbalance
a, Intracellular ATP levels in control and CPT1aKD ECs (n=4). b, Energy charge measurement in control and CPT1aKD ECs (n=3; p=NS). c, ATP coupled oxygen consumption rate (OCRATP) in control and CPT1aKD ECs (n=3). d, Total sprout length upon oligomycin (oligo) treatment in control and CPT1aKD EC spheroids (n=3). e, Intracellular ROS measurement in control and CPT1aKD ECs (n=6). f, Oxidized glutathione levels as percent of total glutathione, in control and CPT1aKD EC (n=3; p=NS). g, Total sprout length upon NAC treatment in control and CPT1aKD EC spheroids (n=3). Data are mean ± s.e.m of n independent experiments. Statistical test: mixed models (a-g). NS, not significant. *p<0.05, ***p<0.001, ****p<0.0001.
Figure 4
Figure 4. CPT1a silencing reduces TCA replenishment and FAO is used for nucleotide synthesis
a, Total contribution of [U-13C]-palmitate (palm), [U-13C]-glucose (glyc), and [U-13C]-glutamine (glut) to citrate (n=3). b,c, Total contribution of [U-13C]-palmitate (b) or [U-13C]-algal fatty acid (FA) mix (c) to citrate (cit), α-ketoglutarate (αKG), fumarate (fum), malate (mal), aspartate (asp), proline (prol), glutamate (glut) or asparagine (asn) in control and CPT1aKD ECs (n=7 for TCA intermediates and n=3-5 for amino acids in b; n=3 in c). d, Intracellular content of citrate (cit), glutamate (glut), aspartate (asp), glutamine (gln), isoleucine (ile), methionine (met), tyrosine (tyr), asparagine (asn), alanine (ala), glycine (gly), serine (ser), proline (pro), valine (val), leucine (leu) and phenylalanine (phe) in control and CPT1aKD ECs (n=8 for cit and asp, n=6 for glut, n=4 for asn and ser, n=5 for ala, gly, gln, pro, val, leu, ile, met, phe and tyr). e, De novo protein synthesis in control and CPT1aKD ECs (n=3; p=NS). f, [3H]-thymidine incorporation upon cycloheximide (CHX) treatment in control and CPT1aKD ECs (n=3). g, [U-14C]-palmitate incorporation into RNA in control and CPT1aKD ECs (n=5). h, De novo RNA synthesis in control and CPT1aKD ECs (n=3; p=NS). i, Intracellular levels of the rNTPs in control and CPT1aKD ECs (n=4; p=NS). AU: arbitrary units. j, [U-14C]-palmitate incorporation into DNA in control and CPT1aKD ECs (n=5). k,l, % M1 and M2 labeling from [U-13C]-palmitate in UMP (k) and UTP (l) in control and CPT1aKD ECs (n=5). m, Reduction of intracellular dNTP levels in CPT1aKD versus control ECs (n=5 for dATP and dCTP, n=4 for dTTP and dGTP). n,o, Total sprout length upon 5-fluorouracil (5FU) (n) or methotrexate (MTX) (o) treatment in control and CPT1aKD ECs (n=4). Data are mean ± s.e.m of n independent experiments. Statistical test: mixed models (a-o). NS, not significant. *p<0.05, **p<0.01, ***p<0.001, ****p<0.0001.
Figure 5
Figure 5. Acetate or nucleosides rescue the CPT1aKD sprouting defect
a, Intracellular aspartate levels upon acetate supplementation in control and CPT1aKD ECs (n=3). AU: arbitrary units. b, Intracellular levels of the indicated dNTPs upon acetate supplementation in control and CPT1aKD ECs (n=3). c,d, % M1 and M2 labeling from [U-13C]-acetate in UMP (c) and UTP (d) in control and CPT1aKD ECs (n=5; p=NS). e, Total sprout length upon acetate supplementation in control and CPT1aKD EC spheroids (n=3). f, Total sprout length upon nucleoside mix supplementation in control and CPT1aKD EC spheroids (n=4). g, Total contribution of [U-13C]-glucose and [U-13C]-glutamine to citrate in control and CPT1aKD ECs (n=3). h, % M+2 labeled citrate from [U-13C]-glucose in control and CPT1aKD ECs (n=3). i,j, % M+3 labeled malate (i) and aspartate (j) from [U-13C]-glucose in control and CPT1aKD ECs (n=3). Data are mean ± s.e.m of n independent experiments. Statistical test: mixed models (a-j). NS, not significant. ***p<0.001, ****p<0.0001.
Figure 6
Figure 6. Most other cell types do not use FA carbons for dNTP synthesis and inhibition of CPT1a impairs angiogenesis
a, Total contribution of [U-13C]-palmitate to citrate in various primary cells and cancer cell lines, expressed relative to the value in ECs (n=9 for ECs, n=8 for pericytes (per), n=6 for T cells, B16, A549 and 143B, n=5 for PancO2, n=4 for DU145, T47D and MDA, n=3 for fibroblasts (fib), ES cells, HCT, CT2A, U87 and MCF7). b, Contribution of [U-14C]-palmitate to DNA, expressed relative to the value in ECs (n=14 for ECs, n=6 for pericytes (per), n=5 for B16, Panco2 and A549, n=4 for fibroblasts (fib), T47D, 143B and T cells, n=3 for HCT, MDA, DU145, U87, CT2A, MCF7 and ES cells). c,d, Representative images of retinal flat-mounts of ROP mice treated with vehicle (c) or etomoxir (eto) (d). e, Vascular tuft area in control and etomoxir-treated pups (n=13 for WT and 9 for etomoxir). f, Mechanistic model. Top – control ECs: Uptake of palmitate and FAO in ECs are not essential for the production of ATP and NADPH (indicated in the shaded box), but fatty acid-derived carbons are incorporated in amino acids, and in precursors of rNTPs and dNTPs; how critically these pathways regulate EC proliferation cannot be assessed in control cells (denoted by question mark). Bottom – CPT1aKD ECs: Silencing of CPT1a reveals however that decreasing FAO depletes dNTP pools, without affecting rNTP and protein synthesis, implying that fatty acids are irreplaceable for DNA synthesis; since de novo synthesis of dNTPs is critical for DNA replication, CPT1a silencing impairs EC proliferation. Data are mean ± s.e.m of n independent experiments (a,b) or the total number of mice (of 4 litters) (e). Statistical test: two-sided t-test (a,b); mixed models (e). NS, not significant. *p<0.05, **p<0.01, ***p<0.001, ****p<0.0001.

Comment in

  • Metabolism: Growth in the fat lane.
    Egnatchik RA, DeBerardinis RJ. Egnatchik RA, et al. Nature. 2015 Apr 9;520(7546):165-6. doi: 10.1038/nature14375. Epub 2015 Apr 1. Nature. 2015. PMID: 25830890 No abstract available.

References

    1. Potente M, Gerhardt H, Carmeliet P. Basic and therapeutic aspects of angiogenesis. Cell. 2011;146:873–887. - PubMed
    1. Ausprunk DH, Folkman J. Migration and proliferation of endothelial cells in preformed and newly formed blood vessels during tumor angiogenesis. Microvasc Res. 1977;14:53–65. - PubMed
    1. Welti J, Loges S, Dimmeler S, Carmeliet P. Recent molecular discoveries in angiogenesis and antiangiogenic therapies in cancer. J Clin Invest. 2013;123:3190–3200. - PMC - PubMed
    1. De Bock K, et al. Role of PFKFB3-Driven Glycolysis in Vessel Sprouting. Cell. 2013;154:651–663. - PubMed
    1. De Bock K, Georgiadou M, Carmeliet P. Role of endothelial cell metabolism in vessel sprouting. Cell Metab. 2013;18:634–647. - PubMed

References unique to the Methods section

    1. Cheung EC, et al. TIGAR is required for efficient intestinal regeneration and tumorigenesis. Dev Cell. 2013;25:463–477. - PMC - PubMed
    1. Jaffe EA, Nachman RL, Becker CG, Minick CR. Culture of human endothelial cells derived from umbilical veins. Identification by morphologic and immunologic criteria. J Clin Invest. 1973;52:2745–2756. - PMC - PubMed
    1. Michieli P, et al. Targeting the tumor and its microenvironment by a dual-function decoy Met receptor. Cancer cell. 2004;6:61–73. - PubMed
    1. Carlotti F, et al. Lentiviral vectors efficiently transduce quiescent mature 3T3-L1 adipocytes. Mol Ther. 2004;9:209–217. - PubMed
    1. Geudens I, et al. Role of delta-like-4/Notch in the formation and wiring of the lymphatic network in zebrafish. Arterioscler Thromb Vasc Biol. 2010;30:1695–1702. - PMC - PubMed

Publication types

MeSH terms