. 2015 Apr 7;112(14):4429-34.
doi: 10.1073/pnas.1502967112. Epub 2015 Mar 23.

Regulatory vs. inflammatory cytokine T-cell responses to mutated insulin peptides in healthy and type 1 diabetic subjects

Affiliations

Regulatory vs. inflammatory cytokine T-cell responses to mutated insulin peptides in healthy and type 1 diabetic subjects

Maki Nakayama et al. Proc Natl Acad Sci U S A. .

Abstract

Certain class II MHC (MHCII) alleles in mice and humans confer risk for or protection from type 1 diabetes (T1D). Insulin is a major autoantigen in T1D, but how its peptides are presented to CD4 T cells by MHCII risk alleles has been controversial. In the mouse model of T1D, CD4 T cells respond to insulin B-chain peptide (B:9-23) mimotopes engineered to bind the mouse MHCII molecule, IA(g7), in an unfavorable position or register. Because of the similarities between IA(g7) and human HLA-DQ T1D risk alleles, we examined control and T1D subjects with these risk alleles for CD4 T-cell responses to the same natural B:9-23 peptide and mimotopes. A high proportion of new-onset T1D subjects mounted an inflammatory IFN-γ response much more frequently to one of the mimotope peptides than to the natural peptide. Surprisingly, the control subjects bearing an HLA-DQ risk allele also did. However, these control subjects, especially those with only one HLA-DQ risk allele, very frequently made an IL-10 response, a cytokine associated with regulatory T cells. T1D subjects with established disease also responded to the mimotope rather than the natural B:9-23 peptide in proliferation assays and the proliferating cells were highly enriched in certain T-cell receptor sequences. Our results suggest that the risk of T1D may be related to how an HLA-DQ genotype determines the balance of T-cell inflammatory vs. regulatory responses to insulin, having important implications for the use and monitoring of insulin-specific therapies to prevent diabetes onset.

Keywords: CD4 T cells; autoimmunity; diabetes; insulin; self-tolerance.


Conflict of interest statement

The authors declare no conflict of interest.

Figures

Fig. 1.
Fig. 1.
Strong IFN-γ responses to the insulin B22E mimotope in new-onset T1D and control subjects. PBMC IFN-γ ELISPOT results from (A) T1D and (B) control. DQβ57D−/− (red), DQβ57D+/− (blue), and DQβ57D+/+ (green) subjects are shown either without stimulation or with stimulation with (Left) WT B:9–23, (Center) the B22E mimotope, or (Right) the B21G,22E mimotope. In each case, freshly isolated PBMCs were cultured in the presence or absence of the peptide for 48 h, washed, and then transferred to an IFN-γ mAb-coated plate for overnight culture followed by development and enumeration of ELISPOTs. A control response to the Pentacel vaccine was also performed (Tables S3 and S4). The number of subjects in each DQβ57D category is shown. The geometric averages and SEs of the IFN-γ responses of the T1D (red) and control (blue) subjects, which were either (C) DQβ57D−/− or (D) DQβ57D+/−, are shown. Cntrl, control; no Ag, no antigen.
Fig. 2.
Fig. 2.
The IL-10 ELISPOT responses of the (A) T1D and (B) control subjects are presented. (C) A comparison of the IFN-γ with IL-10 ELISPOT responses of individual control subjects is shown colored as in A and B. The (D) IL-10 and (E) IFN-γ responses of the control DQβ57D−/− subjects compared with those that were either β57D+/− or β57D+/+. Colors are the same as in Fig. 1. No Ag, no antigen.
Fig. 3.
Fig. 3.
Proliferation of unfractionated PBMCs with insulin peptides from subjects with established T1D bearing two β57D DQ alleles. Unfractionated PBMCs were isolated from the patients listed in Table S2 and labeled with CFSE. They were cultured with no antigen, Pentacel, WT B:9–23, or the B22E mimotope without any other stimulus; then, after 7 d, they were analyzed by flow cytometry for CD4 T-cell CFSE fluorescence dilution as an indication of proliferation. (A) Representative data from two of the T1D subjects (1 and 2 from Table S2). (B) For all subjects, the percentage of CFSElo CD4 T cells after culture without antigen is shown vs. after culture with the B22E mimotope. (C) Same as B but comparing stimulation with the response to the WT B:9–23 peptide with that to the B22E mimotope. (D) The percentage of CFSElo CD4 T cells remaining for subject 5 in Table S2 (DQ8/8 homozygote) after blocking activation by the B22E mimotope by adding various concentrations of an anti-DQ antibody throughout the culture period. (E) Inhibition of the response to the B22E mimotope by six DQ8 subjects in Table S2.
Fig. 4.
Fig. 4.
Enrichment of particular TCRs in CFSElo CD4 T cells responding to the insulin B22E mimotope. As described in Materials and Methods and Table S5, the TCR repertoires of the CFSElo CD4 T cells proliferating in response to the B22E mimotope in Fig. 3 were compared with those of the CFSE+ CD4 T cells from the same subject cultured without antigen. We analyzed TCR-α and -β data from two subjects (2 and 4) and TCR-α data only from a third subject (1). The number of unique sequences occurring a particular number of times in the dataset vs. the cumulative contribution (%) of those sequences to the total unique sequences obtained is shown. Upper shows data for the proliferating CFSElo CD4 T cells (red), and Lower shows data for the total CFSE+ unstimulated cells (blue). Also shown (dotted lines) are the cumulative Poisson distribution curves predicted based on the average number of occurrences of unique sequences in the dataset.
Fig. 5.
Fig. 5.
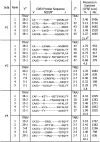
Analysis of frequent TCRs in B:9–23(B22E)-stimulated CD4 T cells. From five sets of TCR Vα and Vβ sequences from the B22E-stimulated CFSElo T cells described in Fig. 4 and Table S5, the five most frequent Vα and Vβ sequences are listed with their V and J genes identified and the protein sequence of the CDR3 loops shown. Also shown is the number of times that the sequence was found and its overall frequency (%) in the dataset. aThe immunogenetics nomenclature is used for V and J genes. bThe N(D)N portion of the CDR3 protein sequence was defined as any amino acid encoded by a codon containing at least one non-V/J germ-line gene. cPortion (%) of the entire dataset accounted for by five sequences.

Similar articles

Cited by

References

    1. Atkinson MA, Eisenbarth GS, Michels AW. Type 1 diabetes. Lancet. 2014;383(9911):69–82. - PMC - PubMed
    1. Harjutsalo V, Sjöberg L, Tuomilehto J. Time trends in the incidence of type 1 diabetes in Finnish children: A cohort study. Lancet. 2008;371(9626):1777–1782. - PubMed
    1. Patterson CC, Dahlquist GG, Gyürüs E, Green A, Soltész G. EURODIAB Study Group Incidence trends for childhood type 1 diabetes in Europe during 1989-2003 and predicted new cases 2005-20: A multicentre prospective registration study. Lancet. 2009;373(9680):2027–2033. - PubMed
    1. Ziegler AG, et al. Seroconversion to multiple islet autoantibodies and risk of progression to diabetes in children. JAMA. 2013;309(23):2473–2479. - PMC - PubMed
    1. Skyler JS. Diabetes Prevention Trial--Type 1 Diabetes Study Group Effects of insulin in relatives of patients with type 1 diabetes mellitus. N Engl J Med. 2002;346(22):1685–1691. - PubMed

Publication types

MeSH terms