. 2015 Apr 7;112(14):4280-5.
doi: 10.1073/pnas.1419799112. Epub 2015 Mar 23.

Sparse feature selection methods identify unexpected global cellular response to strontium-containing materials

Affiliations

Sparse feature selection methods identify unexpected global cellular response to strontium-containing materials

Hélène Autefage et al. Proc Natl Acad Sci U S A. .

Abstract

Despite the increasing sophistication of biomaterials design and functional characterization studies, little is known regarding cells' global response to biomaterials. Here, we combined nontargeted holistic biological and physical science techniques to evaluate how simple strontium ion incorporation within the well-described biomaterial 45S5 bioactive glass (BG) influences the global response of human mesenchymal stem cells. Our objective analyses of whole gene-expression profiles, confirmed by standard molecular biology techniques, revealed that strontium-substituted BG up-regulated the isoprenoid pathway, suggesting an influence on both sterol metabolite synthesis and protein prenylation processes. This up-regulation was accompanied by increases in cellular and membrane cholesterol and lipid raft contents as determined by Raman spectroscopy mapping and total internal reflection fluorescence microscopy analyses and by an increase in cellular content of phosphorylated myosin II light chain. Our unexpected findings of this strong metabolic pathway regulation as a response to biomaterial composition highlight the benefits of discovery-driven nonreductionist approaches to gain a deeper understanding of global cell-material interactions and suggest alternative research routes for evaluating biomaterials to improve their design.

Keywords: human mesenchymal stem cells; mevalonate pathway; microarray analysis; sparse feature selection analysis; strontium-releasing biomaterials.


Conflict of interest statement

Conflict of interest statement: M.M.S. is a coinventor on intellectual property on strontium-containing bioactive glasses (WO2007/144662).

Figures

Fig. 1.
Fig. 1.
Changes in hMSC global mRNA expression mediated by treatment with BG- and SrBG-conditioned media. (A) Venn diagram depicting the number of genes differentially expressed (with P < 0.05) in response to BG and SrBG exposure, compared with the CTL group. (B) Illustration of the operation of the EM algorithm, showing progressive setting to zero for the genes least relevant to the SrBG treatment to identify a small set of key genes (B, 1B, 4). (C) Table of the most significant discriminators identified by sparse feature analysis of the hMSC response to treatment with SrBG-conditioned medium. The contribution, expressed as mean ± SE, is an indication of that gene’s importance in the model discriminating the effect of the treatment conditions. Positive values indicate up-regulation in response to SrBG exposure. P values represent the Student’s t test confidence level for each gene’s contribution to the model. (D) Graphic representation of the functional annotation clustering analysis of the genes differentially expressed in response to Sr100 treatment compared with CTL treatment, highlighting a strong enrichment score of the sterol–steroid biosynthesis and metabolic processes.
Fig. 2.
Fig. 2.
Regulation of mRNA and protein expression of enzyme-coding genes from the mevalonate and steroid biosynthesis pathways by SrBG-conditioned media. (A) Expression profiles of selected genes representative of various stages of the mevalonate and sterol–steroid biosynthesis pathways, showing an increase of mRNA expression levels over time and with increasing amounts of strontium within the BG. Data were extracted from the microarray dataset. (B) HMGCS1, HMGCSR, FDPS, and SC4MOL mRNA expression, relative to t = 0, in hMSC after 5 d of culture in the presence of CTL or BG-conditioned media quantified by real-time PCR validating the results obtained by the microarray analysis. The 5-d exposure period was chosen based on microarray analyses, because hMSC displayed the strongest differential gene expression in response to the treatments at this time point. (C) Protein levels of HMGCS1, FDFT1, and GGPS1 normalized to DNA content and relative to the CTL group (dashed line) after 5 d of treatment measured by in-cell Western blotting. All data are expressed as mean ± SD, n = 3. In B and C, asterisks and daggers represent significant differences of the marked bars compared with the CTL group and compared with Sr100 treatment, respectively (*P < 0.05; **P < 0.01; ***P < 0.001; P < 0.05; ††P < 0.01). n.s., no significant differences between the SrBG groups and Sr0.
Fig. 3.
Fig. 3.
Raman spectroscopy mapping evidence of increased cholesterol and lipid content in hMSC treated with Sr100 medium. Raman spectroscopy mapping was performed on hMSC treated for 5 d with CTL, Sr0, or Sr100 medium. (A) Characteristic spectra identified by k-means cluster analysis of cell-distinctive signatures. Characteristic spectra were classified as nucleus (blue), cytoplasm (green), medium lipid/cholesterol content (yellow), and high lipid/cholesterol content (red). Arrowheads mark characteristic differences among spectra (see Fig. S4 for details). (B) Artificially colored representative images of characteristic spectra within cells. Colors correspond to the spectra assignment in A. (Scale bars, 10 µm.) (C) Quantification of the percentage of spectra per cell that are characteristic of lipid/cholesterol-rich regions (medium and high amounts), cytoplasm, or the nucleus. Data are expressed as mean ± SD, n = 4. *P < 0.05.
Fig. 4.
Fig. 4.
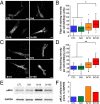
Increased cholesterol and lipid raft content at the cell membrane and cellular content of pMLC in response to SrBG treatment. (A and B) Representative TIRF images (A) and quantification of filipin III abundance (B) as a marker of nonesterified cholesterol content at the cell membrane of hMSC treated for 5 d with CTL, BG-, or SrBG-conditioned media. (C and D) Representative TIRF images (C) and quantification of CTB abundance (D) as a marker of lipid raft content at the cell membrane of hMSC treated for 5 d with CTL, BG-, or SrBG-conditioned media. (Scale bars, 10 µm.) In B and D data are presented as box plots and represent analysis of more than 30 cells per group. *P < 0.05, n = 3. (E and F) Representative Western blot (E) and densitometry quantification (F) of pMLC cellular content (relative to GAPDH) in hMSC after 5 d of treatment with BG- or SrBG-conditioned media. E and F are representative of three independent experiments.

References

    1. Place ES, Evans ND, Stevens MM. Complexity in biomaterials for tissue engineering. Nat Mater. 2009;8(6):457–470. - PubMed
    1. Pashuck ET, Stevens MM. Designing regenerative biomaterial therapies for the clinic. Sci Transl Med. 2012;4(160):160sr4. - PubMed
    1. Bose S, Fielding G, Tarafder S, Bandyopadhyay A. Understanding of dopant-induced osteogenesis and angiogenesis in calcium phosphate ceramics. Trends Biotechnol. 2013;31(10):594–605. - PMC - PubMed
    1. Meunier PJ, et al. The effects of strontium ranelate on the risk of vertebral fracture in women with postmenopausal osteoporosis. N Engl J Med. 2004;350(5):459–468. - PubMed
    1. Reginster JY, et al. Strontium ranelate reduces the risk of nonvertebral fractures in postmenopausal women with osteoporosis: Treatment of Peripheral Osteoporosis (TROPOS) study. J Clin Endocrinol Metab. 2005;90(5):2816–2822. - PubMed

Publication types

MeSH terms