. 2015 Apr 7;112(14):E1734-43.
doi: 10.1073/pnas.1424850112. Epub 2015 Mar 23.

Emergence of hematopoietic stem and progenitor cells involves a Chd1-dependent increase in total nascent transcription

Affiliations

Emergence of hematopoietic stem and progenitor cells involves a Chd1-dependent increase in total nascent transcription

Fong Ming Koh et al. Proc Natl Acad Sci U S A. .

Abstract

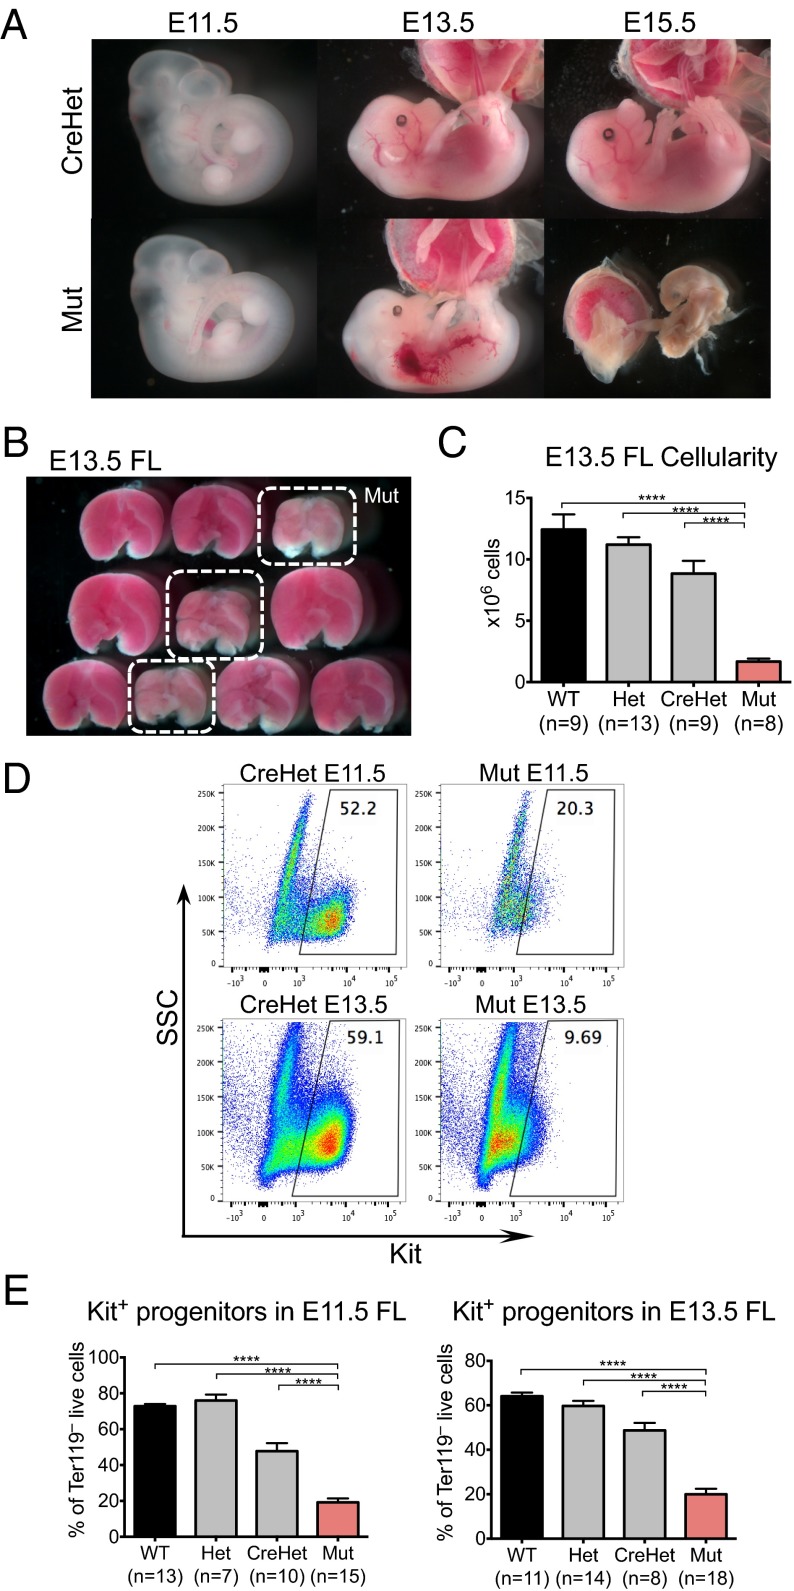
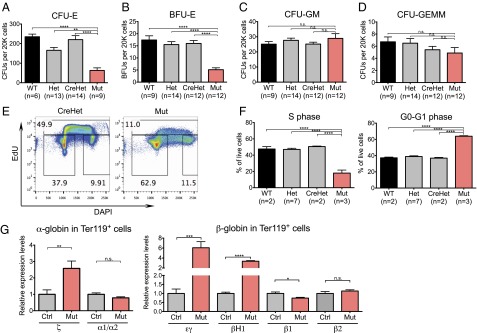
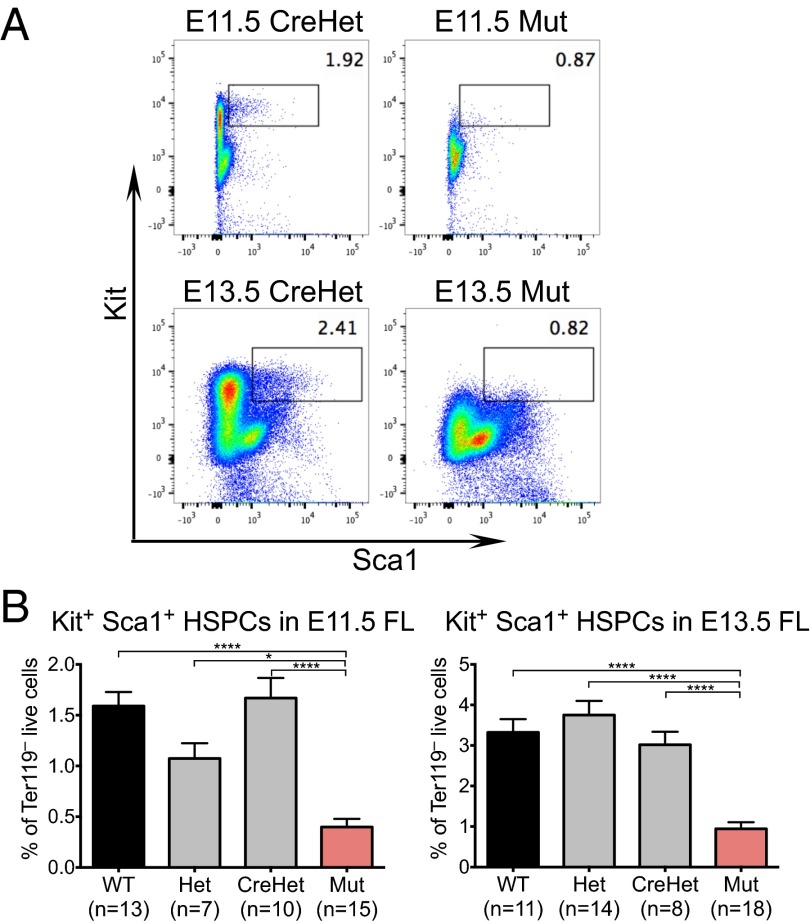
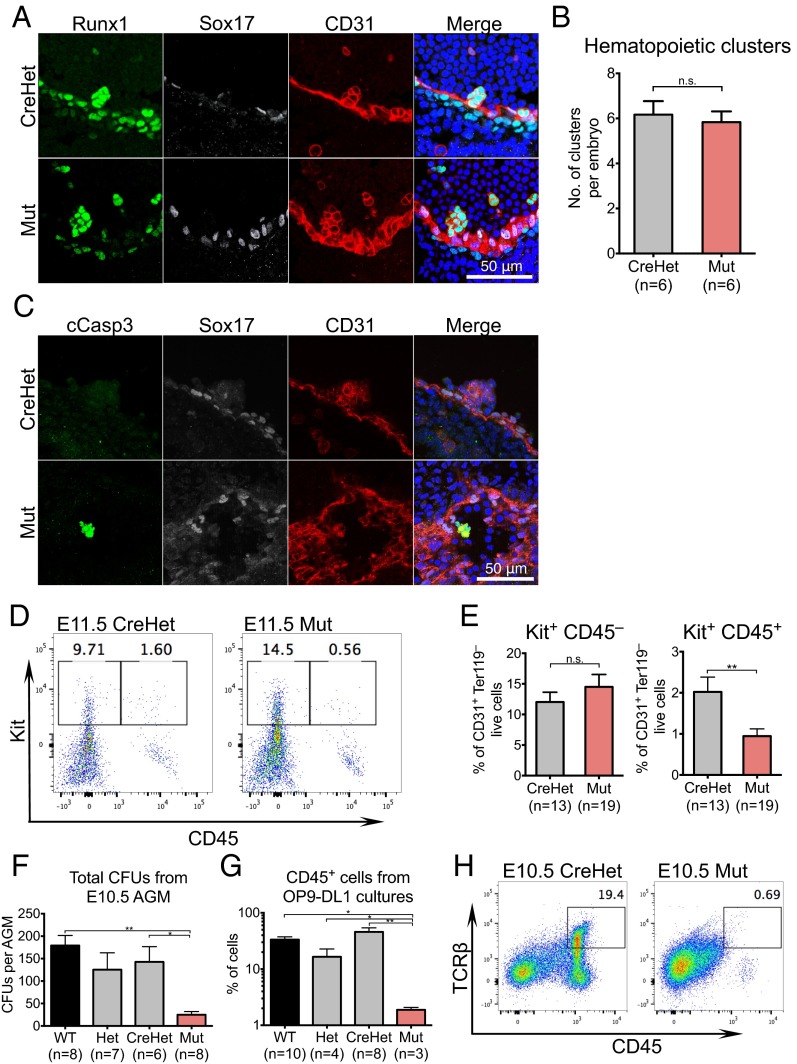
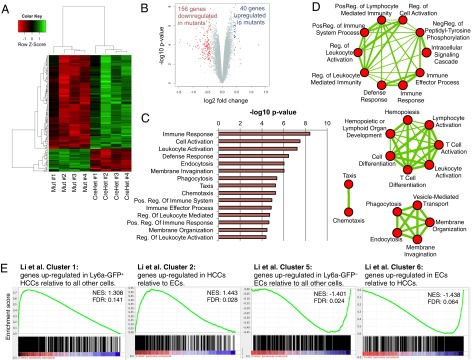
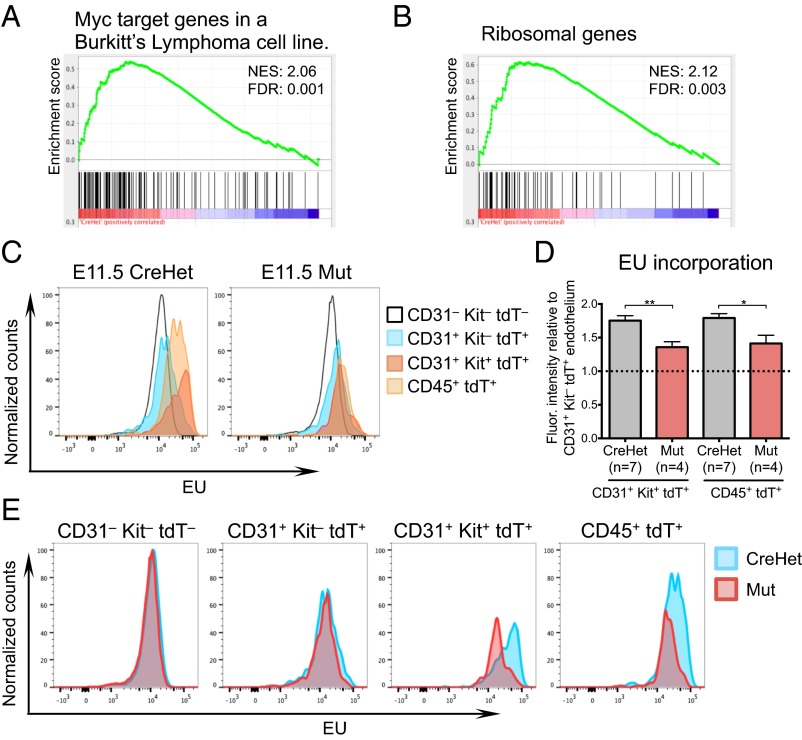
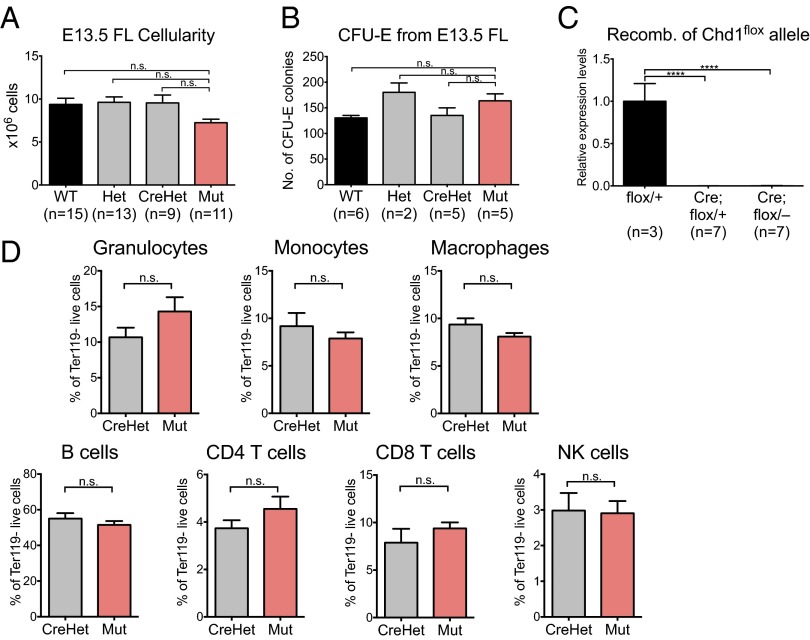
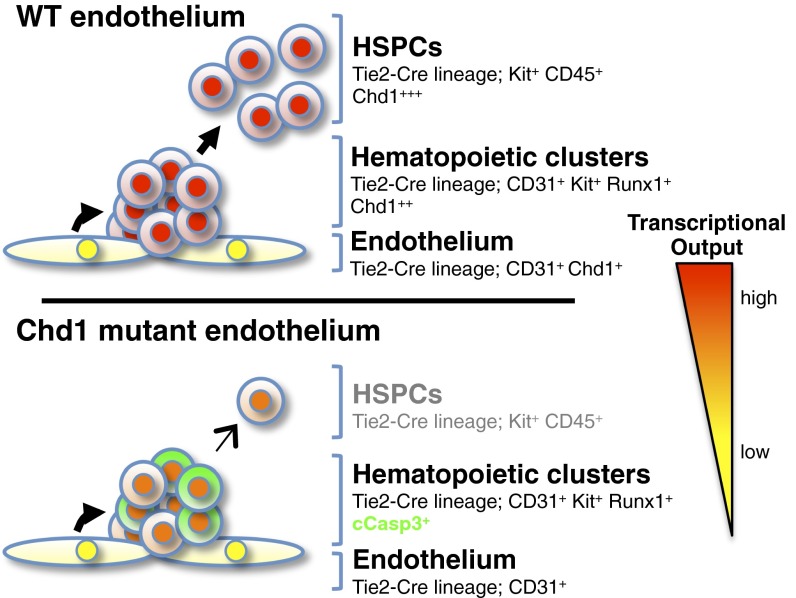
Lineage specification during development involves reprogramming of transcriptional states, but little is known about how this is regulated in vivo. The chromatin remodeler chomodomain helicase DNA-binding protein 1 (Chd1) promotes an elevated transcriptional output in mouse embryonic stem cells. Here we report that endothelial-specific deletion of Chd1 leads to loss of definitive hematopoietic progenitors, anemia, and lethality by embryonic day (E)15.5. Mutant embryos contain normal numbers of E10.5 intraaortic hematopoietic clusters that express Runx1 and Kit, but these clusters undergo apoptosis and fail to mature into blood lineages in vivo and in vitro. Hematopoietic progenitors emerging from the aorta have an elevated transcriptional output relative to structural endothelium, and this elevation is Chd1-dependent. In contrast, hematopoietic-specific deletion of Chd1 using Vav-Cre has no apparent phenotype. Our results reveal a new paradigm of regulation of a developmental transition by elevation of global transcriptional output that is critical for hemogenesis and may play roles in other contexts.

Keywords: Chd1; definitive hematopoiesis; endothelial-to-hematopoietic transition; hemogenic endothelium; transcription.


Conflict of interest statement

The authors declare no conflict of interest.

Figures

Fig. 1.
Fig. 1.
Deletion of Chd1 in the endothelium leads to fetal liver anemia and lethality at midgestation. (A) Representative images of CreHet control and mutant embryos at various embryonic stages. Mutant embryos appear normal at E11.5, but are pale and exhibit hemorrhage and edema by E13.5. Mutants are resorbed by E15.5. (B) Representative image showing dissected FLs from a litter of E13.5 embryos. The three mutant livers (circled in white) are paler and smaller compared with littermate controls. (C) E13.5 FLs from mutant embryos are significantly smaller than from controls. n = 5 litters. (D) Representative flow plots show that mutant FL contains fewer Kit+ progenitors at E11.5 and E13.5 compared with controls. (E) Quantification of Kit+ cells at both E11.5 and E13.5. E11.5: n = 7 litters. E13.5: n = 8 litters. Error bars indicate SEM. ****P ≤ 0.0001.
Fig. 2.
Fig. 2.
Failure of definitive erythropoiesis in Chd1 mutants. (A) CFU-E colony counts from 20,000 FL cells per E13.5 embryo seeded, in duplicates. n = 5 litters. (BD) BFU-E, CFU-GM, and CFU-GEMM colony counts from 20,000 FL cells per E13.5 embryo seeded, in duplicates. n = 6 litters. (E) Representative flow plots show reduced EdU incorporation in mutant FL at E13.5. (F) Quantification showing a strong reduction of cells in S phase and a corresponding increase of cells in G0-G1 phase in mutant FL. n = 2 litters. (G) qRT-PCR of sorted Ter119+ cells from E13.5 FLs shows an increase of primitive erythroid globins and a reduction of definitive erythroid globins. n = 8 control and 5 mutant embryos from three litters. Error bars indicate SEM. *P ≤ 0.05; **P ≤ 0.01; ***P ≤ 0.001; ****P ≤ 0.0001; n.s., not significant.
Fig. 3.
Fig. 3.
Chd1 mutant FLs are deficient in Ter119 Kit+ Sca1+ hematopoietic stem and progenitor cells. (A) Representative flow plots show a loss of Ter119 Kit+ Sca1+ cells in mutant E11.5 and E13.5 FLs. (B) Kit+ Sca1+ HSPCs are significantly reduced in mutant compared with control FL at both E11.5 and E13.5. E11.5: n = 7 litters. E13.5: n = 8 litters. Error bars indicate SEM. *P ≤ 0.05; ****P ≤ 0.0001.
Fig. 4.
Fig. 4.
Chd1 mutant AGM contains intraaortic hematopoietic clusters that do not mature to blood cells in vivo and in vitro. (A) Intraaortic clusters in the E10.5 AGM show proper expression of Runx1 and CD31 and the absence of arterial marker Sox17. (B) Mutant AGMs show similar numbers of hemogenic clusters compared with CreHets. n = 6 mutants and 6 CreHets from three litters. (C) Intraaortic clusters in mutant E10.5 AGMs stain positive for cleaved caspase 3 (cCasp3), a marker for apoptosis, which is not detected in clusters from CreHet AGMs. n = 3 mutants and 2 CreHet embryos. (D) Representative flow plots of Ter119 CD31+ cells show a loss of Kit+ CD45+ cells in E11.5 mutant AGMs. (E) CD31+ Ter119 cells from mutant E11.5 AGMs contain a comparable Kit+ CD45 population but show a significant reduction of Kit+ CD45+ cells compared with CreHets. n = 7 litters. (F) Total CFU counts from E10.5 AGM, in duplicates. n = 4 litters. (G) Mutant AGMs are highly defective in the generation of CD45+ cells when cocultured with OP9-DL1 stromal cells. n = 4 litters. (H) Representative flow plots show that mutant AGMs do not give rise to CD45+ TCRβ+ T cells when cocultured with OP9-DL1 stromal cells. Error bars indicate SEM. *P ≤ 0.05; **P ≤ 0.01; n.s., not significant.
Fig. 5.
Fig. 5.
Reduced expression of hematopoietic and growth genes in the E10.5 Chd1 mutant endothelium. (A and B) Microarray analysis comparing four biological replicates each of CreHet and mutant endothelium at E10.5 shows a mild misregulation of gene expression. A cutoff of P < 0.01 and | logFC | > 0.4 is depicted. (C) DAVID Gene ontology (GO) analysis shows that immune-related categories are significantly enriched in the set of genes down-regulated in Chd1 mutant endothelium. Similar results were obtained when all differentially expressed genes were used. (D) GO enrichment analysis shows that GO terms fall into four main clusters. The thickness of connecting lines represents the number of shared genes underpinning the two connected terms. (E) GSEA for gene clusters identified by Li et al. (42) as differentially expressed between hematopoietic cluster cells and endothelial cells shows that HCC up-regulated genes are preferentially decreased and EC up-regulated genes are preferentially increased in Chd1 mutant endothelium. FDR, false discovery rate; NES, net enrichment score.
Fig. 6.
Fig. 6.
Chd1 is required for elevated RNA transcription in the hemogenic endothelium. (A) GSEA for genes up-regulated by Myc and whose promoters are bound by MYC, via phylogenetic comparison and ChIP in P493 cells (61), reveals a preferential loss of Myc targets in Chd1 mutant endothelium. (B) GSEA for genes listed in the Kyoto Encyclopedia of Genes and Genomes (www.genome.jp/kegg) pathway for “ribosome” reveals a preferential down-regulation in Chd1 mutant endothelium. (C) Normalized histograms of EU incorporation reveal distinct levels of nascent transcriptional output between different subpopulations in E11.5 AGM. (D) Both CD31+ Kit+ and CD45+ cells incorporate higher levels of EU compared with CD31+ Kit endothelium in controls. This increase is significantly suppressed in mutant cells. Error bars indicate SEM. *P ≤ 0.05; **P ≤ 0.01. (E) Normalized histograms of EU incorporation reveal that mutant cells have levels of transcriptional output similar to controls in CD31+ Kit E11.5 AGM endothelium but are defective in the up-regulation of nascent RNA transcription in CD31+ Kit+ and CD45+ cells. Note that all cells in the EU incorporation analyses of CE are also tdTomato+, that is, derived from the Tie2-Cre–marked lineage, with the exception of CD31 Kit cells.
Fig. 7.
Fig. 7.
Hematopoietic-specific Chd1 mutants are viable and phenotypically normal. (A) Fetal livers from mutant embryos generated using Vav-Cre contain similar cell numbers as littermate controls. n = 6 litters. (B) CFU-E colony counts for mutant livers appear comparable to those from controls. n = 2 litters. (C) Intact Chd1flox allele is undetectable in the peripheral blood of Vav-Cre adult animals. (D) Peripheral blood from mutant mice and CreHet controls shows comparable blood populations at 1 y of age. n = 6 CreHet and 6 mutants from six litters. Error bars indicate SEM. ****P ≤ 0.0001; n.s., not significant.
Fig. 8.
Fig. 8.
Model for the role of Chd1 in transcriptional output and emergence of HSPCs. The expression of Chd1 and the levels of nascent transcriptional output are increased in hematopoietic progenitors relative to endothelium. Deletion of Chd1 from the endothelium allows the formation of hematopoietic clusters, but these have reduced levels of transcriptional output, fail to expand, and are lost by apoptosis. See text for details.

Similar articles

Cited by

References

    1. Cumano A, Godin I. Ontogeny of the hematopoietic system. Annu Rev Immunol. 2007;25:745–785. - PubMed
    1. Dzierzak E, Speck NA. Of lineage and legacy: The development of mammalian hematopoietic stem cells. Nat Immunol. 2008;9(2):129–136. - PMC - PubMed
    1. Palis J, Robertson S, Kennedy M, Wall C, Keller G. Development of erythroid and myeloid progenitors in the yolk sac and embryo proper of the mouse. Development. 1999;126(22):5073–5084. - PubMed
    1. Baron MH, Isern J, Fraser ST. The embryonic origins of erythropoiesis in mammals. Blood. 2012;119(21):4828–4837. - PMC - PubMed
    1. de Bruijn MFTR, et al. Hematopoietic stem cells localize to the endothelial cell layer in the midgestation mouse aorta. Immunity. 2002;16(5):673–683. - PubMed

Publication types

Associated data