

Non-native plants add to the British flora without negative consequences for native diversity
- PMID: 25831537
- PMCID: PMC4394281
- DOI: 10.1073/pnas.1423995112
Non-native plants add to the British flora without negative consequences for native diversity
Abstract
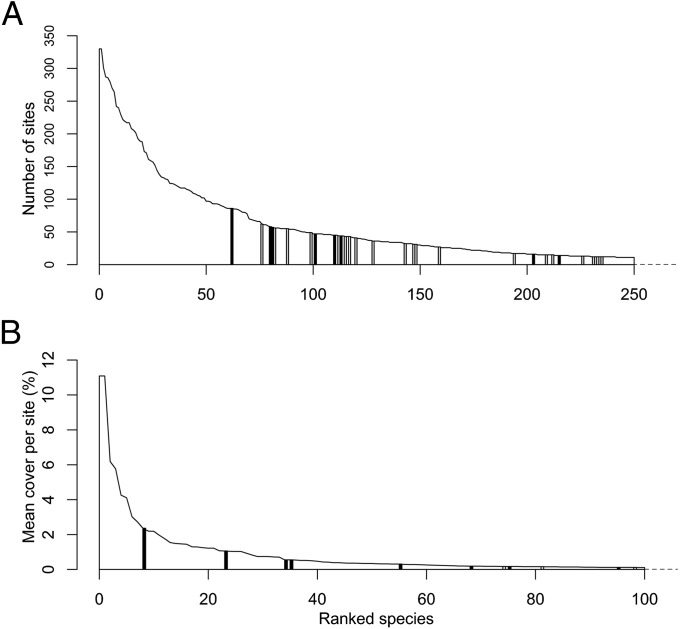
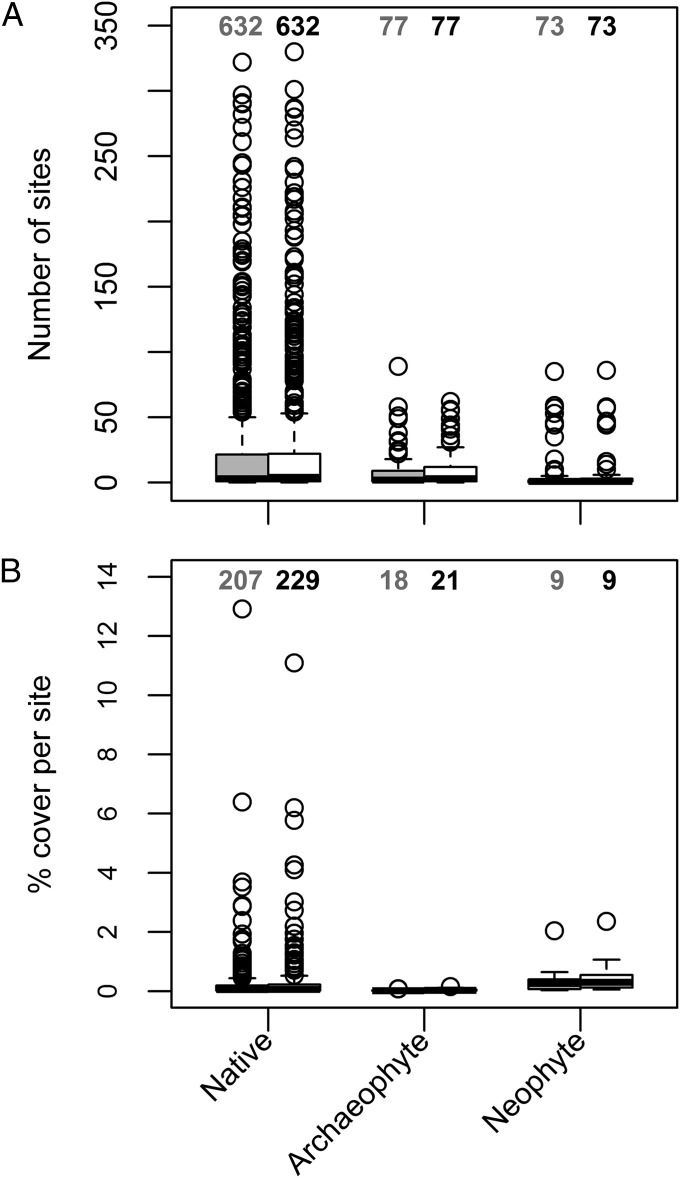
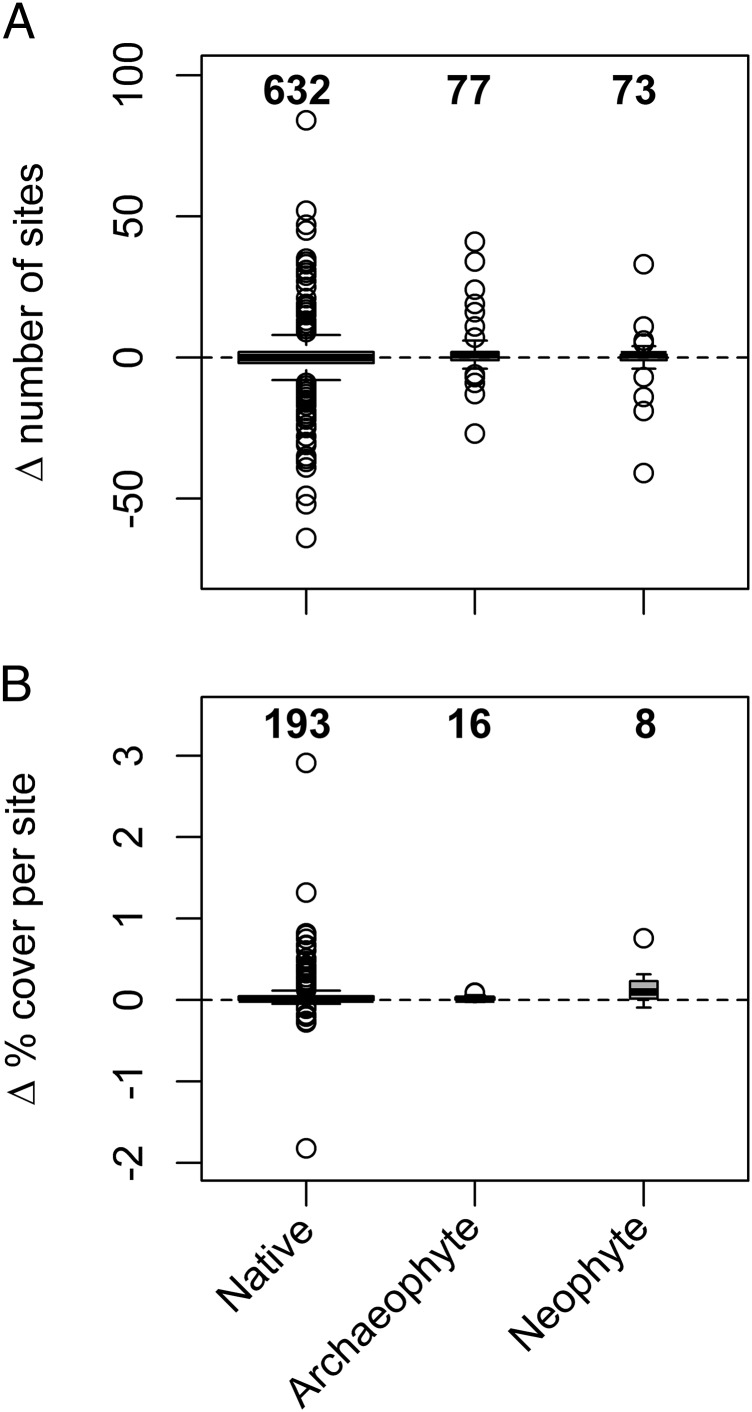
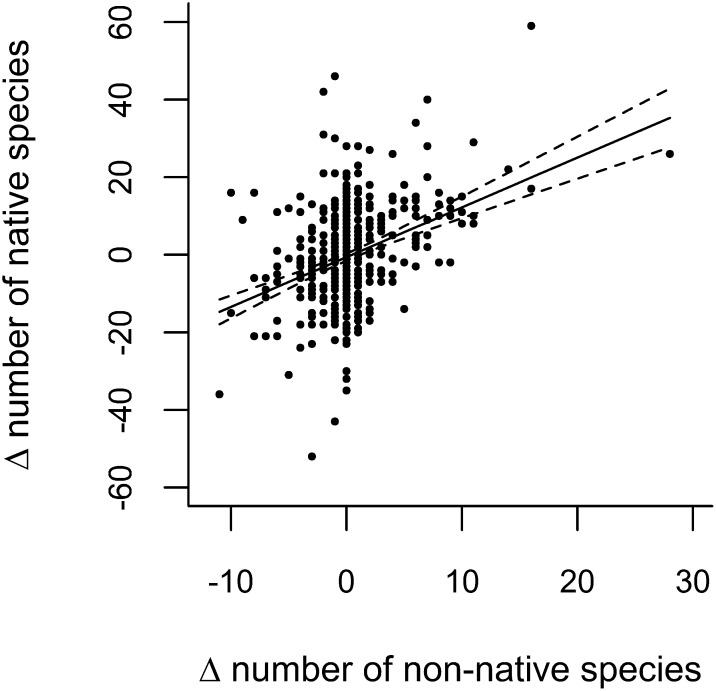
Plants are commonly listed as invasive species, presuming that they cause harm at both global and regional scales. Approximately 40% of all species listed as invasive within Britain are plants. However, invasive plants are rarely linked to the national or global extinction of native plant species. The possible explanation is that competitive exclusion takes place slowly and that invasive plants will eventually eliminate native species (the "time-to-exclusion hypothesis"). Using the extensive British Countryside Survey Data, we find that changes to plant occurrence and cover between 1990 and 2007 at 479 British sites do not differ between native and non-native plant species. More than 80% of the plant species that are widespread enough to be sampled are native species; hence, total cover changes have been dominated by native species (total cover increases by native species are more than nine times greater than those by non-native species). This implies that factors other than plant "invasions" are the key drivers of vegetation change. We also find that the diversity of native species is increasing in locations where the diversity of non-native species is increasing, suggesting that high diversities of native and non-native plant species are compatible with one another. We reject the time-to-exclusion hypothesis as the reason why extinctions have not been observed and suggest that non-native plant species are not a threat to floral diversity in Britain. Further research is needed in island-like environments, but we question whether it is appropriate that more than three-quarters of taxa listed globally as invasive species are plants.
Keywords: Anthropocene; biodiversity; botany; ecology; invasive species.
Conflict of interest statement
The authors declare no conflict of interest.
Figures
Comment in
-
Reply to Hulme et al.: Cover of non-native species is too low to adversely affect native plant diversity at a national scale.Proc Natl Acad Sci U S A. 2015 Jun 9;112(23):E2990. doi: 10.1073/pnas.1507966112. Epub 2015 Jun 1. Proc Natl Acad Sci U S A. 2015. PMID: 26034294 Free PMC article. No abstract available.
-
Challenging the view that invasive non-native plants are not a significant threat to the floristic diversity of Great Britain.Proc Natl Acad Sci U S A. 2015 Jun 9;112(23):E2988-9. doi: 10.1073/pnas.1506517112. Epub 2015 Jun 1. Proc Natl Acad Sci U S A. 2015. PMID: 26034295 Free PMC article. No abstract available.
References
-
- Global Invasive Species Database. Welcome to the Global Invasive Species Database. Available at www.issg.org/database/welcome/. Accessed September 11, 2014.
-
- Zhang Z-Q. Animal biodiversity: An outline of higher-level classification and survey of taxonomic richness. Zootaxa. 2011;3148:1–237. - PubMed
-
- Zhang Z-Q. Animal biodiversity: An outline of higher-level classification and survey of taxonomic richness (Addenda 2013) Zootaxa. 2013;3703:1–82. - PubMed
-
- Roy H, et al. Non-native species in Great Britain: Establishment, detection and reporting to inform effective decision making. Appendix 5. Defra; London: 2012.
Publication types
MeSH terms
LinkOut - more resources
Full Text Sources
Other Literature Sources
