. 2015 Apr 2:6:6773.
doi: 10.1038/ncomms7773.

Preference for concentric orientations in the mouse superior colliculus

Affiliations

Preference for concentric orientations in the mouse superior colliculus

Mehran Ahmadlou et al. Nat Commun. .

Abstract

The superior colliculus is a layered structure important for body- and gaze-orienting responses. Its superficial layer is, next to the lateral geniculate nucleus, the second major target of retinal ganglion axons and is retinotopically organized. Here we show that in the mouse there is also a precise organization of orientation preference. In columns perpendicular to the tectal surface, neurons respond to the same visual location and prefer gratings of the same orientation. Calcium imaging and extracellular recording revealed that the preferred grating varies with retinotopic location, and is oriented parallel to the concentric circle around the centre of vision through the receptive field. This implies that not all orientations are equally represented across the visual field. This makes the superior colliculus different from visual cortex and unsuitable for translation-invariant object recognition and suggests that visual stimuli might have different behavioural consequences depending on their retinotopic location.


Figures
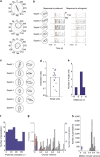
Figure 1
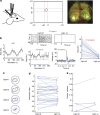
Figure 1. Vertical grouping of orientation preference in the superficial layer of the mouse superior colliculus.
(a) Examples of orientation and direction tuning. (b) Orientation tuning across different channels on a laminar electrode with 50 μm spacing. Right panels show raster plot of spikes around the onset of all trials to the preferred and orthogonal orientations. (c) Example penetrations with tungsten microelectrodes, depths are 50 μm apart. (d) Orientation selectivity index of 19 high waveform-amplitude single units from horizontal and vertical penetrations (9 mice). Bar indicates mean. (e) Difference of the preferred orientation of the 10 single units (5 mice) encountered on vertical penetrations to the mean preferred angle of all units on the penetration. (f) Histogram of the circular mean of the orientation preference for all 57 penetrations (14 mice). (g) Histogram of the circular variance of orientation preference in individual penetrations with a silicon probe (blue, n=20) or tungsten microelectrode (red, n=37), plotted on the probability distribution generated by shuffling all recorded preferences over all penetrations (grey). (h) Median circular variance for the real penetrations (arrow) lies far below medians for shuffled data.
Figure 2
Figure 2. Vertical grouping of orientation is independent of visual cortex.
(a) Two recording probes are placed in matching retinotopic positions in V1 and the sSC, whereas a LED-coupled fibre was placed above V1. The middle panel shows the ON-response fields for one V1 site (red) and sSC site (blue) during a simultaneous recording. The right panel is an example of expression by viral transfection imaged by fluorescent microscope. The red lines indicate the estimated outline of V1 based on stereotactic coordinates. (b) Responses of multi-units in sSC and layer 5 of binocular V1 in the injected area of an example experiment (left and middle-down left) and visual evoked potential in layer 5 of V1 (middle-down right) during light-off condition (black) and light-on conditions (blue) show that V1 L5 is silenced, while sSC remains active. Error bars in tuning curves are mean±s.e.m. Time 0 s is the onset of the visual stimulus. The light was turned on 1 s before this. The middle-top panel is the corresponding raster plot of spikes in V1 L5 when the light is off (left) and on (right). The right panel shows the effect of shining light on silencing all layers of V1 of 6 mice (n=29). (c) Example tuning curves from four depths in the sSC, separated by 50 μm, with V1 active (black) and silenced (blue). (d) Orientation tuning of units with V1 active (left) and silenced (right) is not changed (P=0.99, Wilcoxon signed rank sum test, n=33, 6 mice). (e) Circular variances of eight vertical penetrations in the sSC in light off (V1 active) and light on (V1 silenced) conditions is not significantly changed (P=0.31, Wilcoxon signed rank sum test, 6 mice).
Figure 3
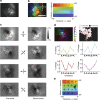
Figure 3. Orientation preference is dependent on retinotopic position.
(a) Image of GCaMP6 fluorescence in the sSC after neocortex has locally been aspirated. (b) Retinotopy in sSC. Each pixel is coloured corresponding to the monitor patch to which it gave most response. Pixel saturation scales linearly with response strength. Maximum ΔF/F was 8%. A smooth mesh was drawn over the boundaries of the monitor patch representations. This mesh was added to the other panels only as a visual aid. Scale bar is 1 mm. (c) The difference of the average response for each set of orientations and the average response to all orientations shows regional differences, which are very consistent for the first set of 10 (left) and next set of 10 presentations (right). (d) Left top panel shows polar map of sSC, where each pixel is coloured to its angular preference. Saturation scales linearly with response strength. Maximum ΔF/F was 7%. The map shows a smooth change covering all angles once. For the four indicated locations (each disk with a radius of 40 μm, covering area of 40 pixels) at different corners of the responding region, the response to all directions are shown at the bottom. Error bars in tuning curves are mean±s.e.m. Right top panel shows the significance of the preference of each sSC pixel for any of the four orientations. P-values of the white pixels are less than 0.05. (e) For each patch in the retinotopy of b, the preferred orientation is computed and shown on the equivalent part in visual space. This reveals a preference for concentric orientations.
Figure 4
Figure 4. Concentric orientation preferences.
(a) Retinotopic map of one example mouse captured by wide-field calcium imaging. The area inside the computed convex hull of the centre responses for all monitor patches is highlighted and used in the following analyses. (b,c) The retinotopic map of a recomputed in azimuth and elevation coordinates, respectively. (d) Map of the concentric angle (that is, the angle orthogonal to the radial angle for the centre of vision) reconstructed based on b and c. (e) The corresponding imaged orientation map. (f) Preferred orientation of the pixels of orientation maps versus the concentric angles computed from the retinotopy for all mice (n=7). (g) Histogram of angular difference between preferred orientation and computed concentric angles of the pixels (7 mice). (h) Preferred orientation of penetrations (n=21, 3 mice), obtained by extracellular recordings, shown at the corresponding receptive field positions. Different colours indicate different mice. (i) Concentric angles at receptive fields relative to the nose versus the corresponding preferred orientations based on the data shown in h. Different colours indicate different mice. (j) Histogram of angular difference between preferred orientation and concentric angles of units shown in h and i.
Figure 5
Figure 5. Columns are organized by orientation not by direction.
(a) Example penetration with tuning for drifting gratings, static gratings and moving dots. For static gratings, the results for any direction and its opposite are the same, and presented only for comparison. (b) Orientation selectivity for static and drifting gratings is similar (P=0.24, t-test, drifting n=28 multi-units, static n=26, 5 mice) and is lower for moving dots (P=0.01 for static, P=0.046 for drifting, dots n=25). Error bars are mean±s.e.m. (c) Mean responses during stimulus presentation are highest for drifting gratings, and similar for static gratings and move dot displays (P<0.01 for moving dots compared to drifting and static gratings). (d) Histogram of circular variance of preferred orientation of each unit over different phases of static gratings (n=5 multi-units, 2 mice; left) and firing rate of an example unit over different angles of the static gratings with three different phases. (e) Orientation preference for drifting and static gratings is similar (n=26, 5 mice). Size of the dots indicates the number of the units with the same preferred orientation. (f) Orientation preference for drifting gratings and moving dots is different (n=25 multi-units, 5 mice). (g) Direction-selective units (DSI>0.5, left hemisphere) prefer upward motion (P<10−5, Rayleigh test for circular non-uniformity, n=72, 6 mice).

References

    1. Hubel D. H. & Wiesel T. N. Ferrier lecture. Functional architecture of macaque monkey visual cortex. Proc. R. Soc. Lond. B Biol. Sci. 198, 1–59 (1977) . - PubMed
    1. Ohki K., Chung S., Ch'ng Y. H., Kara P. & Reid R. C. Functional imaging with cellular resolution reveals precise micro-architecture in visual cortex. Nature 433, 597–603 (2005) . - PubMed
    1. Van Hooser S. D., Heimel J. A., Chung S., Nelson S. B. & Toth L. J. Orientation selectivity without orientation maps in visual cortex of a highly visual mammal. J. Neurosci. 25, 19–28 (2005) . - PMC - PubMed
    1. Hofbauer A. & Dräger U. C. Depth segregation of retinal ganglion cells projecting to mouse superior colliculus. J. Comp. Neurol. 234, 465–474 (1985) . - PubMed
    1. Dräger U. C. & Hubel D. H. Physiology of visual cells in mouse superior colliculus and correlation with somatosensory and auditory input. Nature 253, 203–204 (1975) . - PubMed

Publication types

LinkOut - more resources