

Age and sex effects on corpus callosum morphology across the lifespan
- PMID: 25833103
- PMCID: PMC4478157
- DOI: 10.1002/hbm.22800
Age and sex effects on corpus callosum morphology across the lifespan
Abstract
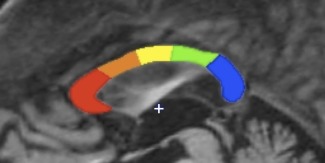
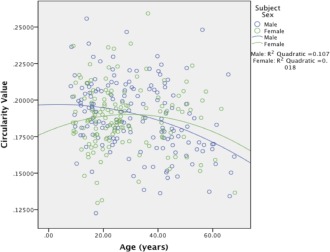
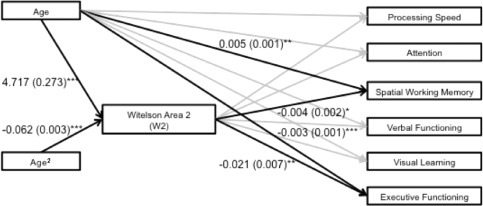
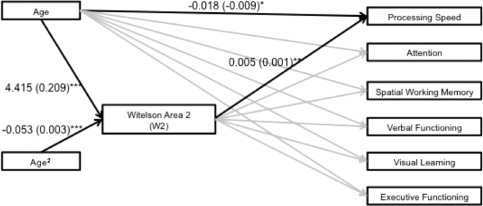
The corpus callosum (CC) is the largest interhemispheric white matter tract in the human brain, and is characterized by pronounced differences in morphology among individuals. There are limited data, however, regarding typical development, sex differences, and the neuropsychological correlates of individual differences within CC subregions. Magnetic resonance (MR) imaging exams were collected in a large cohort (N = 305) of healthy individuals (ages 8-68). We used a highly reliable program to automatically identify the midsagittal plane and obtain CC subregion measures according to approaches described by Witelson [1989]: Brain 112:799-835 and Hampel et al. [1998]: Arch Neurol 55:193-198 and a measure of whole CC shape (i.e., circularity). CC measurement parameters, including area, perimeter, length, circularity, and CC subregion area values were generally characterized by inverted U-shaped curves across the observed age range. Peak values for CC subregions were observed between ages 32 and 45, and descriptive linear correlations were consistent with sharper area changes in development. We also observed differing age-associated changes across the lifespan between males and females in the CC subregion corresponding to the genu (Witelson's subregion 2), as well as CC circularity. Mediation analysis using path modeling indicated that genu area mediated the relationship between age and processing speed for females, and the relationship between age and visual learning and executive functioning for males. Taken together, our findings implicate sex differences in CC morphology across the lifespan that are localized to the genu, which appear to mediate neuropsychological functions.
Keywords: corpus callosum; lifespan; neuropsychological functioning; sex differences.
© 2015 Wiley Periodicals, Inc.
Figures


References
-
- Aboitiz F, Scheibel AB, Fisher RS, Zaidel E (1992): Fiber composition of the human corpus callosum. Brain Res 598:143–153. - PubMed
-
- Ardekani BA (2011): Brainwash module of the Automatic Registration Toolbox (ART). Available at: http://www.nitrc.org/projects/art. Last Accessed May 1, 2014
-
- Ardekani BA (2013): Yuki module of the Automatic Registration Toolbox (ART) for corpus callosum segmentation. Available at: http://www.nitrc.org/projects/art. Last Accessed May 1, 2014.
-
- Ardekani BA, Kershaw J, Braun M, Kanno I (1997): Automatic detection of the mid‐sagittal plane in 3‐D brain images. IEEE Trans Med Imaging 16:947–952. - PubMed
Publication types
MeSH terms
Grants and funding
LinkOut - more resources
Full Text Sources
Other Literature Sources
