. 2015 Apr 2:6:6701.
doi: 10.1038/ncomms7701.

Encoding and decoding spatio-temporal information for super-resolution microscopy

Affiliations

Encoding and decoding spatio-temporal information for super-resolution microscopy

Luca Lanzanò et al. Nat Commun. .

Abstract

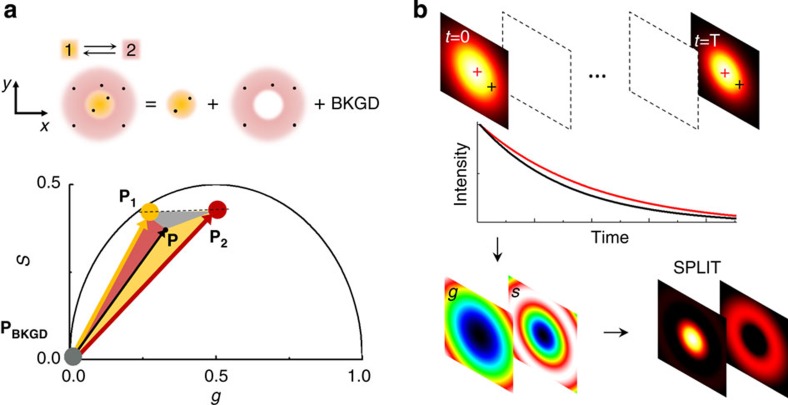
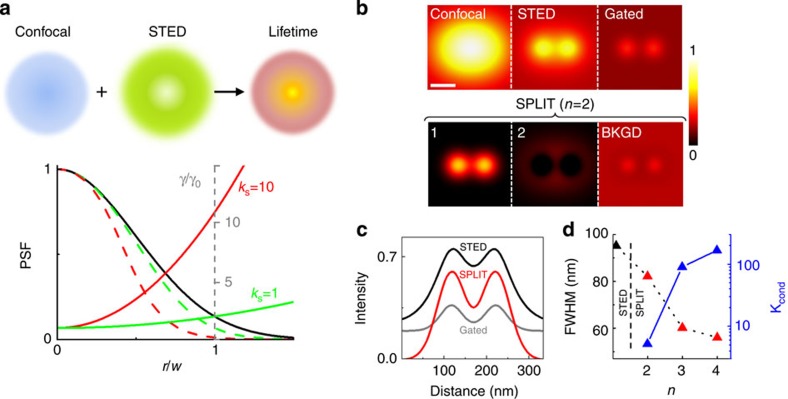
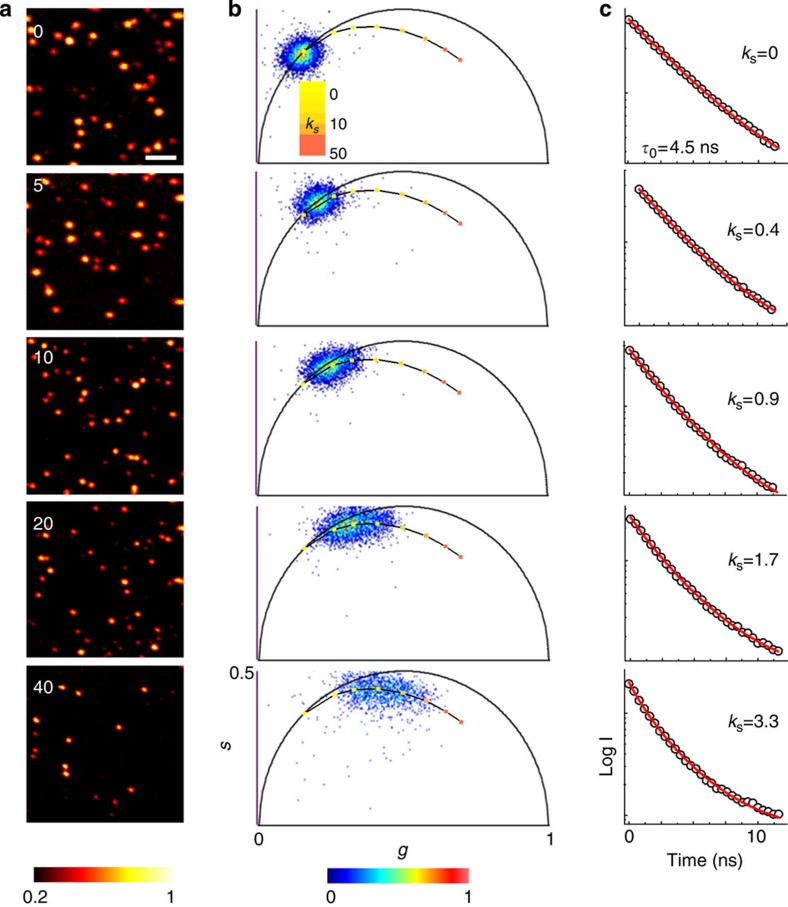
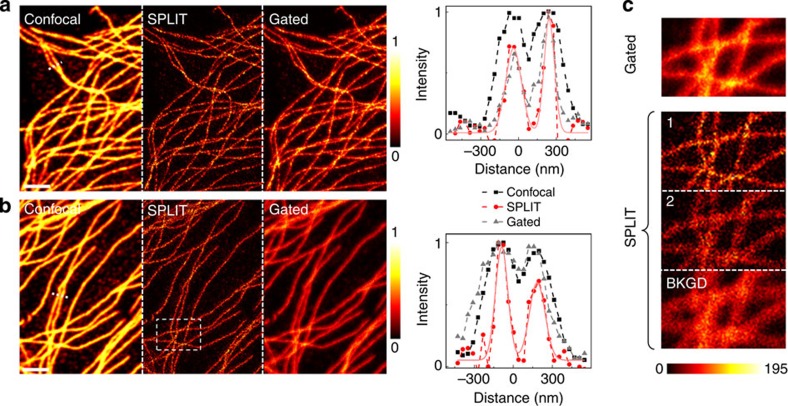
The challenge of increasing the spatial resolution of an optical microscope beyond the diffraction limit can be reduced to a spectroscopy task by proper manipulation of the molecular states. The nanoscale spatial distribution of the molecules inside the detection volume of a scanning microscope can be encoded within the fluorescence dynamics and decoded by resolving the signal into its dynamics components. Here we present a robust and general method to decode this information using phasor analysis. As an example of the application of this method, we optically generate spatially controlled gradients in the fluorescence lifetime by stimulated emission. Spatial resolution can be increased indefinitely by increasing the number of resolved dynamics components up to a maximum determined by the amount of noise. We demonstrate that the proposed method provides nanoscale imaging of subcellular structures, opening new routes in super-resolution microscopy based on the encoding/decoding of spatial information through manipulation of molecular dynamics.


Figures

Figure 1
Figure 1. Schematic principle of the SPLIT method.
(a) It is assumed that the photons are emitted within the DL-PSF with a different dynamics (1 or 2) according to the emitter position. The goal is to separate the photons emitted from 1, those emitted from 2 and those with no temporal dynamics (uncorrelated background, BKGD). This is obtained in the phasor plot expressing the experimental phasor P as a linear combination of the phasors P1 and P2 plus the phasor of the background (PBKGD). (b) Schematic of the image formation process in SPLIT. The SPLIT method uses the temporal information of the signal at each pixel to generate a set of g and s images. These images are then processed to obtain the final SPLIT image.
Figure 2
Figure 2. The SPLIT method in time-resolved CW-STED.
(a) A doughnut-shaped STED beam overlapped with a confocal spot generates a continuous distribution of dynamics within the DL-PSF. The STED beam intensity determines the relative variation of decay rate γ/γ0 (solid green (kS=1) and red (kS=10) line) within a Gaussian DL-PSF (solid black line) or the corresponding E-PSF (dashed green (kS=1) and red (kS=10) line). (b,c) Simulated average time-resolved confocal and STED images of two point-like particles plus a uniform level of uncorrelated background (confocal FWHM=200 nm, particles distance=104 nm, kS=10, τ0=2.5 ns, S=105, B=104) and horizontal profile. In the time-gated STED image (Tg=τ0) the signal becomes very low compared with the background level. In the SPLIT series, the photons of the super-resolved component 1 are efficiently separated from component 2 and from the background. The colourmap represents the simulated intensity normalized to the maximum value of the confocal image. Scale bar, 100 nm. (d) Resolution and noise propagation in the SPLIT method versus the number of components. Resolution and noise are quantified, respectively, as the FWHM of the SPLIT E-PSF and the condition number kcond obtained for kS=10 (FWHM of the STED E-PSF is shown for comparison as the first point).
Figure 3
Figure 3. STED phasors and average dynamics at different STED powers.
(a) Time-resolved STED images of 40 nm yellow–green fluorescent beads at several STED beam powers. Numbers indicate STED beam power in mW (measured at the back aperture of the objective lens). The colourmap in a represents the time-integrated intensity detected at one pixel normalized to the maximum value of each image (threshold set to 20% of the maximum value). (b,c) Phasor plots (b) and average time-resolved decays (c) associated to the images in a. Increasing STED powers induce an increasing spread of the phasor and an increasing stretching of the average decay from an exponential (kS=0, τ0=4.5 ns) into the trend described by equation (3) with kS>0. This equation describes a trajectory in the phasor plot for increasing values of kS (solid line), which overlaps with experimental phasor. The values of kS obtained from the fit of the average decay scale linearly with the STED beam power. Scale bar, 1 μm.
Figure 4
Figure 4. Application of the SPLIT method to biological imaging.
(a,b) Microtubules in fixed HeLa cells labelled by immunocytochemistry with the organic dyes Alexa Fluor 488 (a) and Oregon Green 488 (b). Shown are the confocal image, the SPLIT (n=2, first component) image, the time-gated image (Tg=1 ns) and the intensity profile along the dashed line. The colourmap represents the fluorescence intensity normalized to the maximum value of each image. (c) The time-gated image is compared with the full SPLIT series (n=2) for the region highlighted in b. The colourmap represents the fluorescence intensity expressed in counts per 0.1 ms. The STED beam power (measured at the back aperture of the objective lens) was PSTED=40 mW. Scale bars, 2 μm.

References

    1. Hell S. W. Toward fluorescence nanoscopy. Nat. Biotechnol. 21, 1347–1355 (2003) . - PubMed
    1. Hell S. W. Microscopy and its focal switch. Nat. Methods 6, 24–32 (2009) . - PubMed
    1. Huang B., Babcock H. & Zhuang X. Breaking the diffraction barrier: super-resolution imaging of cells. Cell 143, 1047–1058 (2010) . - PMC - PubMed
    1. Schwartz O. et al. Superresolution microscopy with quantum emitters. Nano Lett. 13, 5832–5836 (2013) . - PubMed
    1. Betzig E. & Trautman J. K. Near-field optics: microscopy, spectroscopy, and surface modification beyond the diffraction limit. Science 257, 189–195 (1992) . - PubMed

Publication types