. 2015 May 7;282(1806):20150347.
doi: 10.1098/rspb.2015.0347.

Avoidable errors in the modelling of outbreaks of emerging pathogens, with special reference to Ebola

Affiliations

Avoidable errors in the modelling of outbreaks of emerging pathogens, with special reference to Ebola

Aaron A King et al. Proc Biol Sci. .

Abstract

As an emergent infectious disease outbreak unfolds, public health response is reliant on information on key epidemiological quantities, such as transmission potential and serial interval. Increasingly, transmission models fit to incidence data are used to estimate these parameters and guide policy. Some widely used modelling practices lead to potentially large errors in parameter estimates and, consequently, errors in model-based forecasts. Even more worryingly, in such situations, confidence in parameter estimates and forecasts can itself be far overestimated, leading to the potential for large errors that mask their own presence. Fortunately, straightforward and computationally inexpensive alternatives exist that avoid these problems. Here, we first use a simulation study to demonstrate potential pitfalls of the standard practice of fitting deterministic models to cumulative incidence data. Next, we demonstrate an alternative based on stochastic models fit to raw data from an early phase of 2014 West Africa Ebola virus disease outbreak. We show not only that bias is thereby reduced, but that uncertainty in estimates and forecasts is better quantified and that, critically, lack of model fit is more readily diagnosed. We conclude with a short list of principles to guide the modelling response to future infectious disease outbreaks.

Keywords: Ebola virus disease; emerging infectious disease; forecast.


Figures

Figure 1.
Figure 1.
Results from simulation study fitting deterministic models to stochastically simulated data. Five hundred simulated datasets of length 39 weeks were generated by the stochastic model described in §5 at each of three levels of the measurement error overdispersion parameter, k. The deterministic model was fit to both raw (blue) and accumulated (red) incidence data. (a) Estimates of R0. True value used in generating the data is shown by the dashed line. (b) Estimates of error overdispersion, k. (c) Widths of nominal 99% profile-likelihood confidence intervals (CI) for R0. (d) Actual coverage of the CI, i.e. probability that the true value of R0 lay within the CI. Ideally, actual coverage would agree with nominal coverage (99%, dashed line).
Figure 2.
Figure 2.
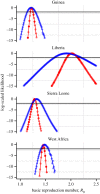
Likelihood profiles for R0 based on the stochastic model fit to raw data (blue) versus the deterministic model fit to cumulative incidence data (red). Each point represents the maximized log likelihood at each fixed value of R0 relative to overall maximum. The maximum of each curve is achieved at the maximum-likelihood estimate (MLE) of R0; the curvature is proportional to estimated precision. The horizontal line indicates the critical value of the likelihood ratio at the 95% CI. While the (improper) use of cumulative data produces relatively small differences in the MLE for R0, it does produce the illusion of high precision.
Figure 3.
Figure 3.
Model diagnostics. The time series plots show the data (blue) superimposed on 10 typical simulations from the fitted model (grey). While the overall trend is captured by the model, the simulations display more high-frequency (week-to-week) variability than does the data. The insets confirm this, showing the autocorrelation function at lag 1 week (ACF(1)) in the data (blue) superimposed on the distribution of ACF(1) in 500 simulations (grey). For Guinea, Liberia and the aggregated regional data (‘West Africa’), the ACF(1) of the data lies in the extreme right tail of the distribution, as quantified by the one-sided p-values shown.
Figure 4.
Figure 4.
Four consecutive days of Ebola incidence in the republics of Liberia and Sierra Leone. In the outbreak's early stages, the spatio–temporal dynamics are highly erratic, contrary to the predictions of the well-mixed model. (Online version in colour.)
Figure 5.
Figure 5.
Forecast uncertainty for the Sierra Leone EBVD outbreak as a function of the model used and the data to which the model was fit. The red ribbon shows the median and 95% envelope of model simulations for the deterministic SEIR model fit to cumulative case reports; the blue ribbon shows the corresponding forecast envelope for the stochastic model fit to raw incidence data. The data used in model fitting are shown using black triangles.
Figure 6.
Figure 6.
Schematic diagram of the transmission models used. λ(t) = R0γI(t)/N is the force of infection (i.e. the per-susceptible rate of infection). See §5(b) for explanation.

References

    1. Anderson RM, et al. 1996. Transmission dynamics and epidemiology of BSE in British cattle. Nature 382, 779–788. (10.1038/382779a0) - DOI - PubMed
    1. Ferguson NM, Donnelly CA, Anderson RM. 2001. Transmission intensity and impact of control policies on the foot and mouth epidemic in Great Britain (vol. 413, pg. 542, 2001). Nature 414, 329 (10.1038/35104594) - DOI - PubMed
    1. Keeling MJ, et al. 2001. Dynamics of the 2001 UK foot and mouth epidemic: stochastic dispersal in a heterogeneous landscape. Science 294, 813–817. (10.1126/science.1065973) - DOI - PubMed
    1. Lipsitch M, et al. 2003. Transmission dynamics and control of severe acute respiratory syndrome. Science 300, 1966–1970. (10.1126/science.1086616) - DOI - PMC - PubMed
    1. Riley S, Donnelly CA, Ferguson NM. 2003. Robust parameter estimation techniques for stochastic within-host macroparasite models. J. Theor. Biol. 225, 419–430. (10.1016/S0022-5193(03)00266-2) - DOI - PubMed

Publication types

MeSH terms

LinkOut - more resources