. 2015 May 7;125(19):2937-47.
doi: 10.1182/blood-2014-09-599266. Epub 2015 Apr 1.

Synergy between rapamycin and FLT3 ligand enhances plasmacytoid dendritic cell-dependent induction of CD4+CD25+FoxP3+ Treg

Affiliations

Synergy between rapamycin and FLT3 ligand enhances plasmacytoid dendritic cell-dependent induction of CD4+CD25+FoxP3+ Treg

Moanaro Biswas et al. Blood. .

Abstract

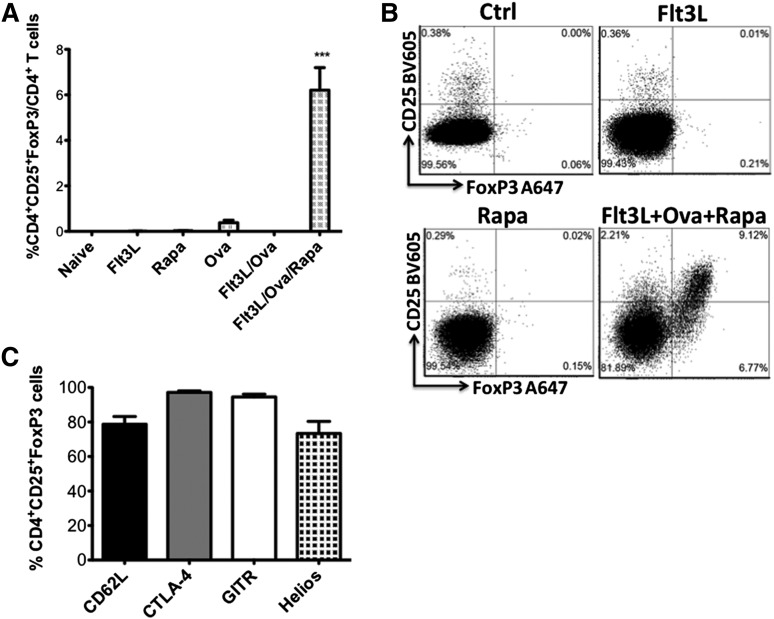
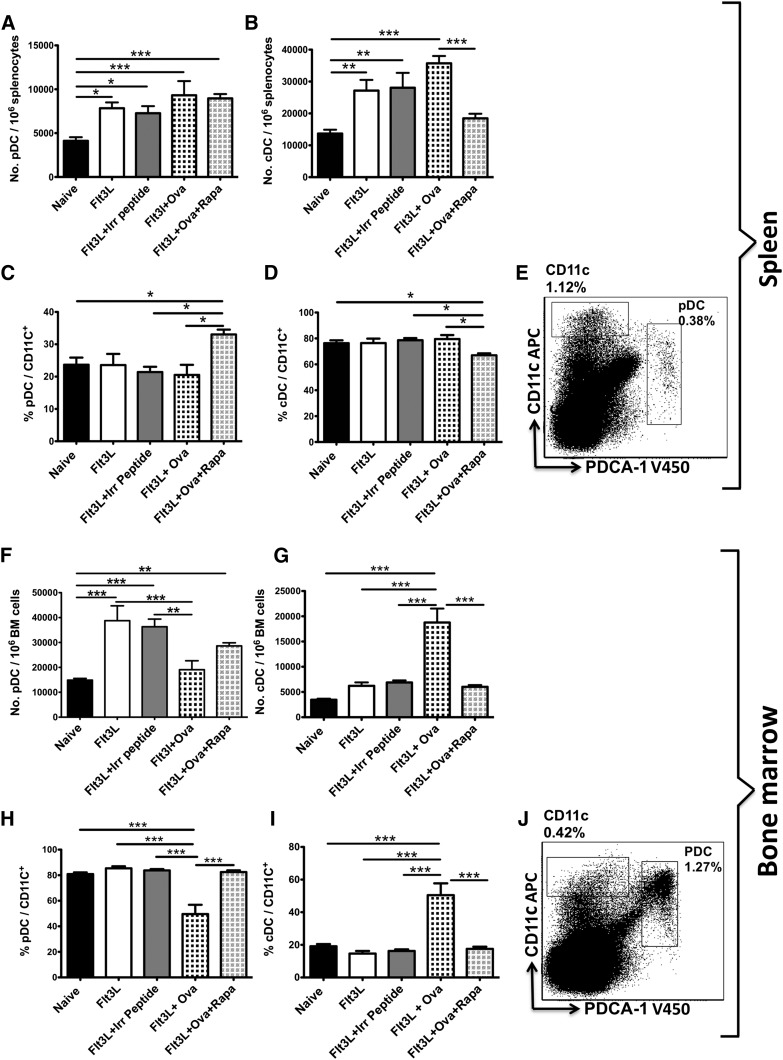
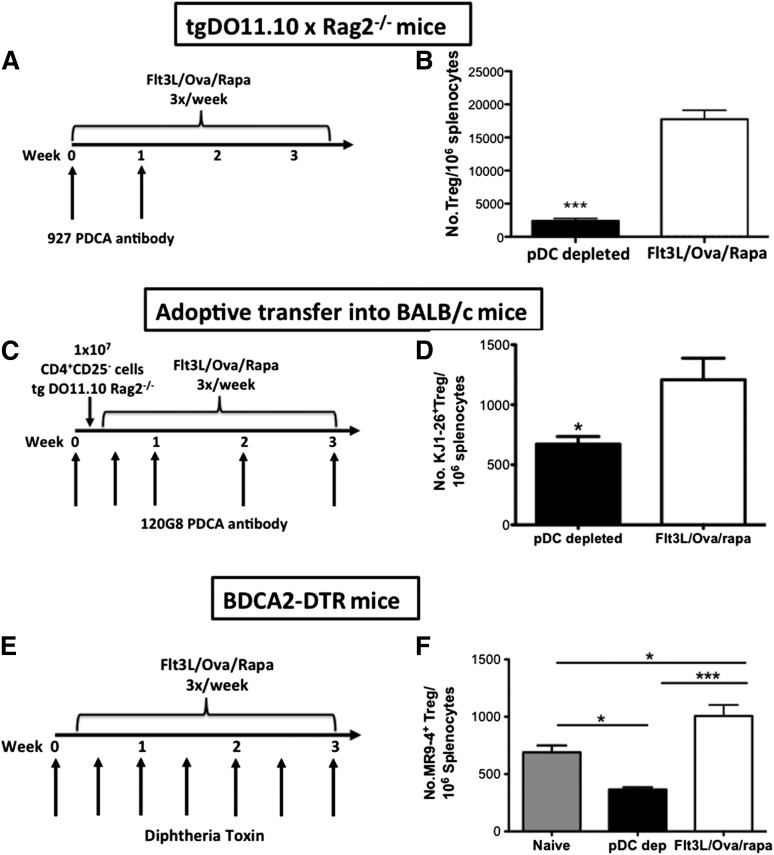
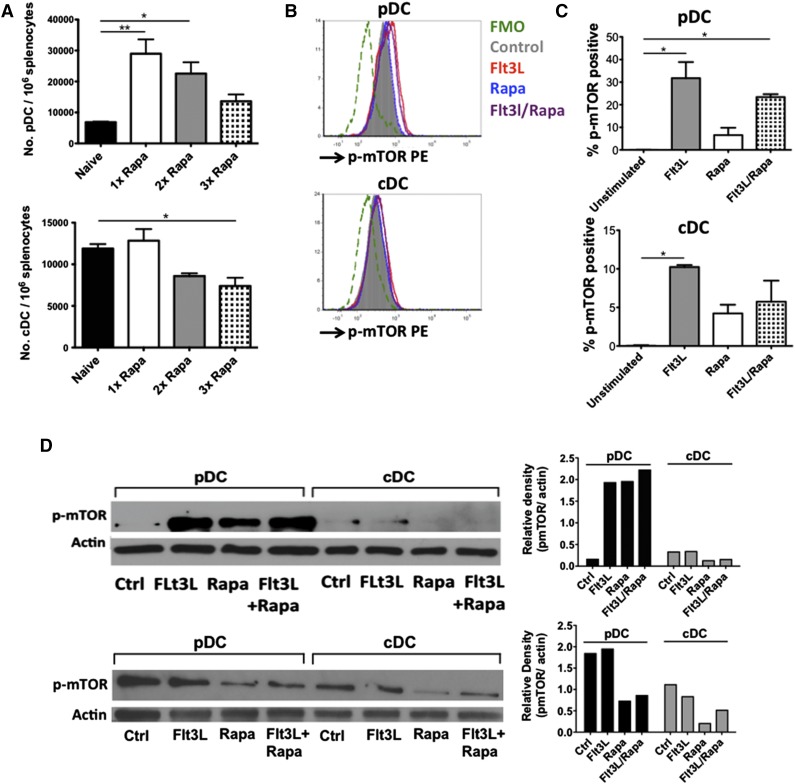
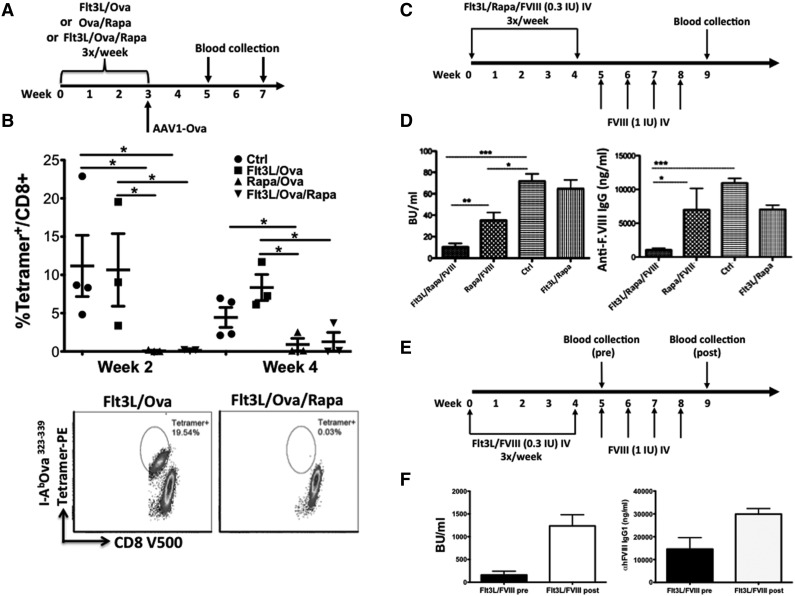
CD4(+)CD25(+)FoxP3(+) regulatory T cells (Treg) are critical elements for maintaining immune tolerance, for instance to exogenous antigens that are introduced during therapeutic interventions such as cell/organ transplant or gene/protein replacement therapy. Coadministration of antigen with rapamycin simultaneously promotes deletion of conventional CD4(+) T cells and induction of Treg. Here, we report that the cytokine FMS-like receptor tyrosine kinase ligand (Flt3L) enhances the in vivo effect of rapamycin. This occurs via selective expansion of plasmacytoid dendritic cells (pDCs), which further augments the number of Treg. Whereas in conventional DCs, rapamycin effectively blocks mammalian target of rapamycin (mTOR) 1 signaling induced by Flt3L, increased mTOR1 activity renders pDCs more resistant to inhibition by rapamycin. Consequently, Flt3L and rapamycin synergistically promote induction of antigen-specific Treg via selective expansion of pDCs. This concept is supported by the finding that Treg induction is abrogated upon pDC depletion. The combination with pDCs and rapamycin is requisite for Flt3L/antigen-induced Treg induction because Flt3L/antigen by itself fails to induce Treg. As co-administering Flt3L, rapamycin, and antigen blocked CD8(+) T-cell and antibody responses in models of gene and protein therapy, we conclude that the differential effect of rapamycin on DC subsets can be exploited for improved tolerance induction.


Figures

Figure 1
Figure 1
Multiple molecules can be used synergistically with rapamycin to decrease conventional CD4+ T cells and induce Treg. Percentage of CD4+ T cells (A) or CD25+FoxP3+ Treg/CD4+ T cells (B) in spleens of DO11.10-tg x Rag-2−/− BALB/c mice IP injected 3 times per week for 4 weeks with 100 μg of OVA323-339 plus rapamycin (4 mg/kg) and either Flt3L (80 μg/kg), Fc-GITR-L (8 mg/kg), a combination of Flt3L/Fc-GITR-L, IL-2 (50 ng/kg), or IL-10 (50 ng/kg). Untreated naïve animals serve as controls (n = 4-5 per group). Data are average ± standard deviation (SD). Statistically significant differences were determined by 2-way analysis of variance (ANOVA). (C) Examples of Treg induction with Flt3L/OVA323-339/rapamycin compared with OVA323-339/rapamycin and untreated control mouse.
Figure 2
Figure 2
Flt3L enhances activation-induced cell death of CD4+ T cells in response to antigen, an effect that is not further enhanced by rapamycin. (A-B) Depletion of OVA-specific CD4+ T cells in spleens of DO11.10-tg Rag-2−/− BALB/c mice treated with OVA323-339, Flt3L, Flt3L/OVA323-339, or a combination of Flt3L/OVA323-339/rapamycin. Untreated, naïve animals served as controls (n = 5 per experimental group). (C) Percentage of CD4+ T cells showing early apoptosis (Annexin V+7-AAD) after treatment with OVA323-339 or Flt3L/OVA323-339, compared with untreated control animals. Expression of activation markers CD62L (D), CD44 (E) and CD69 (F) in mice treated with OVA323-339 or Flt3L/OVA323-339, or in naïve, untreated animals. Data are average ± SD. Statistical differences were determined by 2-way ANOVA with Dunnett’s multiple comparison posttest analysis, using data from naïve mice as a control group, against which the other treatment groups were tested.
Figure 3
Figure 3
Rapamycin is required for Treg induction. Flt3L alone or with antigen fails to induce Treg. (A) Induction of OVA-specific CD4+CD25+FoxP3+ Treg cells in DO11.10-tg Rag-2−/− BALB/c mice treated with Flt3L/OVA323-339/rapamycin combination. Mice treated with OVA323-339, Flt3L, Flt3L/OVA323-339, or rapamycin only failed to generate Treg (n = 3-5 per group). Statistical differences were determined by 1-way ANOVA with Bonferonni’s multiple comparison posttest analysis. All groups tested were significantly different from the Flt3L/OVA323-339/Rapa treatment group (P < .0001). (B) Representative examples of stains for CD25 and FoxP3 (gated off CD4+ cells) for naïve controls, Flt3L-treated, rapamycin-treated, and Flt3L/OVA323-339/rapamycin-treated mice. (C) Expression of CTLA-4, Helios, CD62L, and GITR molecules in the induced Treg. Data are average ± SD (n = 5 per group).
Figure 4
Figure 4
Flt3L expands pDCs and cDCs in the spleen and bone marrow. Rapamycin blocks cDC expansion (but not pDC expansion). Total numbers of pDC (CD11c+PDCA-1+) (A) and cDC (CD11chi) (B) DC subsets in DO11.10-tg Rag-2−/− BALB/c mice per 106 splenocytes. Mice (n = 6-10) were treated 3 times per week for 3 weeks IP with Flt3L, Flt3L/OVA323-339, Flt3L/OVA323-339/ rapamycin, or Flt3L/irrelevant peptide (FIX peptide). Enumeration of pDCs (C) and cDCs (D) as a percentage of total DCs (CD11c+). (E) Representative dot plot of naïve DO11.10-tg Rag-2−/− BALB/c mice splenocytes showing gating scheme for pDCs and cDCs. Total numbers of pDC (CD11c+PDCA-1+) (F) and cDC (CD11chi) (G) DC subsets in DO11.10-tg Rag-2−/− BALB/c mice per 106 bone marrow cells. Mice (n = 6-10) were treated 3 times per week for 3 weeks IP with Flt3L, Flt3L/ OVA323-39, Flt3L/OVA323-339/ rapamycin, or Flt3L with an irrelevant peptide (FIX peptide). Enumeration of pDCs (H) and cDCs (I) as a percentage of total DCs (CD11c+). (J) Representative dot plot of naïve DO11.10-tg Rag-2−/− BALB/c mice bone marrow cells showing gating scheme for pDCs and cDCs. Plots are representative of data from 6 animals per experimental group. Statistical differences were determined by 2-way ANOVA with Bonferonni’s posttest comparisons.
Figure 5
Figure 5
Treg induction by Flt3L/antigen/rapamycin cocktail is pDC dependent. (A) Experimental timeline of DO11.10-tg Rag-2−/− BALB/c mice that received 2 weekly injections of PDCA-1 antibody (clone 927) to deplete pDCs. Mice were injected 3 times per week for 3.5 weeks with Flt3L/OVA323-339/rapamycin during the course of PDCA-1 antibody administration. Flt3L/OVA323-339/rapamycin was continued for 2 more weeks after PDCA-1 antibody treatment. (B) Treg induction was substantially lower in pDC-depleted mice after Flt3L/OVA323-339/rapamycin treatment. Data are average ± SD (n = 6 per group). Statistical differences were determined by the Student t test. (C) Experimental timeline of BALB/c mice that received 5 IV injections of PDCA-1 antibody (clone 120G8) over 3 weeks. Mice were infused with 1 × 10⁷ CD4+CD25 effector T cells from DO11.10-tg x Rag2−/− mice 1 day after the first PDCA-1 antibody injection. Mice continued to receive Flt3L/OVA323-339/rapamycin combination during the course of PDCA-1 antibody administration. Control mice only received Flt3L/OVA323-339/rapamycin treatment. (D) Induction of OVA specific (KJ1-26+) Treg from transplanted donor (DO11.10) cells was significantly lower in pDC-depleted mice after Flt3L/OVA323-339/rapamycin treatment. Data are average ± SD (n = 8 per group). Statistical differences were determined by the Student t test. (E) Experimental timeline of BDCA-2-DTR mice that received IV injections of DT (3 times per week for 3 weeks) to deplete pDCs. Mice continued to receive Flt3L/OVA323-339/rapamycin combination during the course of pDC depletion. Control mice only received Flt3L/OVA323-339/rapamycin treatment. (F) Increased OVA specific (MR9-4+) Treg in Flt3L/OVA323-339/rapamycin treated control mice as compared with naïve animals, which is abrogated by pDC depletion. Data are average ± SD (n = 4 per group). Statistical differences were determined by 1-way ANOVA with Bonferonni’s multiple comparison posttest analysis.
Figure 6
Figure 6
Flt3 receptor expression and mTOR signaling in pDC and cDC subsets. (A) Effect of increasing rapamycin dose on pDC and cDC numbers. DO11.10-tg x Rag-2−/− BALB/c mice (n = 4 per group) were treated three times per week for 3 weeks IP with Flt3L/OVA323-339/increasing doses of rapamycin: 4 mg/kg (1× rapa), 8 mg/kg (2× rapa) and 16 mg/kg (3× rapa). Total numbers of pDCs and cDCs were enumerated and statistical differences compared by 1-way ANOVA with Dunnett’s multiple comparison posttest using naïve animals as the control group, against which all other treatment groups were tested. (B) Histogram overlays showing differential p-mTORSer2448 expression in splenic pDCs and cDCs of naïve DO11.10-tg x Rag-2−/− BALB/c mice on in vitro incubation for 60 minutes with Flt3L (red histogram), rapamycin (blue histogram), or a combination of Flt3L/rapamycin (purple histogram). Shown is 1 representative of 2 independent experiments. (C) Graphical representation of p-mTORSer2448 expression in pDC and cDC populations from panel B. Data show showing percent positive cells for each treatment, with histogram subtraction applied against the control group, which represents unstimulated cells. Histogram subtraction was applied using FCS express 4.0 software. The graphs represent data from 2 independent experiments. One-way ANOVA with Tukey’s multiple comparison test was used to calculate significance. (D) Representative western blot images of splenic pDCs and cDCs probed for p-mTORSer2448 (upper) and actin (lower). Flow-sorted pDCs and cDCs from spleens of naïve, non-pretreated DO11.10-tg x Rag-2−/− mice (top) or mice that received repeated Flt3L injections for 10 days (bottom), were serum starved for 2 hours and treated for 60 minutes with 2 μg/mL Flt3l, 100 nM rapamycin, or a combination of Flt3L/rapamycin. Images for pmTORSer2448 and β-actin were analyzed by the ImageJ densitometric software. Normalized relative density of pmTOR to β-actin is represented for both sets of western blot images.
Figure 7
Figure 7
Flt3L combined with rapamycin prevents antigen-specific immune response in gene and protein therapy models. (A) Experimental timeline of C57BL/6 mice that were treated with combinations of Flt3L/OVA323-339, OVA323-339/rapamycin, or Flt3L/OVA323-339/rapamycin (3 times per week for 3 weeks). Treatment was followed by challenge with scAAV1-CMV-OVA, delivered by intramuscular injection. (B) OVA323-339-specific CD8+ responses from blood were enumerated at 2 and 4 weeks postvector injection. Representative dot plots of OVA323-339-specific tetramer labeling are shown for 2 treatment conditions: Flt3L/OVA323-339 and Flt3L/OVA323-339/rapamycin. (C) Experimental timeline. Male F8e16−/−BALB/c mice were treated 3 times per week IV with combinations of Flt3L/rapamycin/low-dose FVIII (0.3 IU/mL), or rapamycin/FVIII, or Flt3L/FVIII for 4 weeks (using 0.3 IU FVIII per dose per mouse). Mice were subsequently challenged with FVIII replacement therapy (1 IU IV, 1 time per week for 4 more weeks). Control mice received the FVIII challenge only (ie, without prior immune tolerance regimen). Blood was collected on weeks 7 and 9. (D) Antibody titers against FVIII were determined by Bethesda assay and by FVIII-specific IgG1 enzyme-linked immunosorbent assay. (E) Timeline for male F8e16−/−BALB/c mice that were treated three times per week IV with Flt3L/low-dose FVIII (0.3 IU/mL) for 4 weeks. Mice were subsequently challenged with FVIII replacement therapy (1 IU IV, 1 time per week for 4 more weeks). (F) Mice pretreated with the Flt3L/FVIII combination developed high-titer inhibitor inhibitors (“Pre’), which further increased after FVIII challenge (“Post”). IgG1 responses were similarly elevated.

Similar articles

Cited by

References

    1. Thomson AW, Turnquist HR, Raimondi G. Immunoregulatory functions of mTOR inhibition. Nat Rev Immunol. 2009;9(5):324–337. - PMC - PubMed
    1. Hackstein H, Taner T, Zahorchak AF, et al. Rapamycin inhibits IL-4–induced dendritic cell maturation in vitro and dendritic cell mobilization and function in vivo. Blood. 2003;101(11):4457–4463. - PubMed
    1. Matsue H, Yang C, Matsue K, Edelbaum D, Mummert M, Takashima A. Contrasting impacts of immunosuppressive agents (rapamycin, FK506, cyclosporin A, and dexamethasone) on bidirectional dendritic cell-T cell interaction during antigen presentation. J Immunol. 2002;169(7):3555–3564. - PubMed
    1. Shi LZ, Wang R, Huang G, et al. HIF1alpha-dependent glycolytic pathway orchestrates a metabolic checkpoint for the differentiation of TH17 and Treg cells. J Exp Med. 2011;208(7):1367–1376. - PMC - PubMed
    1. Delgoffe GM, Kole TP, Zheng Y, et al. The mTOR kinase differentially regulates effector and regulatory T cell lineage commitment. Immunity. 2009;30(6):832–844. - PMC - PubMed

Publication types

MeSH terms