. 2015 Apr 1;35(13):5156-70.
doi: 10.1523/JNEUROSCI.0124-14.2015.

Regulation of patterned dynamics of local exocytosis in growth cones by netrin-1

Affiliations

Regulation of patterned dynamics of local exocytosis in growth cones by netrin-1

Oriol Ros et al. J Neurosci. .

Abstract

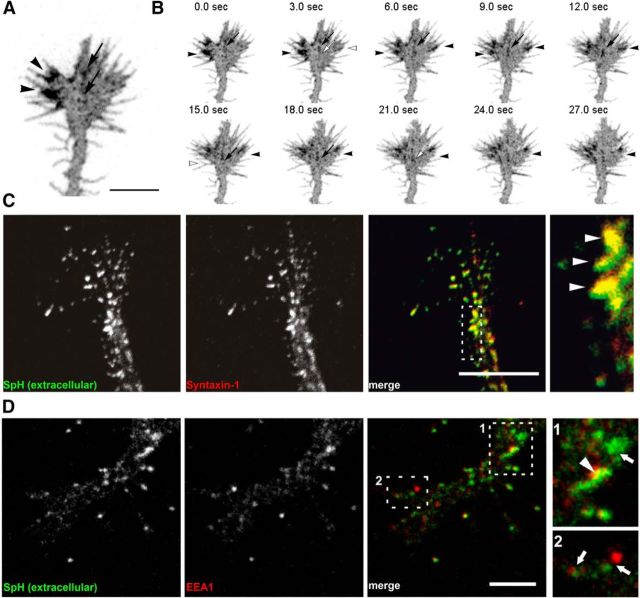
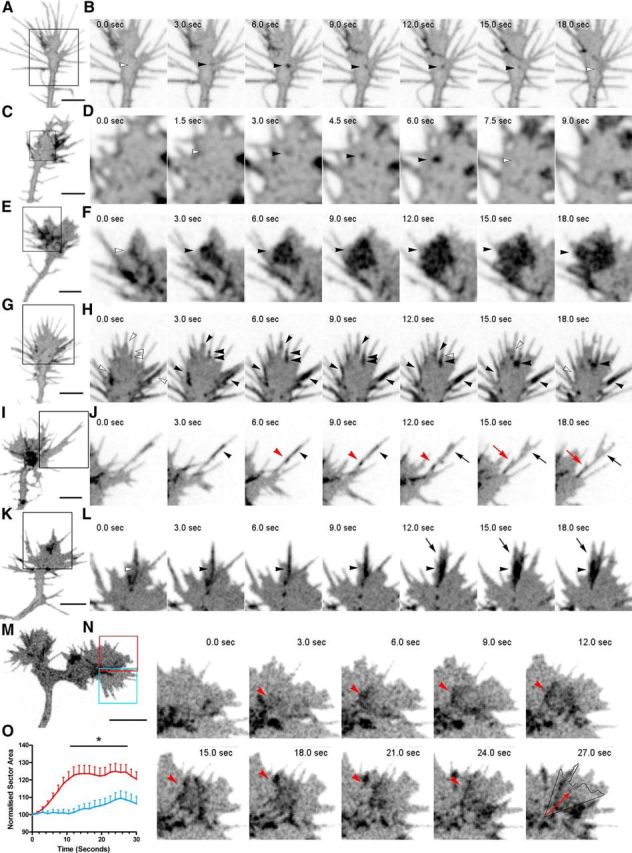
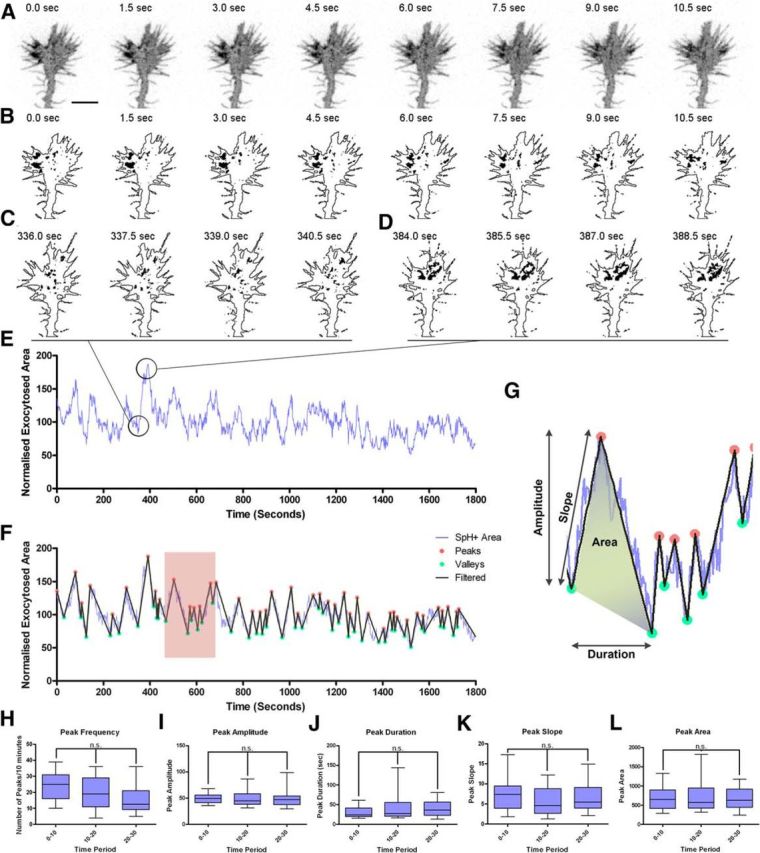
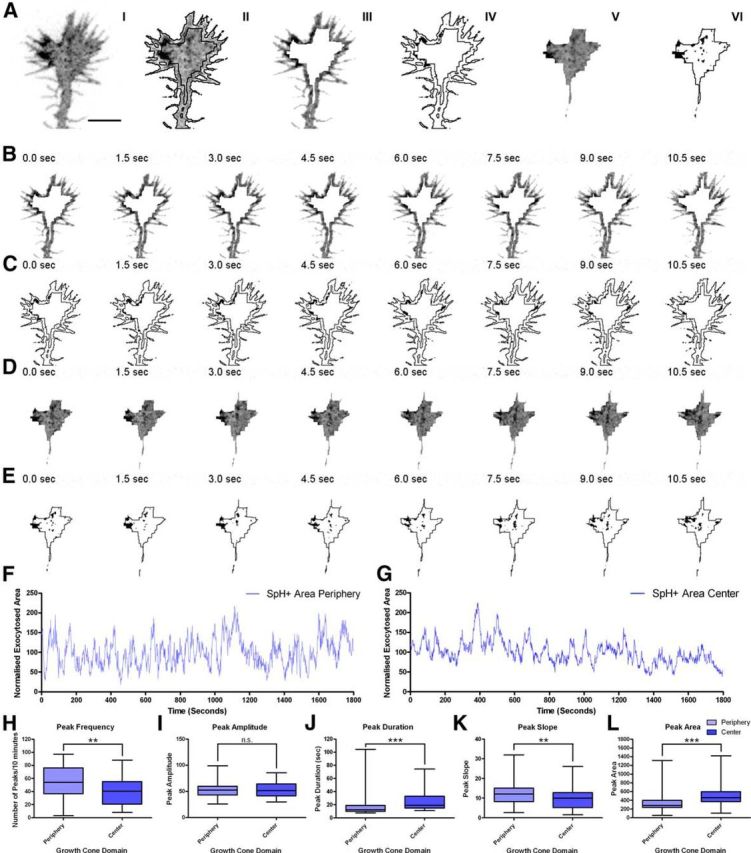
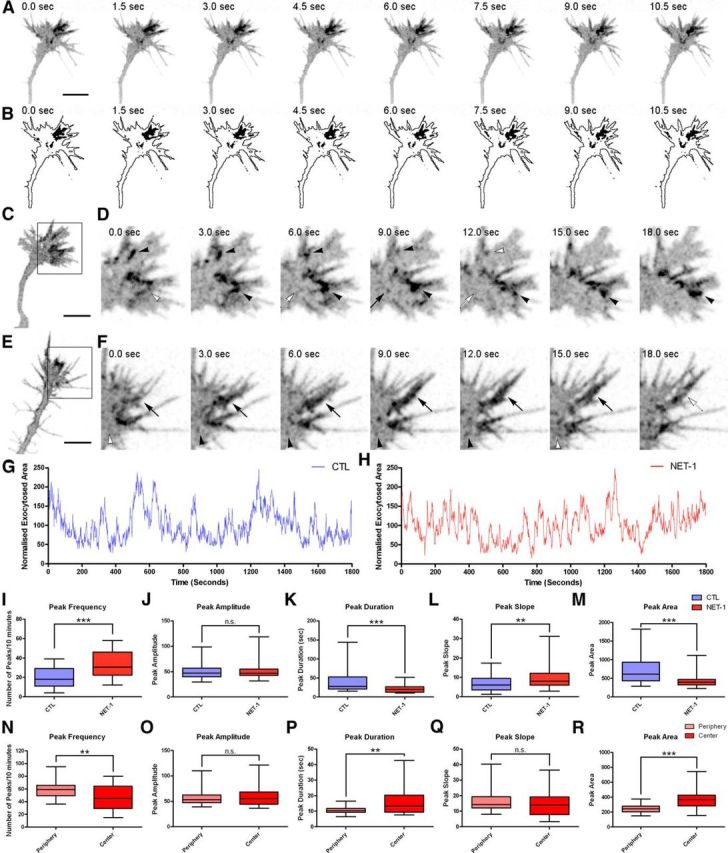
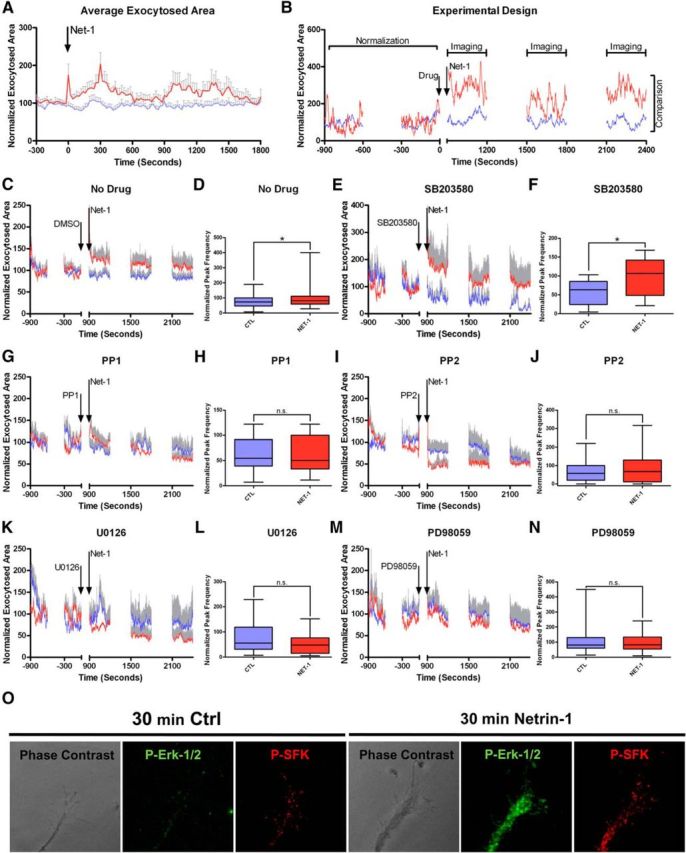
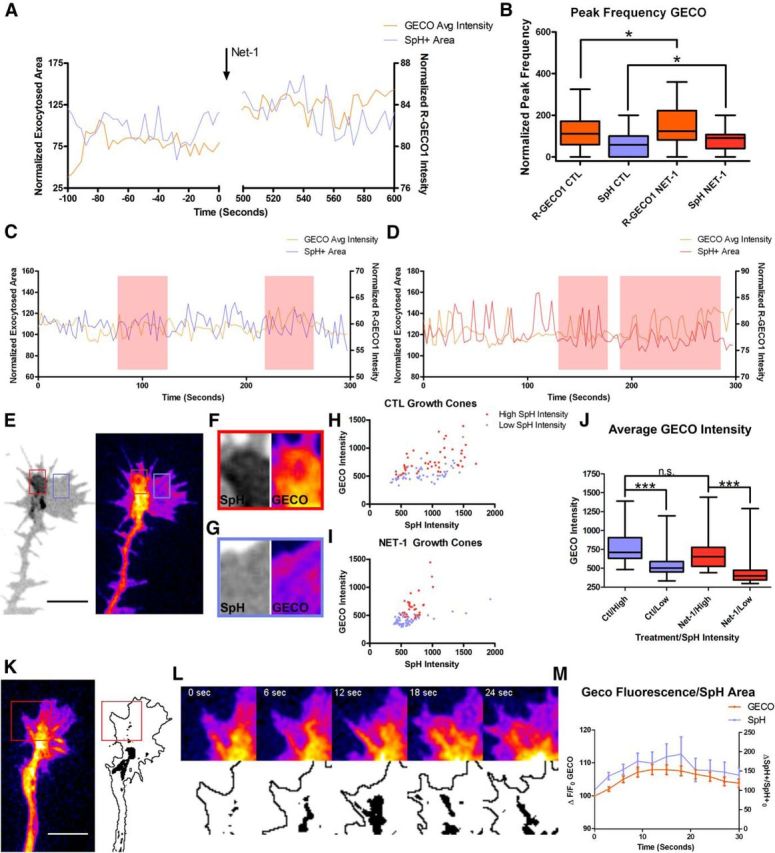
Axonal guidance and synaptic specification depends on specific signaling mechanisms that occur in growth cones. While several signaling pathways implicated in cone navigation have been identified, membrane dynamics in growth cones remains largely unknown. We took advantage of SynaptopHluorin and high-speed optical recordings to monitor the patterns of membrane dynamics in rat hippocampal growth cones. We show that exocytosis occurs both at the peripheral and central domains, including filopodia, and that SynaptopHluorin signals occur as spontaneous patterned peaks. Such transients average approximately two per minute and last ∼30 s. We also demonstrate that the chemoattractant Netrin-1 elicits increases in the frequency and slopes of these transients, with peaks averaging up to six per minute in the peripheral domain. Netrin-1-dependent regulation of exocytotic events requires the activation of the Erk1/2 and SFK pathways. Furthermore, we show that domains with high SynaptopHluorin signals correlate with high local calcium concentrations and that local, spontaneous calcium increases are associated with higher SynaptopHluorin signals. These findings demonstrate highly stereotyped, spontaneous transients of local exocytosis in growth cones and that these transients are positively regulated by chemoattractant molecules such as Netrin-1.

Keywords: Netrin-1; SynaptopHluorin; exocytosis; growth cone.


Figures

Figure 1.
Figure 1.
SynaptopHluorin reliably labels exocytotic events occurring in the growth cone. A, Image of a hippocampal growth cone transfected with SynaptopHluorin. Membrane domains with increased fluorescence appear in the central (arrows) and peripheral (arrowheads) domains. Images are shown in an inverted scale. B, Image sequence of the growth cone in A over a 27 s recording period. Fluorescent SynaptopHluorin-positive spots are dynamic and appear and disappear within the course of a few seconds. Arrows and arrowheads indicate different exocytotic events. C, Confocal images of a hippocampal growth cone with extracellular SynaptopHluorin (SpH) signals and the t-SNARE Syntaxin-1, showing almost complete colocalization. Right, Shows a magnification of boxed area in C showing marked colabeling (arrowheads). D, Confocal images of a hippocampal growth cone showing the distribution of extracellular SynaptopHluorin and the endocytic marker EEA1. Boxed areas are enlarged on the right. After labeling with a GFP antibody, live neurons were cultured for 30 min to allow possible retrieval of extracellular SynaptopHluorin. Note the low colocalization of the two proteins (arrows; arrowhead indicates partial colocalization). Scale bars: A, C, D, 5 μm.
Figure 2.
Figure 2.
SynaptopHluorin imaging reveals distinct modes of exocytosis in the growth cone and in filopodia. A, B, Image of a hippocampal growth cone transfected with SynaptopHluorin (A) and image sequence of the boxed region in A (B). The sequence shows the appearance of a fluorescent spot (black arrowheads) in the central domain of the growth cone—possibly corresponding to a single vesicle—lasting for ∼12 s. C, D, Image of a hippocampal growth cone transfected with SynaptopHluorin (C) and image sequence of the boxed region in C (D). The sequence shows the appearance of a highly transient, fluorescent spot (arrowheads) in the central domain of the growth cone. E, F, Hippocampal growth cone transfected with SynaptopHluorin (E) and image sequence of the boxed region in E (F). The sequence shows the appearance of a large fluorescent cluster (black arrowheads) at the periphery of the growth cone (white arrowhead, left). G, H, Growth cone transfected with SynaptopHluorin (G) and image sequence of the boxed region in G (H). The sequence shows the appearance of fluorescent spots in numerous filopodia in a single growth cone, including the sequential appearance of several fluorescent spots along the shaft of a single filopodium (black arrowheads). White arrowheads label the location where exocytosis will take place. I, J, Image of a growth cone transfected with SynaptopHluorin (I) and image sequence of the boxed region in I (J). The sequence shows the appearance of two exocytotic events in a single filopodium (black and red arrowheads), followed by the branching of the filopodium next to the sites of increased fluorescence (black and red arrows). K, L, Growth cone transfected with SynaptopHluorin (K) and image sequence of the boxed region of K (L). The sequence shows the appearance of a large fluorescent spot (black arrowheads) within a filopodium, preceding a large membrane expansion (black arrows). M, N, Growth cone transfected with SynaptopHluorin (M) and image sequence of the red box in M (N). The blue boxed area represents a control region in the same growth cone displaying low exocytosis (see O). The sequence in N shows the appearance of a large fluorescent spot in the central domain of the growth cone (arrowhead at 3.0 s), which subsequently moves toward the periphery (arrowheads at 6.0 to 18.0 s), and the subsequent expansion of the growth cone in the same direction (18.0 to 24.0 s). The last image shows the outline of the growth cone at 0.0 s and the motion vector of the fluorescent spot (arrow). O, Quantification of the area of the growth cones in a 45° sector centered in the vector of movement of 10 random SynaptopHluorin events (red line) compared with control regions of the same growth cones exhibiting low exocytotic rates (blue). Data averages eight different growth cones. Data are means ± SEM, two-way ANOVA, and Bonferroni post hoc test. *p < 0.05. Scale bars: A, C, E, G, I, K, M, 5 μm.
Figure 3.
Figure 3.
Quantitative analyses of exocytotic events in hippocampal growth cones using SynaptopHluorin. A, Image sequence of a growth cone transfected with SynaptopHluorin over 10 s. B, Segmented images of the growth cone in A displaying the regions with fluorescence above a defined threshold, isolated from the outline of the growth cone. C, D, Segmented images of the growth cone in A during a period of low (C) and high (D) exocytotic activity. E, Representative plot of fluorescent areas, normalized to the total area of the growth cone, over time 30 min. F, Plot in E filtered by a 20% threshold (black line) superimposed on the original plot (blue line). Transient peaks are defined by the minimums and maximums (highlighted in green and red, respectively) of the filtered plot (SpH+, SynaptopHluorin-positive). G, Magnification of the boxed region in F illustrating the parameters analyzed: Amplitude, Duration, Slope, and Area. H–L, Quantifications of the average peak frequency (H), amplitude (I), duration (J), slope (K), and area (L) in control hippocampal growth cones recorded for 30 min (every 10 min). n.s., non-significant. Kruskal–Wallis test with Dunn's post hoc analysis.
Figure 4.
Figure 4.
Analysis of exocytotic events in the central and peripheral domains of the growth cone. A, Dissection of the growth cone displayed in I into the peripheral (III) and central (V) domains. IV and VI show the respective segmented images. B, C, Image sequence (B) and the corresponding segmented images (C) of the peripheral domain of the growth cone in A. D, E, Image sequence (D) and the corresponding segmented images (E) of the central domain of the growth cone in A. F, Plot of fluorescent areas of the peripheral domain of the growth cone in A, normalized to the total area of the growth cone, plotted over time. G, Plot of fluorescent areas of the central domain of the growth cone in A, normalized to the total area of the growth cone, plotted over time (SpH+, SynaptopHluorin-positive). H–L, Quantification of the average peak frequency (H), amplitude (I), duration (J), slope (K), and area (L) in the central and peripheral domains of control growth cones recorded for 30 min. Mann–Whitney test. n.s., non-significant. **p < 0.01, ***p < 0.001.
Figure 5.
Figure 5.
Quantitative profiling of exocytotic events in Netrin-1-treated growth cones transfected with SynaptopHluorin. A, Image sequence of a Netrin-1-treated growth cone transfected with SynaptopHluorin. B, Segmented images of the growth cone in A displaying the regions with fluorescence above a defined threshold, isolated from the outline of the growth cone. C, Image of a Netrin-1-treated hippocampal growth cone transfected with SynaptopHluorin. D, Image sequence of the boxed region in C. The image sequence shows the appearance of large fluorescent spots (black arrowheads) at the periphery of the growth cone and a fast single vesicle spot (arrow). E, Image of a Netrin-1-treated hippocampal growth cone transfected with SynaptopHluorin. F, Image sequence of the boxed region in E. The image sequence shows the appearance of several large fluorescent spots (black arrowheads) within filopodia. A particularly large fluorescent cluster is labeled by arrows. G, Plot of exocytotic events in a control growth cone over time. H, Plot of exocytotic events recorded in the growth cone incubated with Netrin-1 depicted in A. I–M, Quantification of the average peak frequency (I), amplitude (J), duration (K), slope (L), and area (M) in control and Netrin-1-treated growth cones recorded for 30 min. N–R, Quantification of the average peak frequency (N), amplitude (O), duration (P), slope (Q), and area (R) in the central and peripheral domains of Netrin-1-treated growth cones recorded for 30 min. Mann–Whitney test. n.s., non-significant. **p < 0.01, ***p < 0.001. Scale bars: A, C, E, 5 μm. CTL, control; NET-1, Netrin-1.
Figure 6.
Figure 6.
Involvement of SFKs and Erk1/2 in the Netrin-1-induced increase in growth cone membrane dynamics. A, Average exocytotic profiles of control and Netrin-1-treated growth cones, imaged every 20 s. After the addition of Netrin-1 (time 0), growth cones show an increase in the average exocytosed area, whereas control growth cones remain stable. Data averages 35 control and 20 Netrin-1-treated growth cones. B, Experimental design of the pharmacology experiments. The plot profile shows the traces of a control and Netrin-1-treated growth cone. Images were acquired every 1.5 s at 5 min intervals. The first 15 min were considered as controls and used to normalize the plots. Drugs were added 15 min after the beginning of the recording; Netrin-1 was added 15 min after the addition of the drug. Traces from minute 30 onward were analyzed and used for comparison. The time points at which the drug and Netrin-1 were added are labeled by arrows. C, E, G, I, K, M, Average profiles of control and Netrin-1-treated growth cones without the addition of a drug (C), or treated with the p38 inhibitor SB203580 (E), the SFKs inhibitors PP1 and PP2 (G and I, respectively), and the Erk1/2 inhibitors U0126 and PD98059 (K, M). Note that SFKs and Erk1/2 inhibitors block Netrin-1-induced increases in SynaptopHluorin signals. D, F, H, J, L, N, Comparison between the average peak frequencies of control and Netrin-1-treated growth cones in the absence (D) or presence of the aforementioned inhibitors: p38 (F), SFKs (H, J), and Erk1/2 (L, N). Mann–Whitney test. n.s., non-significant. *p < 0.05. O, Confocal images show low phosphorylation levels of Erk1/2 and SFKs in hippocampal growth cones in control conditions (left). Note that Netrin-1 triggers the local phosphorylation of Erk1/2 and SFKs in the growth cone (right). CTL, control; NET-1, Netrin-1.
Figure 7.
Figure 7.
Calcium and membrane dynamics correlation in growth cones. A, Calcium (orange) and membrane (blue) dynamics in a representative growth cone before and after the addition of Netrin-1, measured using the indicators R-GECO1 and SynaptopHluorin, respectively. B, Comparison of R-GECO1 and SynaptopHluorin peak frequencies in control and Netrin-1-treated growth cones. C, D, Representative calcium (orange) and SynaptopHluorin (blue or red) traces in a control (C) and a Netrin-1-treated (D) growth cone, showing a parallel evolution of peaks. Horizontal lines above the raster show periods of apparent high correlation. E, Image of a growth cone imaged with SynaptopHluorin and RGECO-1 showing regions of high (red box) and low (blue box) SynaptopHluorin/RGECO-1 (the latter is pseudocolored in Fiji's “Fire” LUT). F, G, Magnification of the red and blue boxes in E. H, I, Scatterplots of the intensity of SynaptopHluorin signals (x-coordinate) and calcium signals (y-coordinate) in domains exhibiting high or low calcium concentrations in control (CTL; H) and Netrin-1-treated (NET-1; I) growth cones. J, Average intensities in calcium signals in cone areas depicting high and low SynaptopHluorin domains in Netrin-1 (red) and control (blue) growth cones. K, L, Image of a growth cone labeled with R-GECO1 (K) and image sequence of the evolution of R-GECO1 and SynaptopHluorin labeling over time (L). Note that local calcium domains correlate with high SynaptopHluorin signals. M, Average R-GECO1 and SynaptopHluorin correlated intensities (mean ± SEM, n = 35 calcium transients of 8 different growth cones) in cone domains displaying a local increase in calcium concentration, plotted over time. The image shows that the two processes occur simultaneously. Kruskal–Wallis with Dunn's post hoc test. n.s., non-significant. *p < 0.05, ***p < 0.001. CTL, control; NET-1, Netrin-1; SPH, SynaptopHluorin; GECO, R-GECO1.

Similar articles

Cited by

References

    1. Aguado F, Espinosa-Parrilla JF, Carmona MA, Soriano E. Neuronal activity regulates correlated network properties of spontaneous calcium transients in astrocytes in situ. J Neurosci. 2002;22:9430–9444. - PMC - PubMed
    1. Aguado F, Carmona MA, Pozas E, Aguilo A, Martínez-Guijarro FJ, Alcantara S, Borrell V, Yuste R, Ibañez CF, Soriano E. BDNF regulates spontaneous correlated activity at early developmental stages by increasing synaptogenesis and expression of the K+/Cl- co-transporter KCC2. Development. 2003;130:1267–1280. doi: 10.1242/dev.00351. - DOI - PubMed
    1. Bashaw GJ, Klein R. Signaling from axon guidance receptors. Cold Spring Harb Perspect Biol. 2010;2:a001941. doi: 10.1101/cshperspect.a001941. - DOI - PMC - PubMed
    1. Bouchard JF, Moore SW, Tritsch NX, Roux PP, Shekarabi M, Barker PA, Kennedy TE. Protein kinase A activation promotes plasma membrane insertion of DCC from an intracellular pool: a novel mechanism regulating commissural axon extension. J Neurosci. 2004;24:3040–3050. doi: 10.1523/JNEUROSCI.4934-03.2004. - DOI - PMC - PubMed
    1. Bouchard JF, Horn KE, Stroh T, Kennedy TE. Depolarization recruits DCC to the plasma membrane of embryonic cortical neurons and enhances axon extension in response to netrin-1. J Neurochem. 2008;107:398–417. doi: 10.1111/j.1471-4159.2008.05609.x. - DOI - PubMed

Publication types