. 2015 Apr 1;35(13):5307-16.
doi: 10.1523/JNEUROSCI.1674-14.2015.

Contribution of the potassium-chloride cotransporter KCC2 to the strength of inhibition in the neonatal rodent spinal cord in vitro

Affiliations

Contribution of the potassium-chloride cotransporter KCC2 to the strength of inhibition in the neonatal rodent spinal cord in vitro

Florian Gackière et al. J Neurosci. .

Abstract

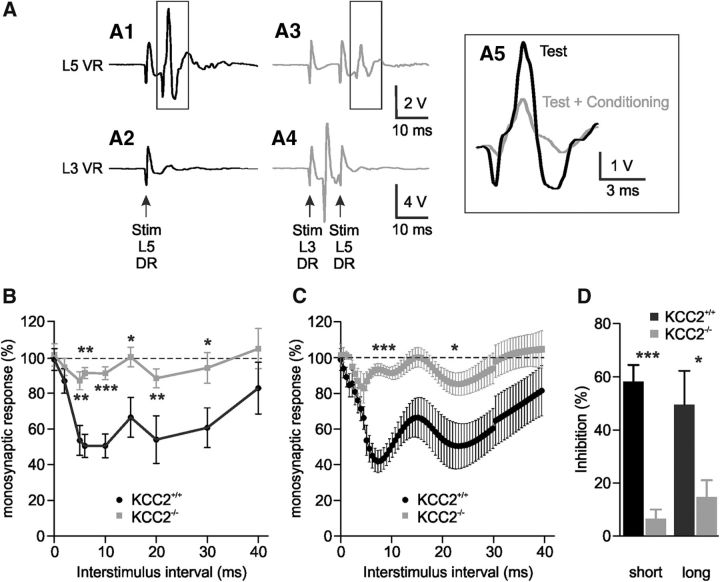
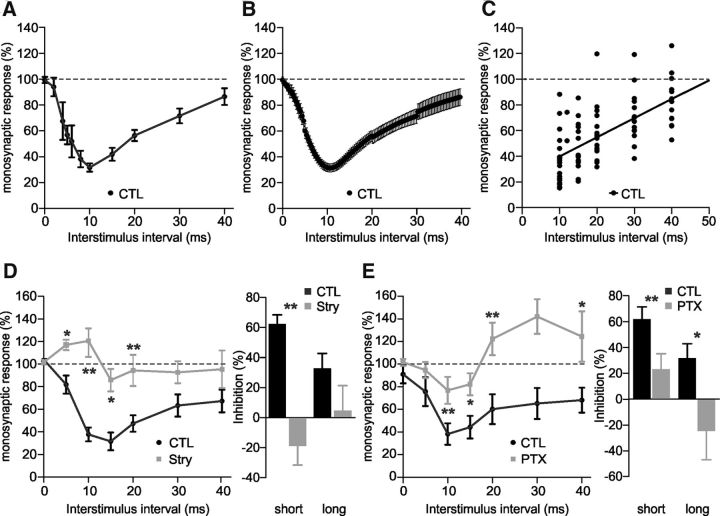
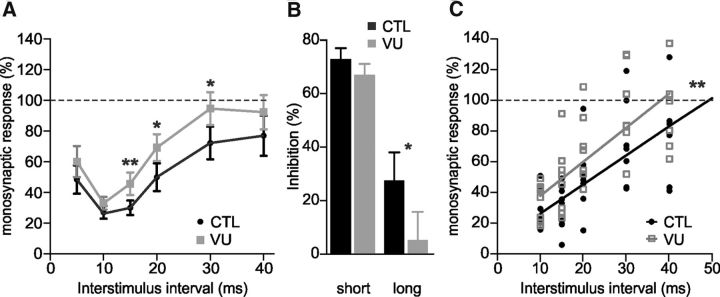
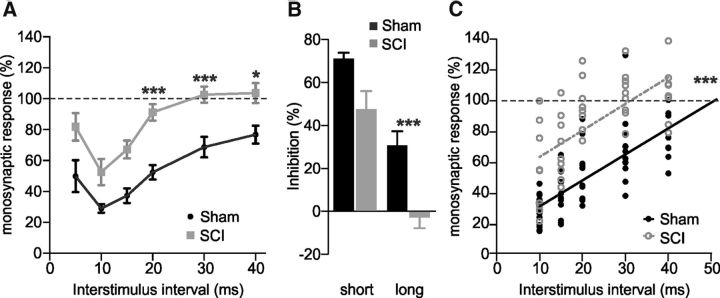
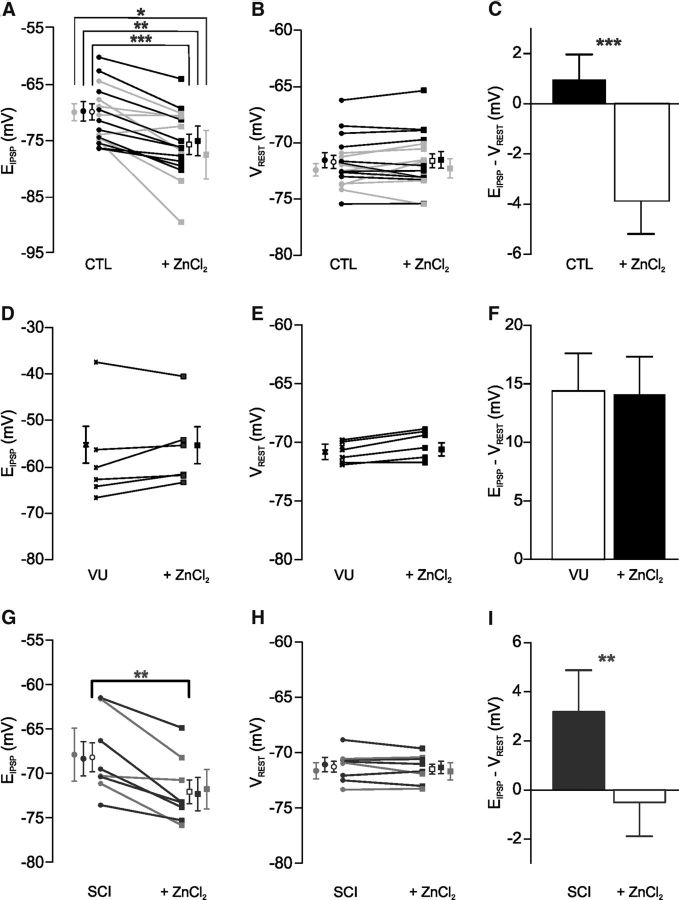
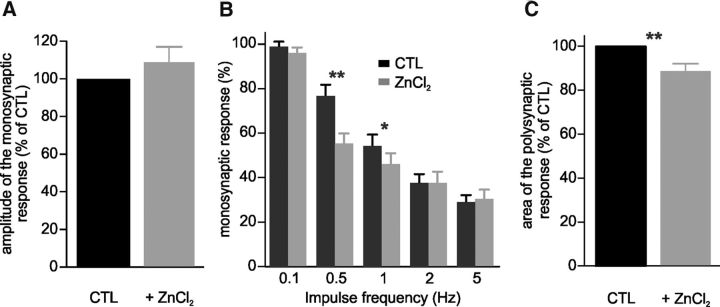
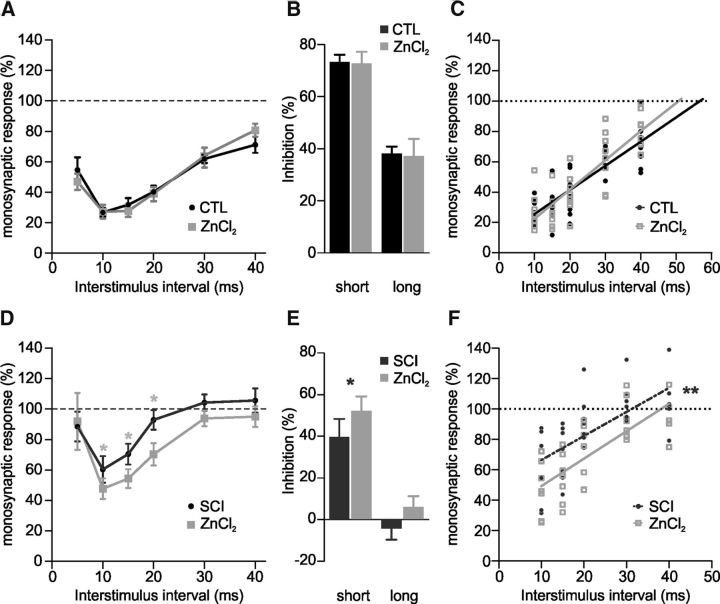
In healthy mature motoneurons (MNs), KCC2 cotransporters maintain the intracellular chloride concentration at low levels, a prerequisite for postsynaptic inhibition mediated by GABA and glycine. KCC2 expression in lumbar MNs is reduced after spinal cord injury (SCI) resulting in a depolarizing shift of the chloride equilibrium potential. Despite modeling studies indicating that such a downregulation of KCC2 function would reduce the strength of postsynaptic inhibition, physiological evidence is still lacking. The present study aimed at investigating the functional impact of a modification of KCC2 function. We focused on a well characterized disynaptic inhibitory pathway responsible for reciprocal inhibition between antagonistic muscles. We performed in vitro extracellular recordings on spinal cords isolated from rodents at the end of the first postnatal week. Genetic reduction of KCC2 expression, pharmacological blockade of KCC2, as well as SCI-induced downregulation of KCC2 all resulted in a reduction of the strength of reciprocal inhibition. We then tried to restore endogenous inhibition after SCI by means of zinc ions that have been shown to boost KCC2 function in other models. Zinc chloride indeed hyperpolarized the chloride equilibrium potential in MNs and increased reciprocal inhibition after neonatal SCI. This study demonstrates that the level of KCC2 function sets the strength of postsynaptic inhibition and suggests that the downregulation of KCC2 after SCI likely contributes to the high occurrence of flexor-extensor cocontractions in SCI patients.

Keywords: KCC2; chloride homeostasis; reciprocal inhibition; spasticity; zinc.


Figures

Figure 1.
Figure 1.
The strength of reciprocal inhibition depends on KCC2 expression in neonatal mice. A, Representative traces of extracellular recordings from L5 and L3 VRs (A1, A3 and A2, A4, respectively) of a P6 KCC2+/+ mouse. Black traces show the responses to the L5 DR stimulation (Test) whose intensity is sufficient to evoke a monosynaptic reflex in L5 VR. Gray traces show the responses when the L5 DR stimulation, at the same intensity, was preceded by a conditioning stimulation of the L3 DR (Test + Conditioning) that is sufficient to evoke a monosynaptic reflex in L3 VR (interval of 10 ms). A5, Enlargement of superimposed monosynaptic responses. B, C, Amplitude of the test response plotted against the interstimulus interval between conditioning and test stimulations. Average normalized strength of inhibition, represented from raw data (B) or after a fitting analysis using spline/lowess, cubic option (C) showing two distinct phases of inhibition. Curves were obtained from 5 KCC2+/+ and 10 KCC2−/− P4–P6 mice with at least three observations at each delay. Note that the discontinuity after 30 ms interval is due to a different number of observations. D, Histograms summarizing the strength of reciprocal inhibition at short (7.3 ms) and long (23.1 ms) interstimulus intervals. Statistical differences between KCC2+/+ and KCC2−/− mice are noted above each delay in B and above short and long delays in C and D (Mann–Whitney test; *p < 0.05, **p < 0.01, ***p < 0.001).
Figure 2.
Figure 2.
Contribution of GABA and glycine to reciprocal inhibition in neonatal rats. A, B, Amplitude of the test response. Average normalized strength of inhibition, represented from raw data (A) or after a fitting analysis using spline/lowess, cubic option (B), which shows a single phase of inhibition (peaking at 10.8 ms). The curve was obtained from 17 P4–P6 rats with at least three observations at each delay. C, Linear regression analysis of the strength of inhibition at delays larger than 10 ms (r = 0.62). The intersection of the regression line with the x-axis gives the duration of the inhibition. D, E, Amplitude of the test response before (CTL) and 20–45 min after strychnine (D; Stry, 0.4–1 μm; 9 P4–P6 rats) or picrotoxin (E; PTX, 20 μm; 8 P4–P6 rats). At least four observations were made for each delay. Histograms represent the strength of inhibition at short and long interstimulus intervals (10 and 40 ms, respectively) before and after drug application. Statistical differences between CTL and Stry, and between CTL and PTX are noted above delays and histograms in D and E (Wilcoxon test; *p < 0.05, **p < 0.01).
Figure 3.
Figure 3.
Pharmacological blockade of KCC2 decreases both the strength and the duration of reciprocal inhibition in neonatal rats. A, Amplitude of the test response measured before (CTL) and 30–60 min after application of 25 μm VU compounds. Curves were obtained from nine P4–P6 rats with at least six observations at each delay (6 animals received VU0240551, 2 VU0255011, and 1 VU0463271). B, Histograms represent the strength of inhibition at short and long interstimulus intervals (10 and 30 ms, respectively) from data reported in A. C, Linear regression analysis of the data reported in A (r = 0.68 and r = 0.71, respectively for CTL and VU conditions). Statistical differences between CTL and VU are noted above delays in A, above histograms in B and near regression lines in C (Wilcoxon test and linear regression analysis; *p < 0.05, **p < 0.01).
Figure 4.
Figure 4.
The strength and the duration of reciprocal inhibition are reduced after neonatal SCI in rats. A, Amplitude of the test response in untransected (Sham; 13 animals with at least 7 observations at each delay) and SCI (9 animals with at least 8 observations at each delay) P4–P6 rats. B, Histograms represent the strength of inhibition at short and long interstimulus intervals (10 and 30 ms, respectively) from data reported in A. C, Linear regression analysis of the data reported in A (r = 0.72 and r = 0.65, respectively for Sham and SCI conditions). Statistical differences between Sham and SCI rats are noted above delays in A, above histograms in B and near regression lines in C (Mann–Whitney test and linear regression analysis; *p < 0.05, **p < 0.01, ***p < 0.001).
Figure 5.
Figure 5.
ZnCl2 hyperpolarizes EIPSP via KCC2 in neonatal rat MNs. AC, EIPSP (A), Vrest (B), and driving force (EIPSPVrest; C) measured from intact P4–P6 rats before (CTL) and 30–60 min after ZnCl2 (1 μm, gray, n = 7; 10 μm, black, n = 10). Empty symbols indicate mean ± SEM of the pooled data. Note that differences are also significant considering each concentration separately: *1 μm and **10 μm ZnCl2. DF, Pharmacological blockade of KCC2 by VU compounds prevents the hyperpolarizing shift of EIPSP induced by ZnCl2 application in intact P4–P6 rats. EIPSP (D), Vrest (E), and driving force (EIPSPVrest; F) measured 10–30 min after the application of KCC2 blockers (25 μm VU; n = 5 VU0240551 and n = 1 VU0463271) and 30–60 min after 10 μm ZnCl2 (n = 6). GI, EIPSP (G), Vrest (H), and driving force (EIPSPVrest; I) measured from P4–P6 rats that underwent SCI at birth before (SCI) and 30–60 min after ZnCl2 (1 μm, gray, n = 3; 10 μm, black, n = 5). Empty symbols indicate mean ± SEM of the pooled data. Statistical differences are noted below values in A and G, and below histograms in C and I (Wilcoxon test; *p < 0.05, **p < 0.01, ***p < 0.001).
Figure 6.
Figure 6.
Effects of ZnCl2 on VR responses to homonymous DR stimulation in the P4–P6 rat spinal cord in vitro. A, Relative amplitudes of the monosynaptic responses before (CTL) and 30–60 min after ZnCl2 (1 and 10 μm, n = 6 and n = 11, respectively; p > 0.05). B, Relative amplitudes of the monosynaptic reflex at different stimulation frequencies before (CTL) and 30–60 min after ZnCl2 (1 and 10 μm, n = 6 and n = 11, respectively). Twelve values (the first three discarded) were averaged for each animal. The RDD was significantly increased by ZnCl2 at 0.5 and 1 Hz. C, Mean areas of the polysynaptic responses before (CTL) and 30–60 min after 1 (n = 5) and 10 μm (n = 10) ZnCl2. Statistical differences between CTL and ZnCl2 are noted above impulse frequencies in B and above histograms in C (Wilcoxon test; *p < 0.05, **p < 0.01).
Figure 7.
Figure 7.
ZnCl2 increases both the strength and the duration of reciprocal inhibition only in SCI neonatal rats. A, Amplitude of the normalized test response before (CTL) and 30–60 min after ZnCl2 (10 μm) in untransected P4–P6 rats. Curves were obtained from eight animals with eight observations at each delay. B, Histograms represent the strength of inhibition at short and long interstimulus intervals (10 and 30 ms, respectively). C, Linear regression analysis of the data reported in A (r = 0.83 and r = 0.84, respectively for CTL and ZnCl2 conditions). D, Amplitude of the test response before and 30–60 min after ZnCl2 (10 μm) in SCI P4–P6 rats. Curves were obtained from seven animals with at least five observations at each delay. E, Histograms represent the strength of inhibition at short and long interstimulus intervals (10 and 30 ms, respectively). F, Linear regression analysis of the data reported in D (r = 0.67 and r = 0.75, respectively for SCI and ZnCl2 conditions). Statistical differences between SCI and ZnCl2 conditions are noted above delays in D, above histograms in E and near regression lines in F (Wilcoxon test and linear regression analysis; *p < 0.05, **p < 0.01).

Similar articles

Cited by

References

    1. Boorman GI, Lee RG, Becker WJ, Windhorst UR. Impaired “natural reciprocal inhibition” in patients with spasticity due to incomplete spinal cord injury. Electroencephalogr Clin Neurophysiol. 1996;101:84–92. doi: 10.1016/0924-980X(95)00262-J. - DOI - PubMed
    1. Bos R, Sadlaoud K, Boulenguez P, Buttigieg D, Liabeuf S, Brocard C, Haase G, Bras H, Vinay L. Activation of 5-HT2A receptors upregulates the function of the neuronal K-Cl cotransporter KCC2. Proc Natl Acad Sci U S A. 2013;110:348–353. doi: 10.1073/pnas.1213680110. - DOI - PMC - PubMed
    1. Boulenguez P, Vinay L. Strategies to restore motor functions after spinal cord injury. Curr Opin Neurobiol. 2009;19:587–600. doi: 10.1016/j.conb.2009.10.005. - DOI - PubMed
    1. Boulenguez P, Liabeuf S, Bos R, Bras H, Jean-Xavier C, Brocard C, Stil A, Darbon P, Cattaert D, Delpire E, Marsala M, Vinay L. Down-regulation of the potassium-chloride cotransporter KCC2 contributes to spasticity after spinal cord injury. Nat Med. 2010;16:302–307. doi: 10.1038/nm.2107. - DOI - PubMed
    1. Chen G, Trombley PQ, van den Pol AN. Excitatory actions of GABA in developing rat hypothalamic neurones. J Physiol. 1996;494:451–464. doi: 10.1113/jphysiol.1996.sp021505. - DOI - PMC - PubMed

Publication types

MeSH terms

LinkOut - more resources